| Param | Original file | Final file |
|---|---|---|
| Filename | modeM0/AS1A12_066T01_9000005562cztM0_level2.fits | modeM0/AS1A12_066T01_9000005562cztM0_level2_quad_clean.evt |
| Size (bytes) | 652,711,680 | 701,363,520 |
| Size | 622.5 MB | 668.9 MB |
| Events in quadrant A | 4,119,246 | 4,700,377 |
| Events in quadrant B | 3,953,122 | 4,704,953 |
| Events in quadrant C | 3,333,130 | 2,958,019 |
| Events in quadrant D | 3,099,732 | 3,632,351 |
| Mode M0 | |||
|---|---|---|---|
| Quadrant | BADHDUFLAG | Total packets | Discarded packets |
| A | 0 | 175041 | 0 |
| B | 0 | 164929 | 0 |
| C | 0 | 381766 | 0 |
| D | 0 | 222640 | 0 |
| Mode M9 | |||
|---|---|---|---|
| Quadrant | BADHDUFLAG | Total packets | Discarded packets |
| A | 0 | 279 | 0 |
| B | 0 | 279 | 0 |
| C | 0 | 279 | 0 |
| D | 0 | 279 | 0 |
| Mode SS | |||
|---|---|---|---|
| Quadrant | BADHDUFLAG | Total packets | Discarded packets |
| A | 0 | 1560 | 0 |
| B | 0 | 1560 | 0 |
| C | 0 | 1560 | 0 |
| D | 0 | 1560 | 0 |
| Quadrant | Total seconds | Saturated seconds | Saturation percentage |
|---|---|---|---|
| A | 76459 | 730 | 0.954760% |
| B | 76459 | 877 | 1.147020% |
| C | 76459 | 25679 | 33.585320% |
| D | 76459 | 14440 | 18.885939% |
Noise dominated data is calculated using 1-second bins in cleaned event files. If a bin has >2000 counts, and if more than 50% of those come from <1% of pixels, then it is considered to be noise-dominated and hence unusable.
| Quadrant | # 1 sec bins | Bins with >0 counts | Bins with >2000 counts | High rate bins dominated by noise | Noise dominated (total time) | Noise dominated (detector-on time) | Marked lightcurve |
|---|---|---|---|---|---|---|---|
| A | 110272 | 76455 | 0 | 0 | 0.00% | 0.00% |  |
| B | 110272 | 76460 | 0 | 0 | 0.00% | 0.00% | 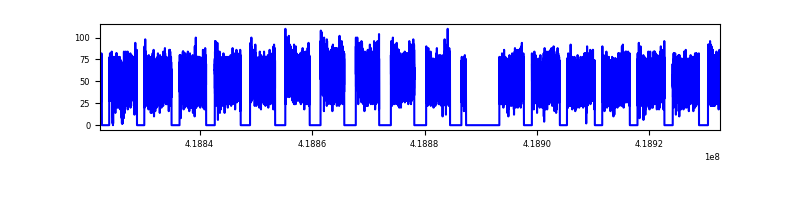 |
| C | 110272 | 76134 | 0 | 0 | 0.00% | 0.00% | 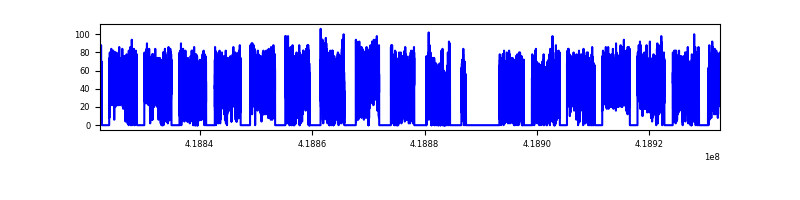 |
| D | 110272 | 75893 | 0 | 0 | 0.00% | 0.00% | 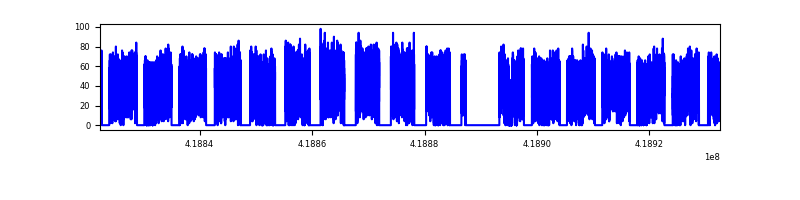 |
Top three noisy pixels from each quadrant. If the there are fewer than three noisy pixels in the level2.evt file, extra rows are filled as -1
| Pixel properties | Quadrant properties | ||||||
|---|---|---|---|---|---|---|---|
| Quadrant | DetID | PixID | Counts | Sigma | Mean | Median | Sigma |
| A | 9 | 19 | 3396 | 8.77 | 1075 | 1005 | 272.7 |
| A | 7 | 110 | 3381 | 8.71 | 1075 | 1005 | 272.7 |
| A | 0 | 29 | 3285 | 8.36 | 1075 | 1005 | 272.7 |
| B | 2 | 9 | 3410 | 11.97 | 1046 | 997 | 201.6 |
| B | 3 | 80 | 2886 | 9.37 | 1046 | 997 | 201.6 |
| B | 3 | 17 | 2867 | 9.28 | 1046 | 997 | 201.6 |
| C | 1 | 81 | 2741 | 8.49 | 880 | 823 | 226.0 |
| C | 1 | 80 | 2673 | 8.18 | 880 | 823 | 226.0 |
| C | 3 | 203 | 2561 | 7.69 | 880 | 823 | 226.0 |
| D | 6 | 67 | 2327 | 5.7 | 901 | 820 | 264.2 |
| D | 10 | 189 | 2304 | 5.62 | 901 | 820 | 264.2 |
| D | 4 | 160 | 2301 | 5.61 | 901 | 820 | 264.2 |
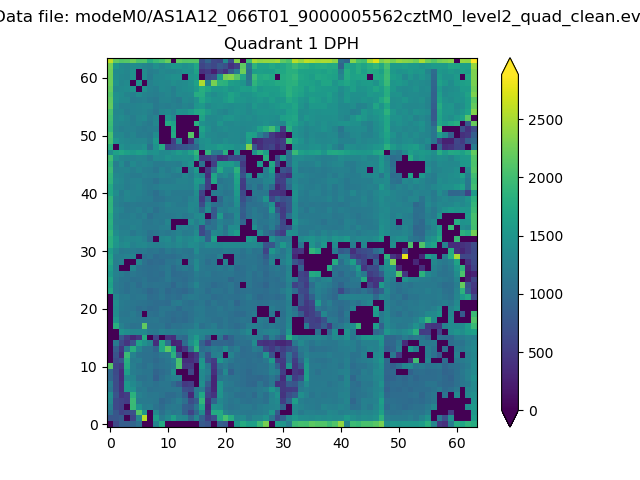
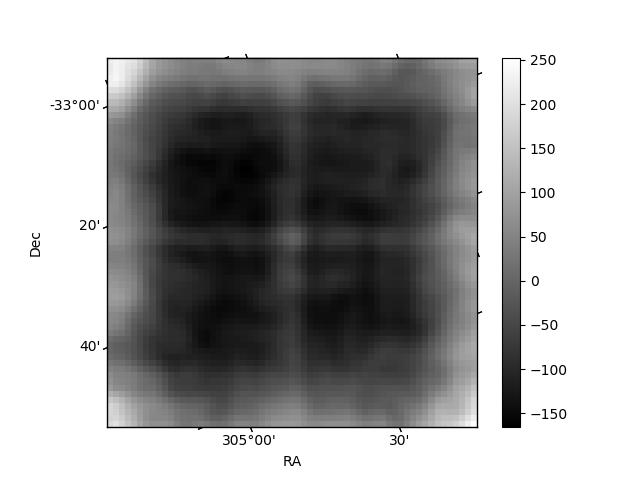
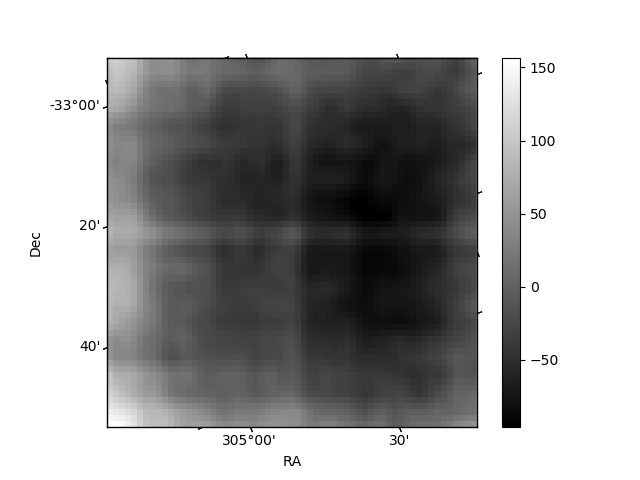
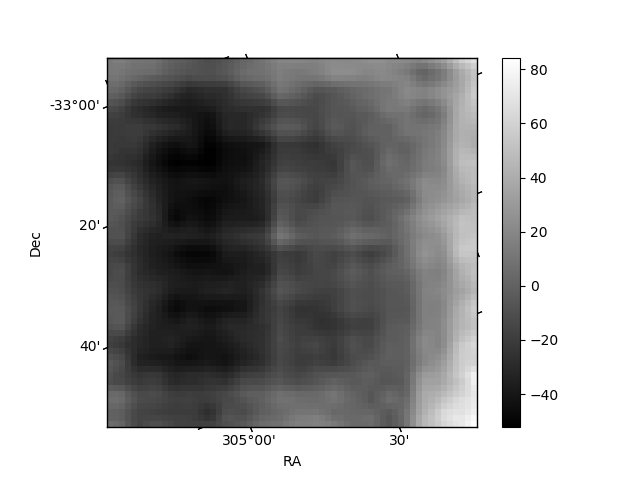
Histogram calculated using DETX and DETY for each event in the final _common_clean file
| Quadrant A |  |
 |
Quadrant B |
|---|---|---|---|
| Quadrant D |  |
 |
Quadrant C |
| Plot type | Count rate plots | Images |
|---|---|---|
| Comparison with Poisson distribution Blue bars denote a histogram of data divided into 1 sec bins. Red curve is a Poisson curve with rate = median count rate of data. |
 |
 |
| Quadrant-wise count rates Data is divided into 100 sec bins |
 |
|
| Module-wise count rates for Quadrant A Data is divided into 100 sec bins |
 |
 |
| Module-wise count rates for Quadrant B Data is divided into 100 sec bins |
 |
 |
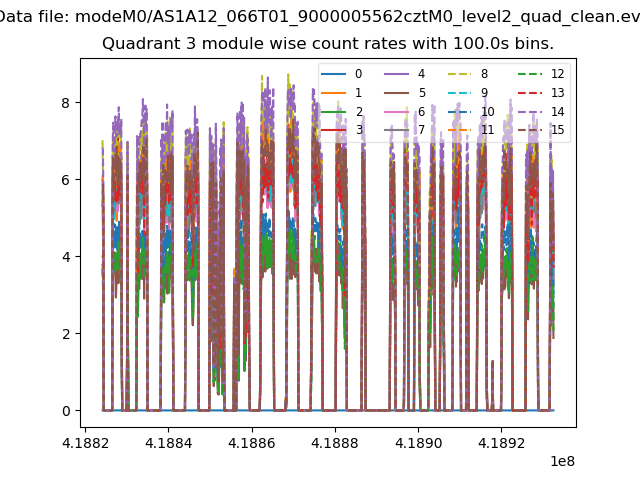
| Module-wise count rates for Quadrant C Data is divided into 100 sec bins |
 |
 |
| Module-wise count rates for Quadrant D Data is divided into 100 sec bins |
 |
 |
| Parameter | Plot |
|---|---|
| CZT HV Monitor |  |
| D_VDD |  |
| Temperature 1 |  |
| Veto HV Monitor |  |
| Veto LLD |  |
| Alpha Counter |  |
| _CPM_Rate |  |
| CZT Counter |  |
| +2.5 Volts monitor |  |
| +5 Volts monitor | 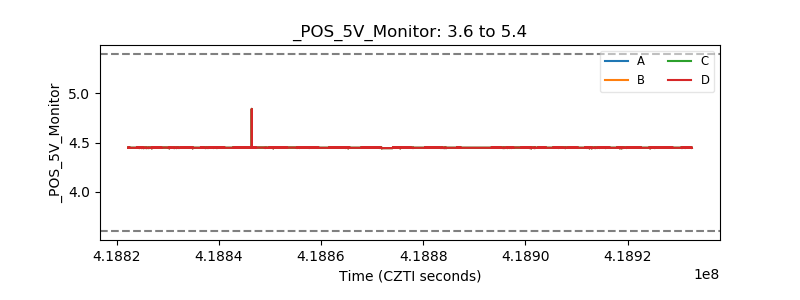 |
| _ROLL_ROT |  |
| _Roll_DEC |  |
| _Roll_RA |  |
| Veto Counter |  |