| Param | Original file | Final file |
|---|---|---|
| Filename | modeM0/AS1A12_068T02_9000005564cztM0_level2.fits | modeM0/AS1A12_068T02_9000005564cztM0_level2_quad_clean.evt |
| Size (bytes) | 397,290,240 | 340,358,400 |
| Size | 378.9 MB | 324.6 MB |
| Events in quadrant A | 2,455,286 | 2,000,102 |
| Events in quadrant B | 2,358,246 | 2,024,514 |
| Events in quadrant C | 2,246,236 | 1,671,049 |
| Events in quadrant D | 1,907,006 | 1,549,576 |
| Mode M0 | |||
|---|---|---|---|
| Quadrant | BADHDUFLAG | Total packets | Discarded packets |
| A | 0 | 95963 | 0 |
| B | 0 | 93251 | 0 |
| C | 0 | 170635 | 0 |
| D | 0 | 110159 | 0 |
| Mode SS | |||
|---|---|---|---|
| Quadrant | BADHDUFLAG | Total packets | Discarded packets |
| A | 0 | 912 | 0 |
| B | 0 | 912 | 0 |
| C | 0 | 912 | 0 |
| D | 0 | 912 | 0 |
| Mode M9 | |||
|---|---|---|---|
| Quadrant | BADHDUFLAG | Total packets | Discarded packets |
| A | 0 | 179 | 0 |
| B | 0 | 179 | 0 |
| C | 0 | 179 | 0 |
| D | 0 | 179 | 0 |
| Quadrant | Total seconds | Saturated seconds | Saturation percentage |
|---|---|---|---|
| A | 44574 | 84 | 0.188451% |
| B | 44574 | 323 | 0.724638% |
| C | 44574 | 5818 | 13.052452% |
| D | 44573 | 5488 | 12.312386% |
Noise dominated data is calculated using 1-second bins in cleaned event files. If a bin has >2000 counts, and if more than 50% of those come from <1% of pixels, then it is considered to be noise-dominated and hence unusable.
| Quadrant | # 1 sec bins | Bins with >0 counts | Bins with >2000 counts | High rate bins dominated by noise | Noise dominated (total time) | Noise dominated (detector-on time) | Marked lightcurve |
|---|---|---|---|---|---|---|---|
| A | 62628 | 44571 | 0 | 0 | 0.00% | 0.00% | 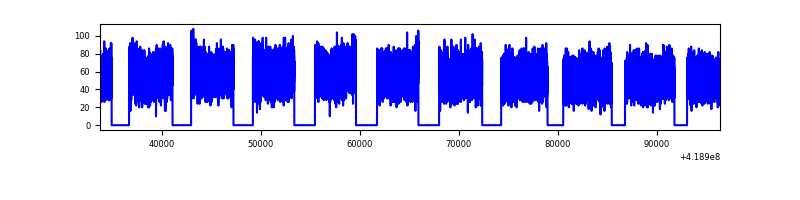 |
| B | 62628 | 44526 | 0 | 0 | 0.00% | 0.00% | 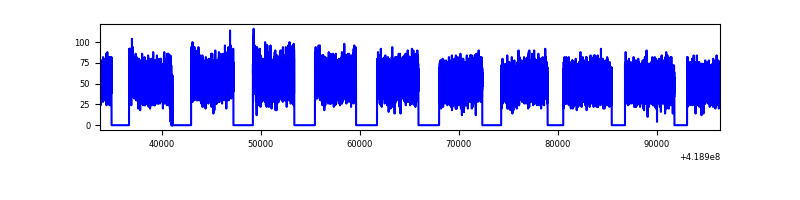 |
| C | 62629 | 44511 | 0 | 0 | 0.00% | 0.00% |  |
| D | 62628 | 44471 | 0 | 0 | 0.00% | 0.00% | 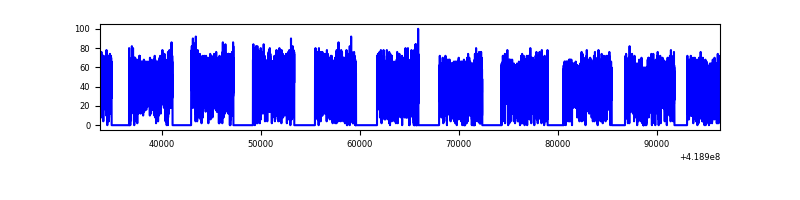 |
Top three noisy pixels from each quadrant. If the there are fewer than three noisy pixels in the level2.evt file, extra rows are filled as -1
| Pixel properties | Quadrant properties | ||||||
|---|---|---|---|---|---|---|---|
| Quadrant | DetID | PixID | Counts | Sigma | Mean | Median | Sigma |
| A | 7 | 110 | 2088 | 9.04 | 640 | 599 | 164.7 |
| A | 9 | 19 | 2016 | 8.6 | 640 | 599 | 164.7 |
| A | 0 | 29 | 1880 | 7.78 | 640 | 599 | 164.7 |
| B | 2 | 9 | 2032 | 11.82 | 623 | 595 | 121.6 |
| B | 5 | 128 | 1676 | 8.89 | 623 | 595 | 121.6 |
| B | 5 | 232 | 1654 | 8.71 | 623 | 595 | 121.6 |
| C | 1 | 81 | 1820 | 8.21 | 593 | 555 | 154.0 |
| C | 1 | 80 | 1786 | 7.99 | 593 | 555 | 154.0 |
| C | 3 | 202 | 1742 | 7.71 | 593 | 555 | 154.0 |
| D | 10 | 189 | 1468 | 5.94 | 554 | 505 | 162.0 |
| D | 7 | 3 | 1456 | 5.87 | 554 | 505 | 162.0 |
| D | 6 | 67 | 1416 | 5.62 | 554 | 505 | 162.0 |
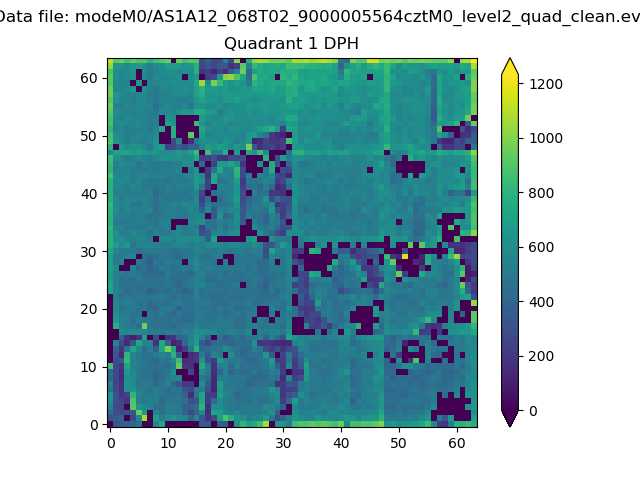
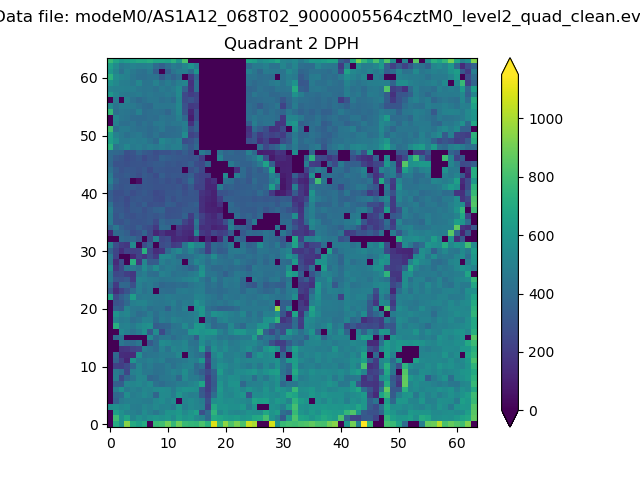
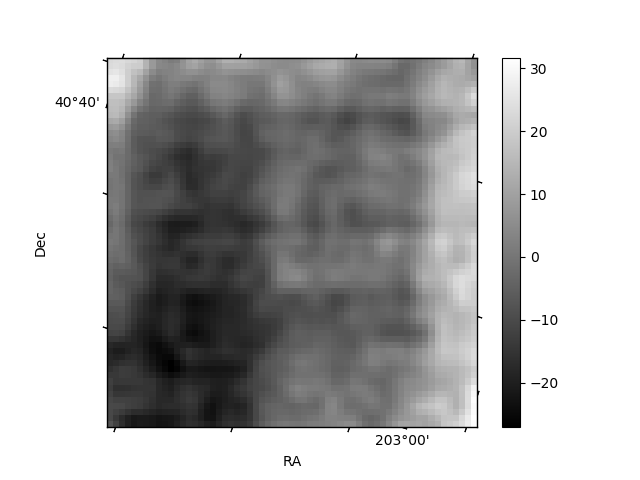
Histogram calculated using DETX and DETY for each event in the final _common_clean file
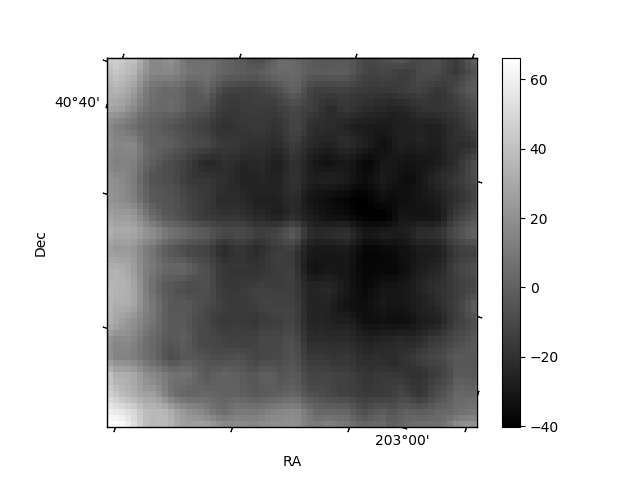
| Quadrant A | 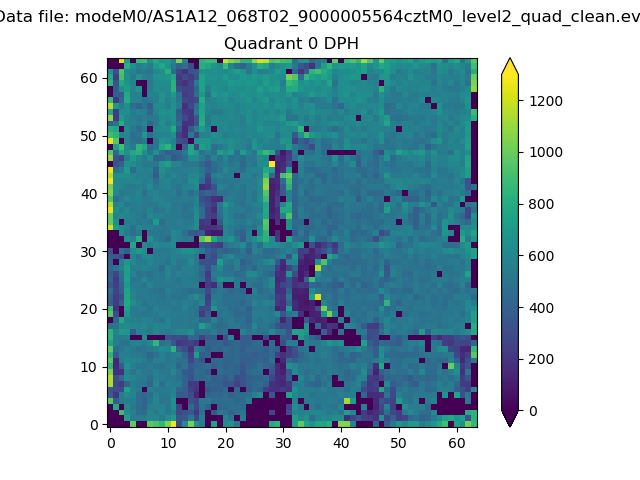 |
 |
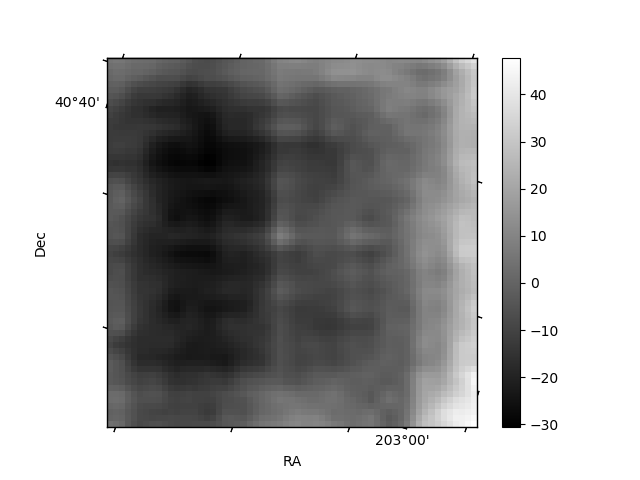
Quadrant B |
|---|---|---|---|
| Quadrant D | 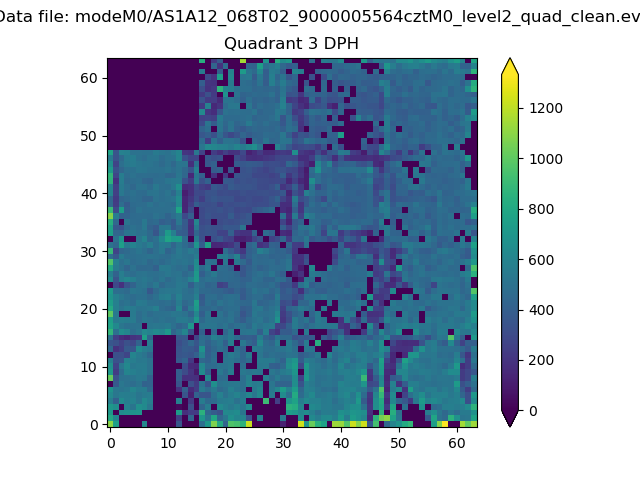 |
 |
Quadrant C |
| Plot type | Count rate plots | Images |
|---|---|---|
| Comparison with Poisson distribution Blue bars denote a histogram of data divided into 1 sec bins. Red curve is a Poisson curve with rate = median count rate of data. |
 |
 |
| Quadrant-wise count rates Data is divided into 100 sec bins |
 |
|
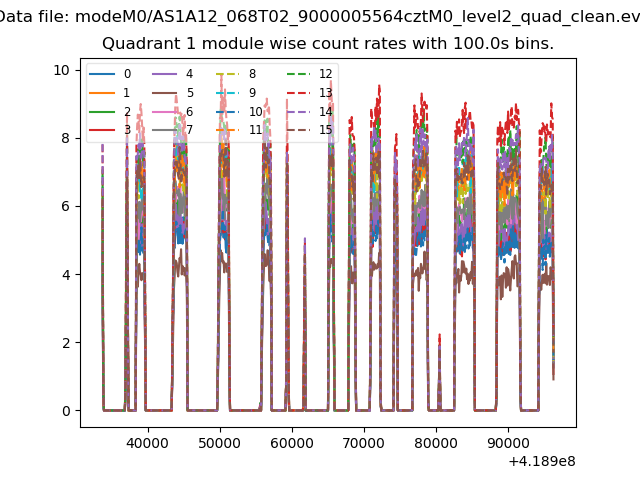
| Module-wise count rates for Quadrant A Data is divided into 100 sec bins |
 |
 |
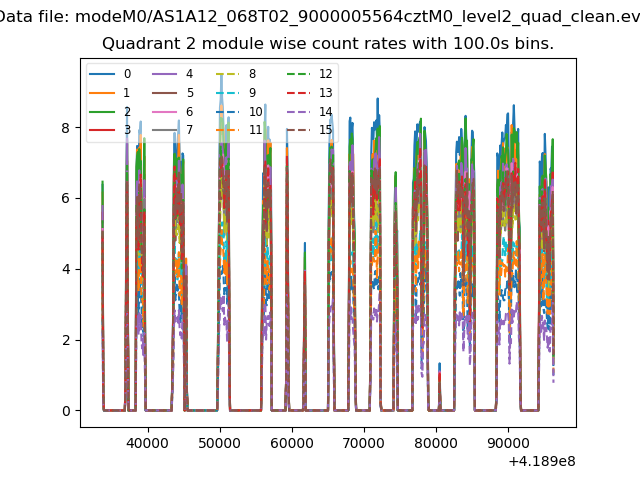
| Module-wise count rates for Quadrant B Data is divided into 100 sec bins |
 |
 |
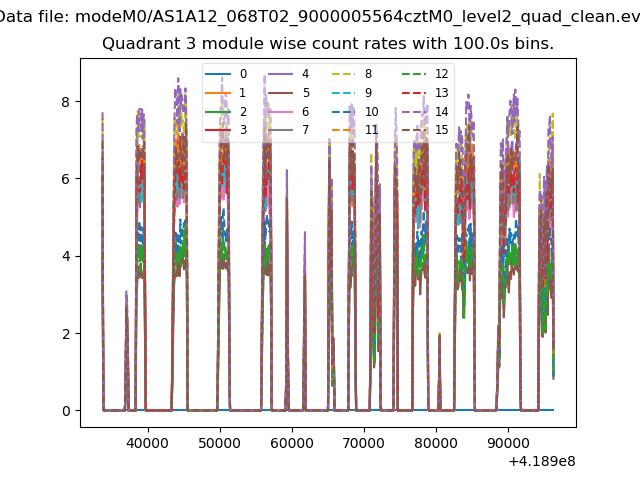
| Module-wise count rates for Quadrant C Data is divided into 100 sec bins |
 |
 |
| Module-wise count rates for Quadrant D Data is divided into 100 sec bins |
 |
 |
| Parameter | Plot |
|---|---|
| CZT HV Monitor |  |
| D_VDD | 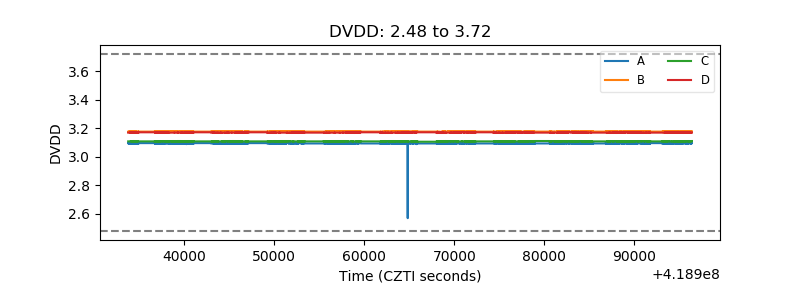 |
| Temperature 1 | 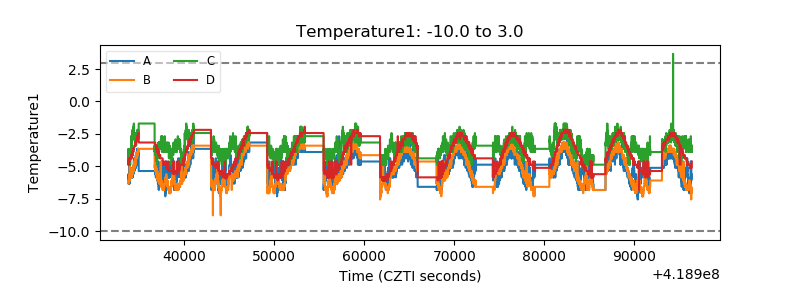 |
| Veto HV Monitor | 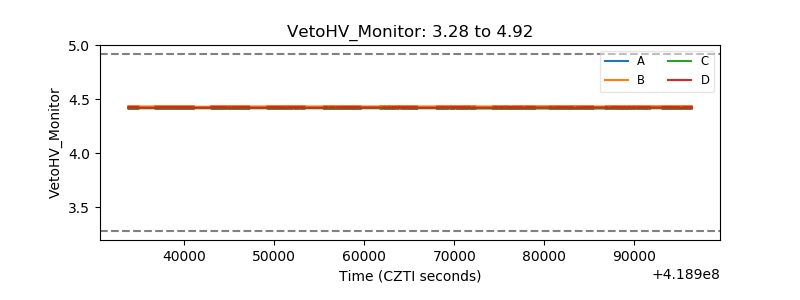 |
| Veto LLD | 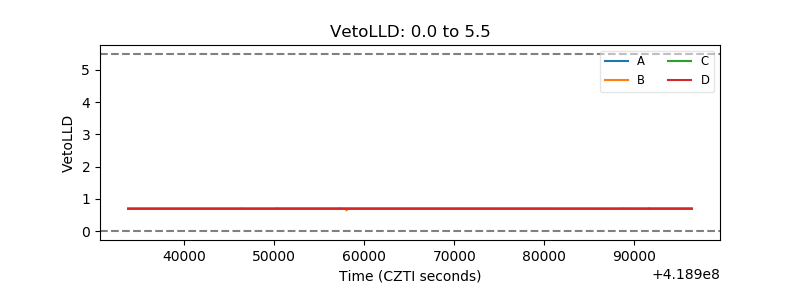 |
| Alpha Counter |  |
| _CPM_Rate | 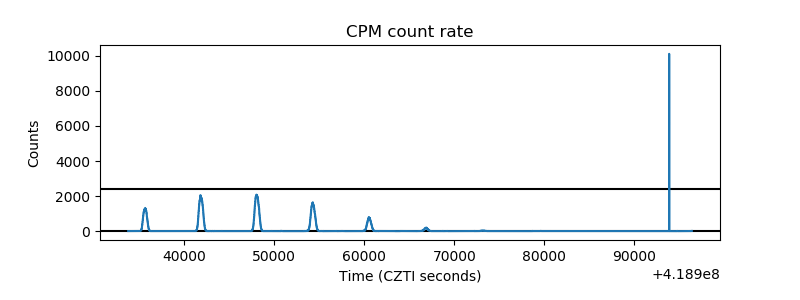 |
| CZT Counter |  |
| +2.5 Volts monitor | 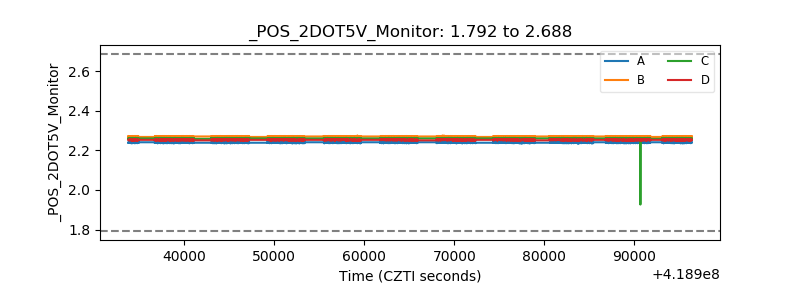 |
| +5 Volts monitor |  |
| _ROLL_ROT |  |
| _Roll_DEC | 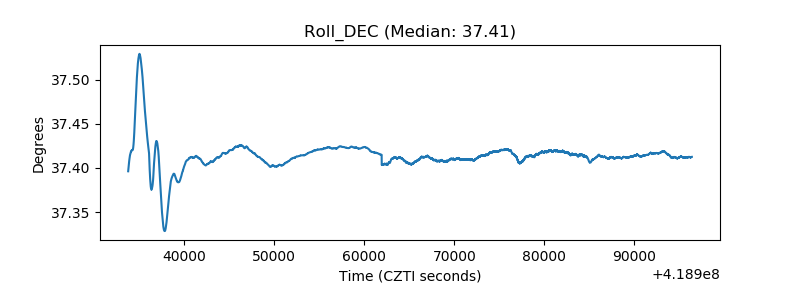 |
| _Roll_RA | 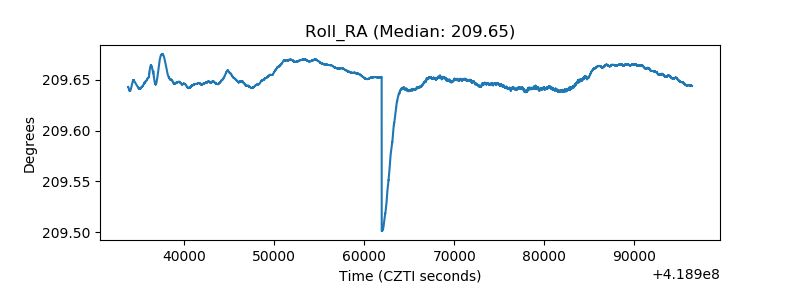 |
| Veto Counter | 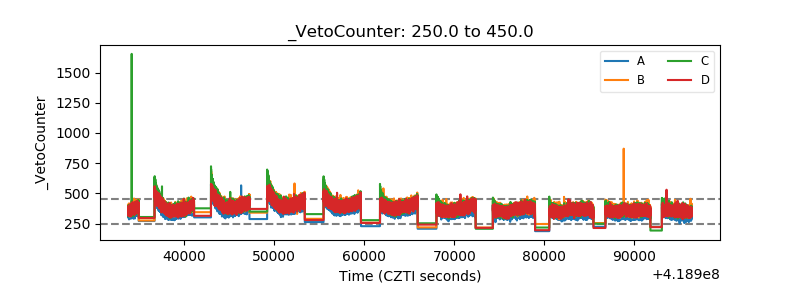 |