| Param | Original file | Final file |
|---|---|---|
| Filename | modeM0/AS1A12_095T02_9000005568cztM0_level2.fits | modeM0/AS1A12_095T02_9000005568cztM0_level2_quad_clean.evt |
| Size (bytes) | 780,632,640 | 767,856,960 |
| Size | 744.5 MB | 732.3 MB |
| Events in quadrant A | 4,703,098 | 4,572,998 |
| Events in quadrant B | 4,523,492 | 4,584,904 |
| Events in quadrant C | 4,606,156 | 4,369,977 |
| Events in quadrant D | 3,849,032 | 3,769,196 |
| Mode M9 | |||
|---|---|---|---|
| Quadrant | BADHDUFLAG | Total packets | Discarded packets |
| A | 0 | 341 | 0 |
| B | 0 | 341 | 0 |
| C | 0 | 341 | 0 |
| D | 0 | 341 | 0 |
| Mode SS | |||
|---|---|---|---|
| Quadrant | BADHDUFLAG | Total packets | Discarded packets |
| A | 0 | 1778 | 0 |
| B | 0 | 1778 | 0 |
| C | 0 | 1778 | 0 |
| D | 0 | 1778 | 0 |
| Mode M0 | |||
|---|---|---|---|
| Quadrant | BADHDUFLAG | Total packets | Discarded packets |
| A | 0 | 191880 | 0 |
| B | 0 | 193391 | 0 |
| C | 0 | 193814 | 0 |
| D | 0 | 217791 | 0 |
| Quadrant | Total seconds | Saturated seconds | Saturation percentage |
|---|---|---|---|
| A | 86901 | 432 | 0.497117% |
| B | 86901 | 1397 | 1.607576% |
| C | 86849 | 1361 | 1.567088% |
| D | 86843 | 5164 | 5.946363% |
Noise dominated data is calculated using 1-second bins in cleaned event files. If a bin has >2000 counts, and if more than 50% of those come from <1% of pixels, then it is considered to be noise-dominated and hence unusable.
| Quadrant | # 1 sec bins | Bins with >0 counts | Bins with >2000 counts | High rate bins dominated by noise | Noise dominated (total time) | Noise dominated (detector-on time) | Marked lightcurve |
|---|---|---|---|---|---|---|---|
| A | 121354 | 86887 | 0 | 0 | 0.00% | 0.00% | 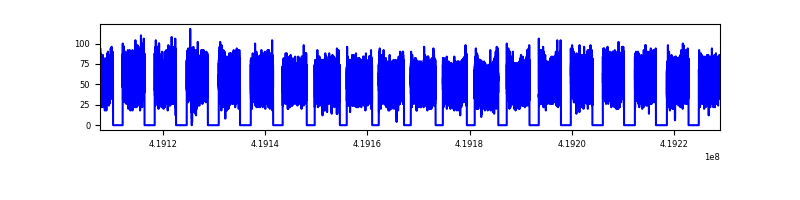 |
| B | 121354 | 86882 | 0 | 0 | 0.00% | 0.00% |  |
| C | 121354 | 86824 | 0 | 0 | 0.00% | 0.00% |  |
| D | 121354 | 86714 | 0 | 0 | 0.00% | 0.00% | 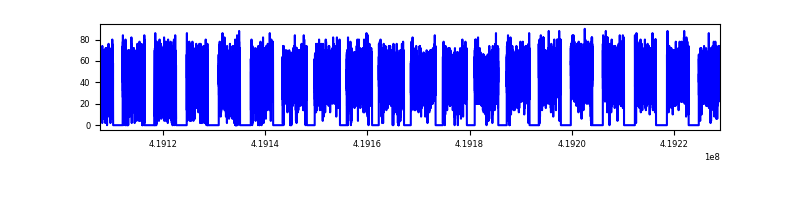 |
Top three noisy pixels from each quadrant. If the there are fewer than three noisy pixels in the level2.evt file, extra rows are filled as -1
| Pixel properties | Quadrant properties | ||||||
|---|---|---|---|---|---|---|---|
| Quadrant | DetID | PixID | Counts | Sigma | Mean | Median | Sigma |
| A | 0 | 29 | 3878 | 8.8 | 1226 | 1150 | 309.9 |
| A | 7 | 110 | 3838 | 8.67 | 1226 | 1150 | 309.9 |
| A | 9 | 19 | 3810 | 8.58 | 1226 | 1150 | 309.9 |
| B | 2 | 9 | 3890 | 11.94 | 1195 | 1139 | 230.3 |
| B | 3 | 80 | 3329 | 9.51 | 1195 | 1139 | 230.3 |
| B | 3 | 17 | 3138 | 8.68 | 1195 | 1139 | 230.3 |
| C | 1 | 81 | 3737 | 8.24 | 1217 | 1135 | 315.9 |
| C | 3 | 202 | 3600 | 7.8 | 1217 | 1135 | 315.9 |
| C | 1 | 80 | 3561 | 7.68 | 1217 | 1135 | 315.9 |
| D | 10 | 189 | 2877 | 6.33 | 1097 | 994 | 297.4 |
| D | 7 | 3 | 2852 | 6.25 | 1097 | 994 | 297.4 |
| D | 6 | 67 | 2803 | 6.08 | 1097 | 994 | 297.4 |
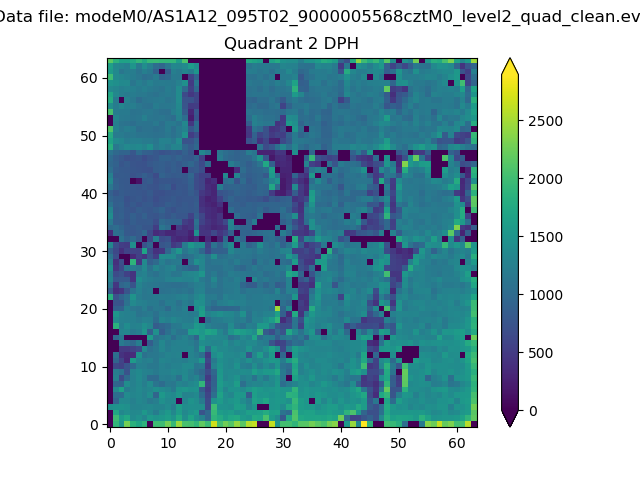
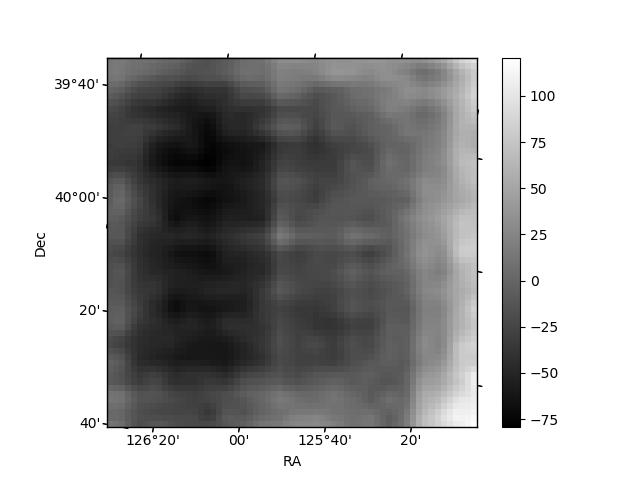
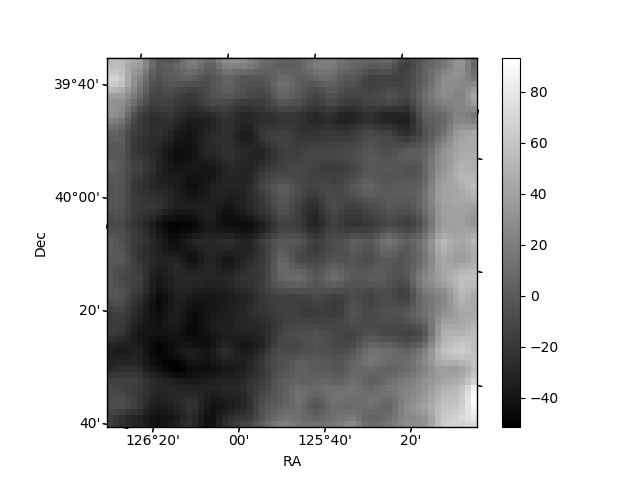
Histogram calculated using DETX and DETY for each event in the final _common_clean file
| Quadrant A | 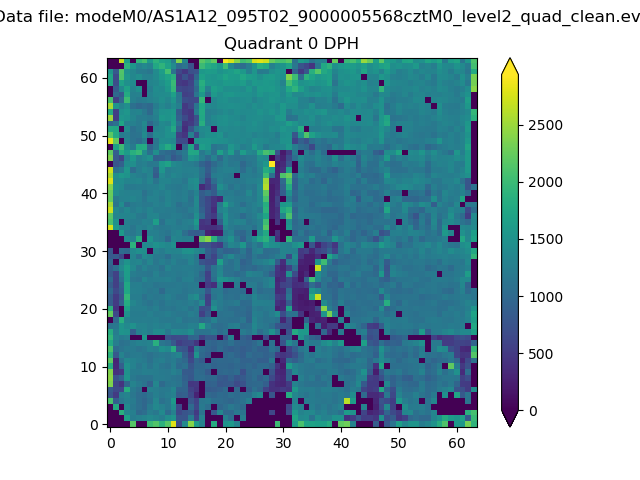 |
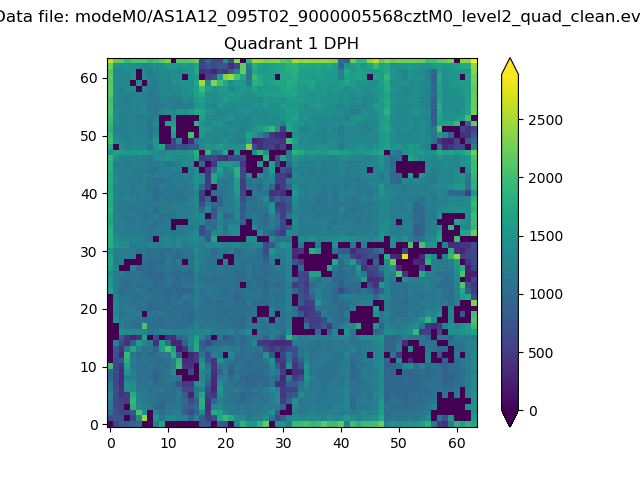 |
Quadrant B |
|---|---|---|---|
| Quadrant D | 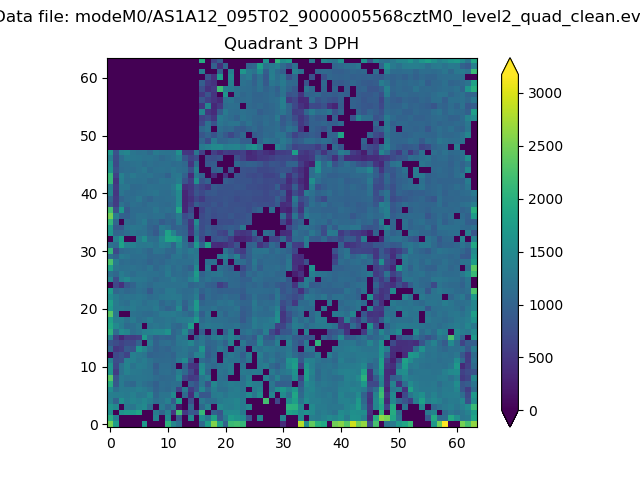 |
 |
Quadrant C |
| Plot type | Count rate plots | Images |
|---|---|---|
| Comparison with Poisson distribution Blue bars denote a histogram of data divided into 1 sec bins. Red curve is a Poisson curve with rate = median count rate of data. |
 |
 |
| Quadrant-wise count rates Data is divided into 100 sec bins |
 |
|
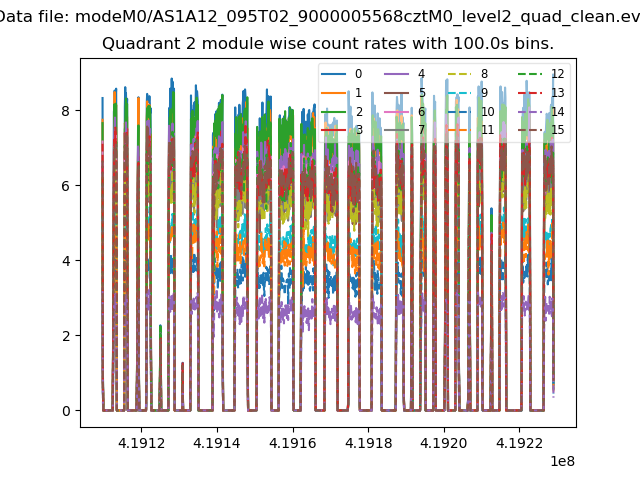
| Module-wise count rates for Quadrant A Data is divided into 100 sec bins |
 |
 |
| Module-wise count rates for Quadrant B Data is divided into 100 sec bins |
 |
 |
| Module-wise count rates for Quadrant C Data is divided into 100 sec bins |
 |
 |
| Module-wise count rates for Quadrant D Data is divided into 100 sec bins |
 |
 |
| Parameter | Plot |
|---|---|
| CZT HV Monitor |  |
| D_VDD | 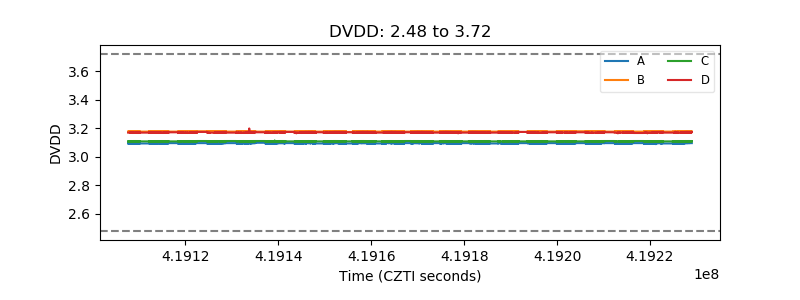 |
| Temperature 1 |  |
| Veto HV Monitor | 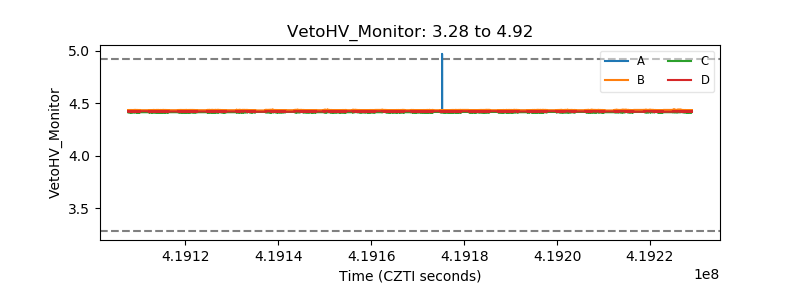 |
| Veto LLD | 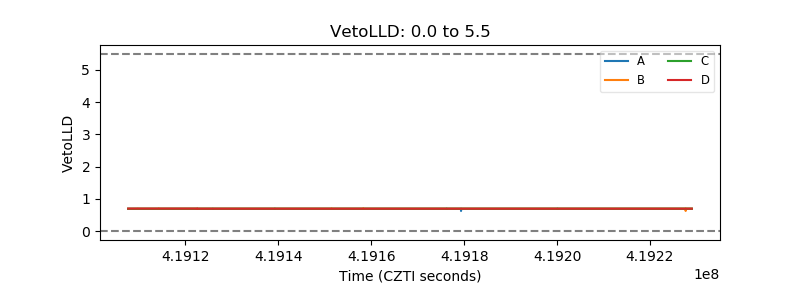 |
| Alpha Counter | 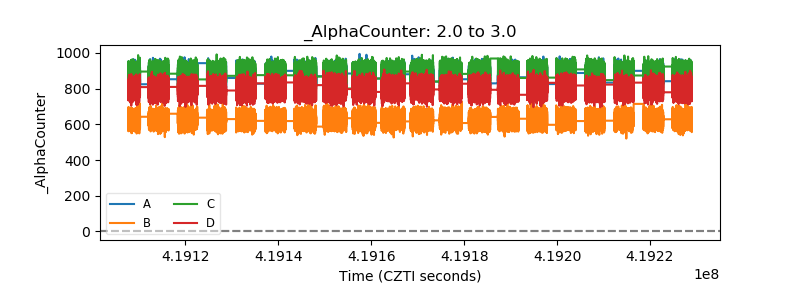 |
| _CPM_Rate | 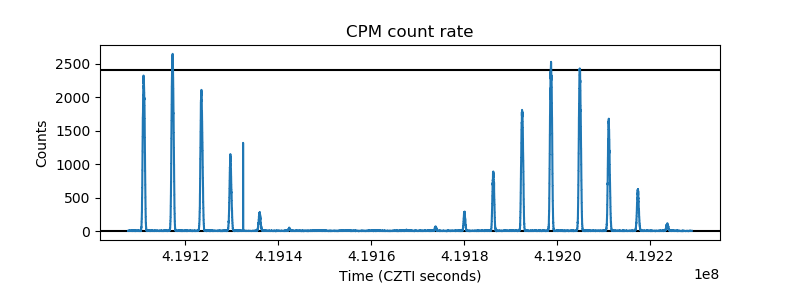 |
| CZT Counter | 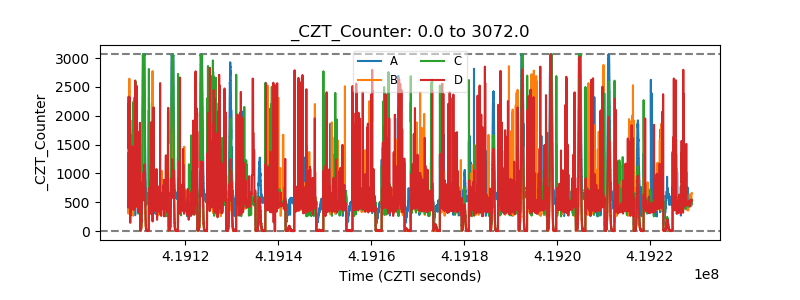 |
| +2.5 Volts monitor | 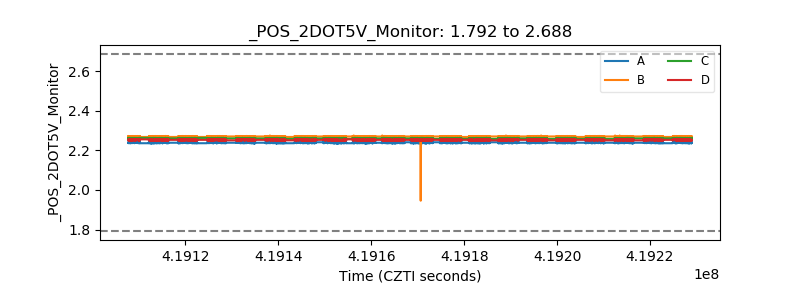 |
| +5 Volts monitor |  |
| _ROLL_ROT | 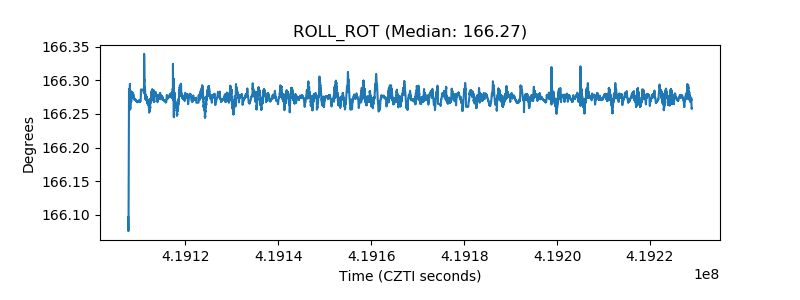 |
| _Roll_DEC | 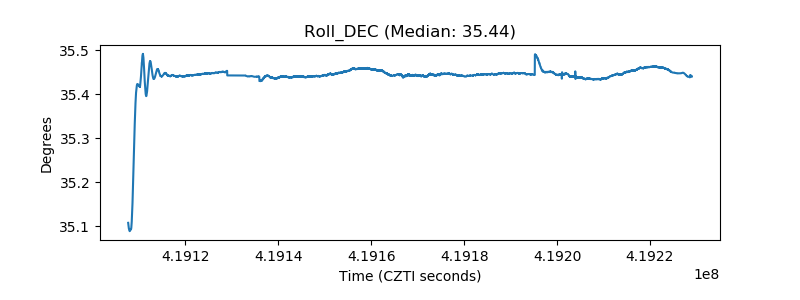 |
| _Roll_RA |  |
| Veto Counter | 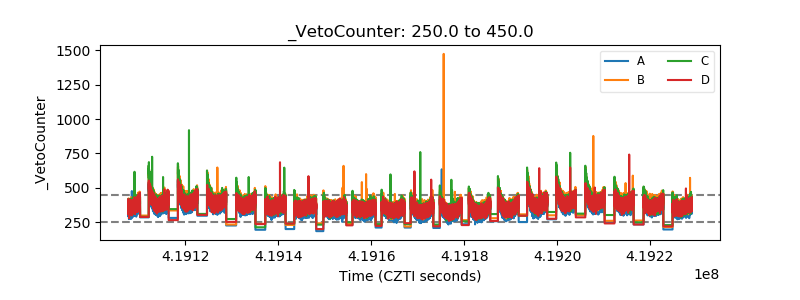 |