| Param | Original file | Final file |
|---|---|---|
| Filename | modeM0/AS1A12_097T01_9000005574cztM0_level2.fits | modeM0/AS1A12_097T01_9000005574cztM0_level2_quad_clean.evt |
| Size (bytes) | 1,349,671,680 | 1,351,330,560 |
| Size | 1.3 GB | 1.3 GB |
| Events in quadrant A | 8,114,584 | 8,020,864 |
| Events in quadrant B | 7,652,402 | 7,884,684 |
| Events in quadrant C | 8,006,346 | 7,892,748 |
| Events in quadrant D | 6,666,148 | 6,698,164 |
| Mode M9 | |||
|---|---|---|---|
| Quadrant | BADHDUFLAG | Total packets | Discarded packets |
| A | 0 | 574 | 0 |
| B | 0 | 574 | 0 |
| C | 0 | 574 | 0 |
| D | 0 | 575 | 0 |
| Mode SS | |||
|---|---|---|---|
| Quadrant | BADHDUFLAG | Total packets | Discarded packets |
| A | 0 | 3102 | 0 |
| B | 0 | 3102 | 0 |
| C | 0 | 3102 | 0 |
| D | 0 | 3102 | 0 |
| Mode M0 | |||
|---|---|---|---|
| Quadrant | BADHDUFLAG | Total packets | Discarded packets |
| A | 0 | 338912 | 0 |
| B | 0 | 406593 | 0 |
| C | 0 | 322462 | 0 |
| D | 0 | 464862 | 0 |
| Quadrant | Total seconds | Saturated seconds | Saturation percentage |
|---|---|---|---|
| A | 152228 | 519 | 0.340936% |
| B | 152227 | 9178 | 6.029154% |
| C | 152227 | 1014 | 0.666110% |
| D | 152227 | 8349 | 5.484572% |
Noise dominated data is calculated using 1-second bins in cleaned event files. If a bin has >2000 counts, and if more than 50% of those come from <1% of pixels, then it is considered to be noise-dominated and hence unusable.
| Quadrant | # 1 sec bins | Bins with >0 counts | Bins with >2000 counts | High rate bins dominated by noise | Noise dominated (total time) | Noise dominated (detector-on time) | Marked lightcurve |
|---|---|---|---|---|---|---|---|
| A | 217433 | 152230 | 0 | 0 | 0.00% | 0.00% |  |
| B | 217433 | 152178 | 0 | 0 | 0.00% | 0.00% |  |
| C | 217433 | 152181 | 0 | 0 | 0.00% | 0.00% |  |
| D | 217433 | 152021 | 0 | 0 | 0.00% | 0.00% |  |
Top three noisy pixels from each quadrant. If the there are fewer than three noisy pixels in the level2.evt file, extra rows are filled as -1
| Pixel properties | Quadrant properties | ||||||
|---|---|---|---|---|---|---|---|
| Quadrant | DetID | PixID | Counts | Sigma | Mean | Median | Sigma |
| A | 7 | 110 | 6659 | 8.86 | 2119 | 1977 | 528.6 |
| A | 9 | 19 | 6502 | 8.56 | 2119 | 1977 | 528.6 |
| A | 0 | 29 | 6469 | 8.5 | 2119 | 1977 | 528.6 |
| B | 2 | 9 | 6352 | 11.39 | 2024 | 1926 | 388.7 |
| B | 3 | 80 | 5474 | 9.13 | 2024 | 1926 | 388.7 |
| B | 3 | 17 | 5357 | 8.83 | 2024 | 1926 | 388.7 |
| C | 1 | 81 | 6472 | 8.25 | 2115 | 1974 | 545.0 |
| C | 1 | 80 | 6227 | 7.8 | 2115 | 1974 | 545.0 |
| C | 3 | 202 | 6169 | 7.7 | 2115 | 1974 | 545.0 |
| D | 10 | 189 | 4996 | 6.39 | 1911 | 1737 | 510.1 |
| D | 4 | 160 | 4985 | 6.37 | 1911 | 1737 | 510.1 |
| D | 7 | 3 | 4883 | 6.17 | 1911 | 1737 | 510.1 |
Histogram calculated using DETX and DETY for each event in the final _common_clean file
| Quadrant A |  |
 |
Quadrant B |
|---|---|---|---|
| Quadrant D | 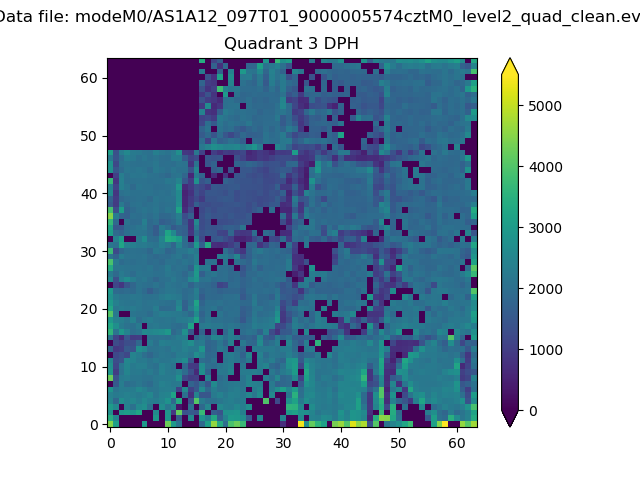 |
 |
Quadrant C |
| Plot type | Count rate plots | Images |
|---|---|---|
| Comparison with Poisson distribution Blue bars denote a histogram of data divided into 1 sec bins. Red curve is a Poisson curve with rate = median count rate of data. |
 |
 |
| Quadrant-wise count rates Data is divided into 100 sec bins |
 |
|
| Module-wise count rates for Quadrant A Data is divided into 100 sec bins |
 |
 |
| Module-wise count rates for Quadrant B Data is divided into 100 sec bins |
 |
 |
| Module-wise count rates for Quadrant C Data is divided into 100 sec bins |
 |
 |
| Module-wise count rates for Quadrant D Data is divided into 100 sec bins |
 |
 |
| Parameter | Plot |
|---|---|
| CZT HV Monitor |  |
| D_VDD |  |
| Temperature 1 |  |
| Veto HV Monitor |  |
| Veto LLD |  |
| Alpha Counter |  |
| _CPM_Rate |  |
| CZT Counter |  |
| +2.5 Volts monitor |  |
| +5 Volts monitor |  |
| _ROLL_ROT |  |
| _Roll_DEC |  |
| _Roll_RA |  |
| Veto Counter |  |