| Param | Original file | Final file |
|---|---|---|
| Filename | modeM0/AS1A12_102T01_9000005576cztM0_level2.fits | modeM0/AS1A12_102T01_9000005576cztM0_level2_quad_clean.evt |
| Size (bytes) | 449,530,560 | 567,201,600 |
| Size | 428.7 MB | 540.9 MB |
| Events in quadrant A | 2,677,276 | 3,559,256 |
| Events in quadrant B | 2,544,868 | 3,548,185 |
| Events in quadrant C | 2,652,604 | 3,476,184 |
| Events in quadrant D | 2,262,484 | 3,119,521 |
| Mode SS | |||
|---|---|---|---|
| Quadrant | BADHDUFLAG | Total packets | Discarded packets |
| A | 0 | 1038 | 0 |
| B | 0 | 1038 | 0 |
| C | 0 | 1038 | 0 |
| D | 0 | 1038 | 0 |
| Mode M0 | |||
|---|---|---|---|
| Quadrant | BADHDUFLAG | Total packets | Discarded packets |
| A | 0 | 108519 | 0 |
| B | 0 | 117745 | 0 |
| C | 0 | 106430 | 0 |
| D | 0 | 126416 | 0 |
| Mode M9 | |||
|---|---|---|---|
| Quadrant | BADHDUFLAG | Total packets | Discarded packets |
| A | 0 | 194 | 0 |
| B | 0 | 194 | 0 |
| C | 0 | 194 | 0 |
| D | 0 | 194 | 0 |
| Quadrant | Total seconds | Saturated seconds | Saturation percentage |
|---|---|---|---|
| A | 50647 | 107 | 0.211266% |
| B | 50647 | 1479 | 2.920212% |
| C | 50647 | 341 | 0.673288% |
| D | 50643 | 1278 | 2.523547% |
Noise dominated data is calculated using 1-second bins in cleaned event files. If a bin has >2000 counts, and if more than 50% of those come from <1% of pixels, then it is considered to be noise-dominated and hence unusable.
| Quadrant | # 1 sec bins | Bins with >0 counts | Bins with >2000 counts | High rate bins dominated by noise | Noise dominated (total time) | Noise dominated (detector-on time) | Marked lightcurve |
|---|---|---|---|---|---|---|---|
| A | 69433 | 50646 | 0 | 0 | 0.00% | 0.00% | 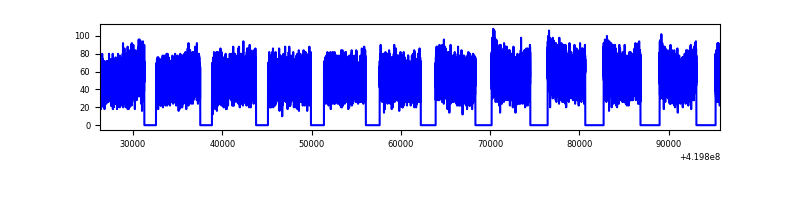 |
| B | 69433 | 50630 | 0 | 0 | 0.00% | 0.00% | 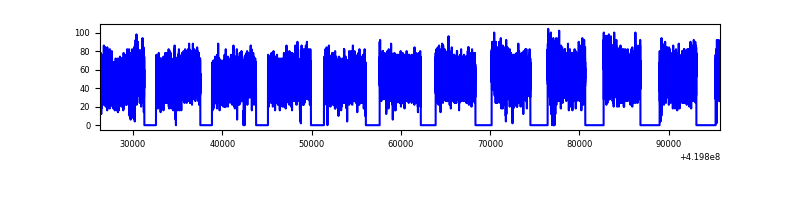 |
| C | 69433 | 50644 | 0 | 0 | 0.00% | 0.00% | 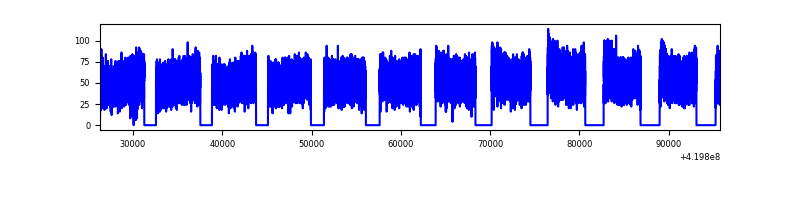 |
| D | 69433 | 50628 | 0 | 0 | 0.00% | 0.00% | 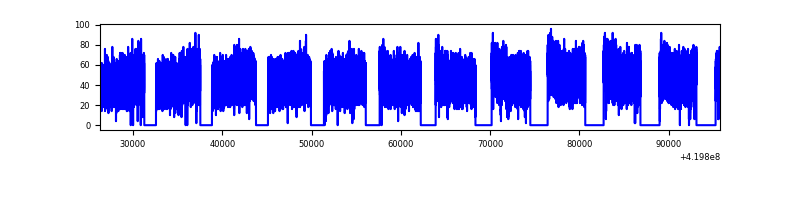 |
Top three noisy pixels from each quadrant. If the there are fewer than three noisy pixels in the level2.evt file, extra rows are filled as -1
| Pixel properties | Quadrant properties | ||||||
|---|---|---|---|---|---|---|---|
| Quadrant | DetID | PixID | Counts | Sigma | Mean | Median | Sigma |
| A | 9 | 19 | 2206 | 8.91 | 698 | 656 | 173.9 |
| A | 7 | 110 | 2189 | 8.82 | 698 | 656 | 173.9 |
| A | 0 | 29 | 2153 | 8.61 | 698 | 656 | 173.9 |
| B | 2 | 9 | 2172 | 11.6 | 674 | 643 | 131.8 |
| B | 3 | 80 | 1809 | 8.85 | 674 | 643 | 131.8 |
| B | 2 | 8 | 1738 | 8.31 | 674 | 643 | 131.8 |
| C | 1 | 81 | 2212 | 8.65 | 701 | 657 | 179.9 |
| C | 3 | 202 | 2119 | 8.13 | 701 | 657 | 179.9 |
| C | 1 | 80 | 2100 | 8.02 | 701 | 657 | 179.9 |
| D | 4 | 160 | 1717 | 6.51 | 648 | 592 | 172.7 |
| D | 10 | 189 | 1684 | 6.32 | 648 | 592 | 172.7 |
| D | 15 | 46 | 1623 | 5.97 | 648 | 592 | 172.7 |
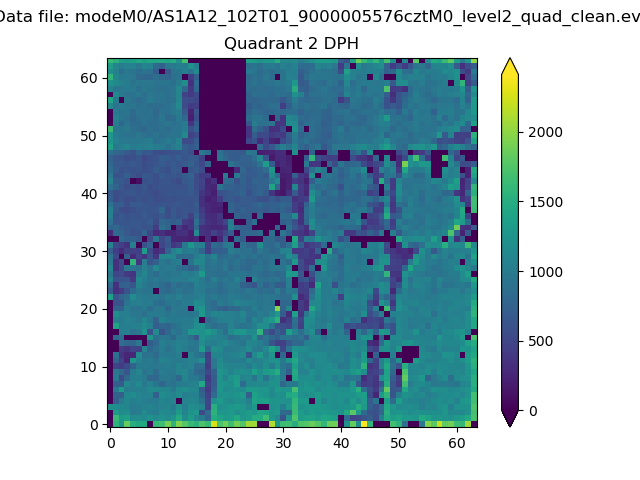
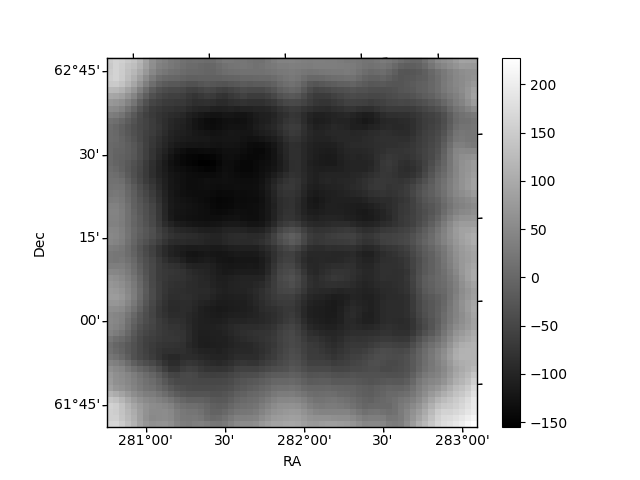
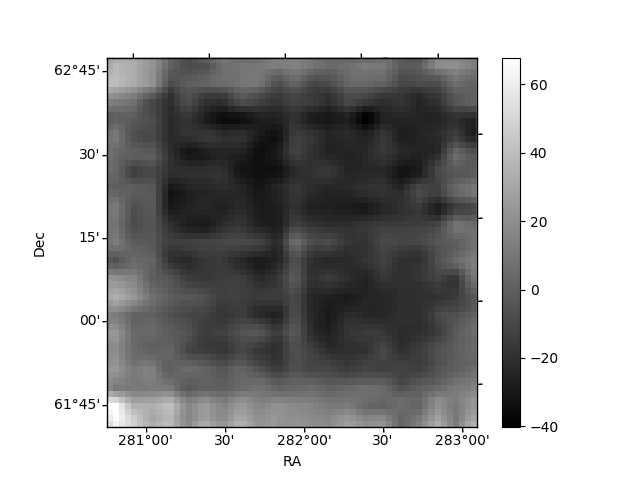
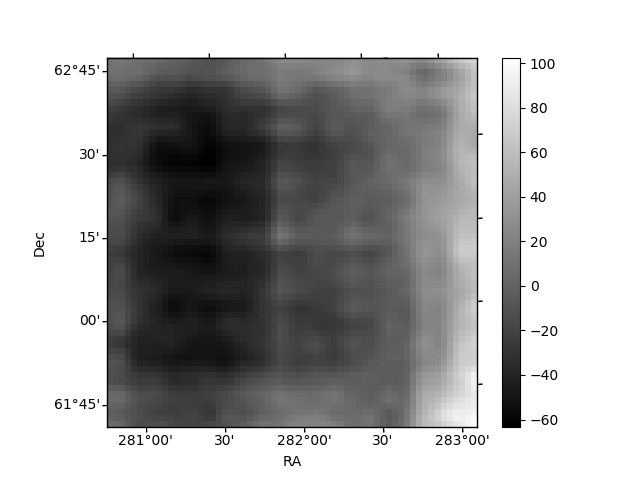
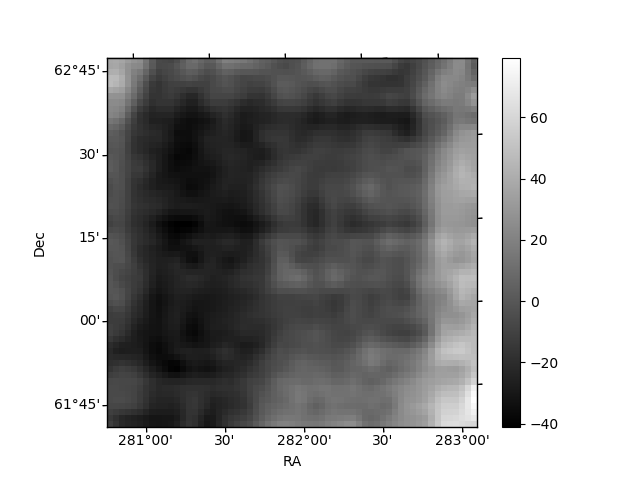
Histogram calculated using DETX and DETY for each event in the final _common_clean file
| Quadrant A | 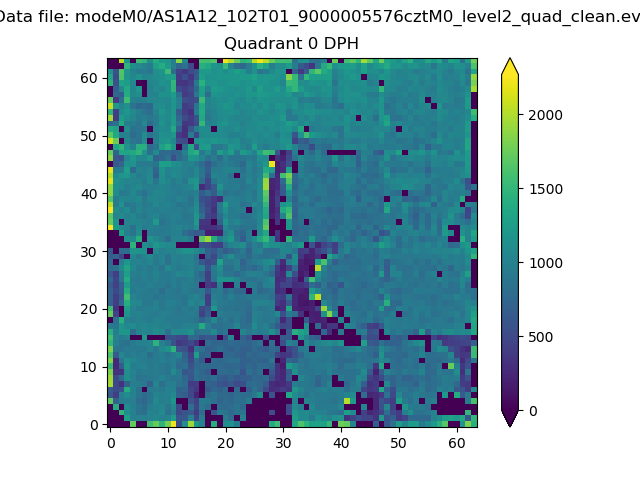 |
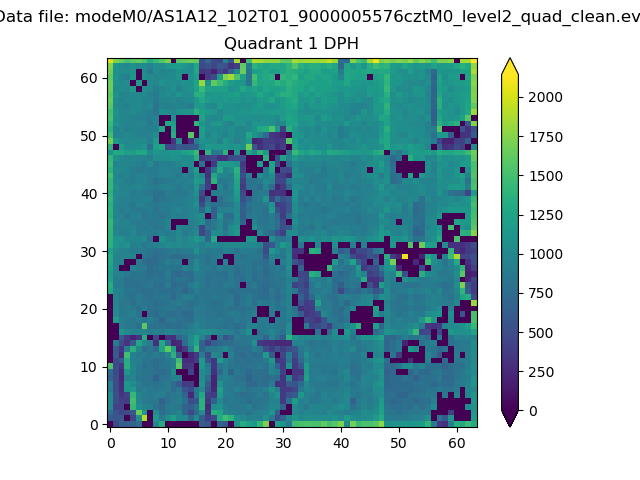 |
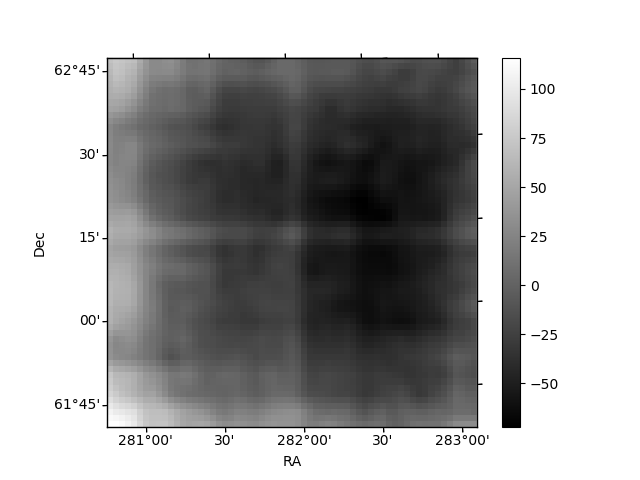
Quadrant B |
|---|---|---|---|
| Quadrant D | 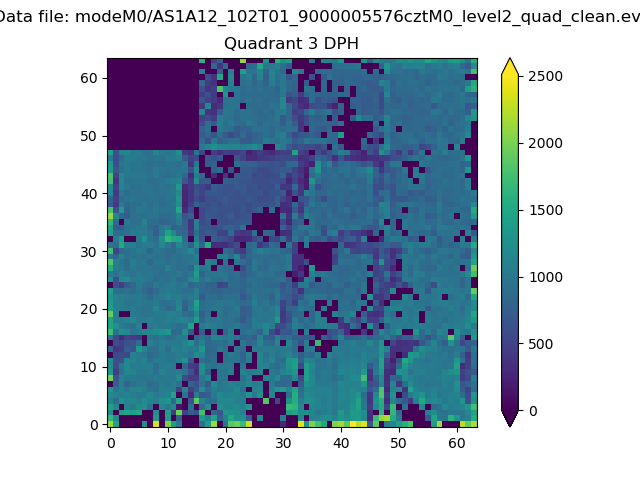 |
 |
Quadrant C |
| Plot type | Count rate plots | Images |
|---|---|---|
| Comparison with Poisson distribution Blue bars denote a histogram of data divided into 1 sec bins. Red curve is a Poisson curve with rate = median count rate of data. |
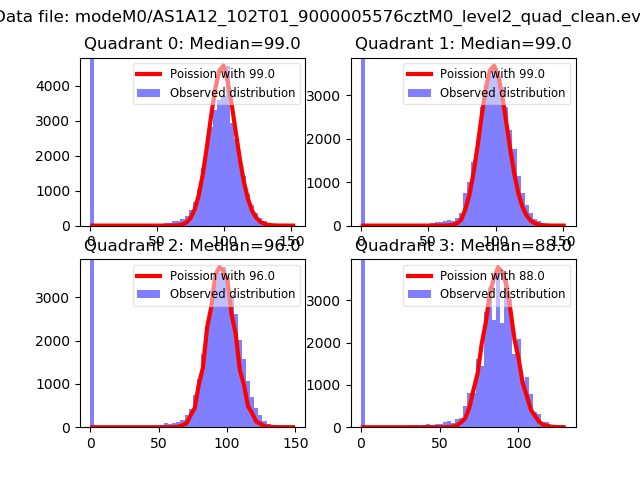 |
 |
| Quadrant-wise count rates Data is divided into 100 sec bins |
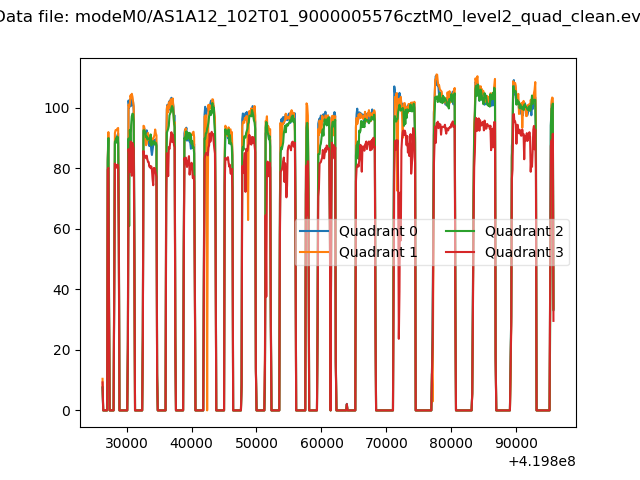 |
|
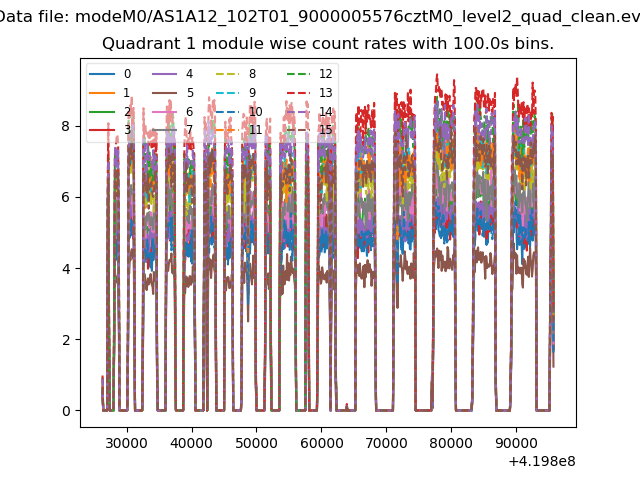
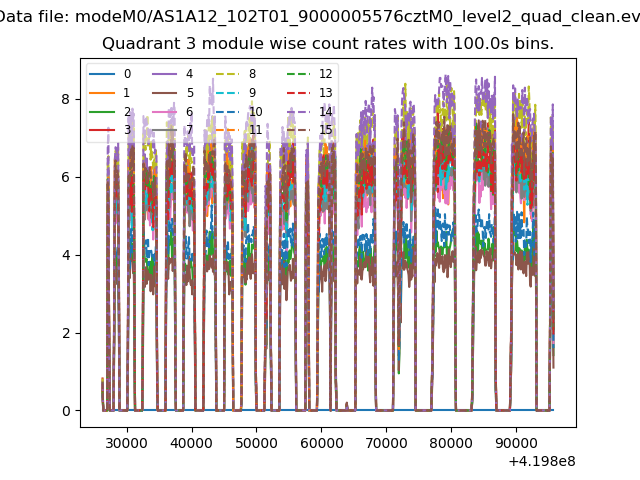
| Module-wise count rates for Quadrant A Data is divided into 100 sec bins |
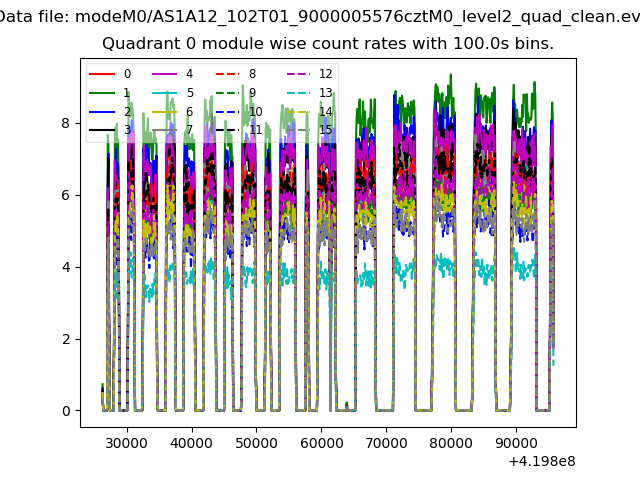 |
 |
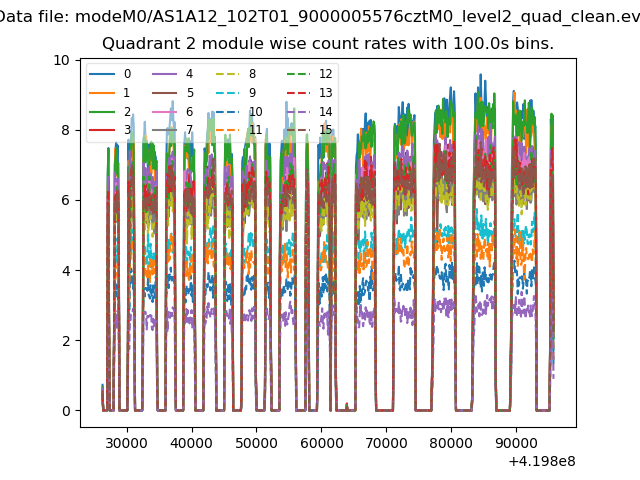
| Module-wise count rates for Quadrant B Data is divided into 100 sec bins |
 |
 |
| Module-wise count rates for Quadrant C Data is divided into 100 sec bins |
 |
 |
| Module-wise count rates for Quadrant D Data is divided into 100 sec bins |
 |
 |
| Parameter | Plot |
|---|---|
| CZT HV Monitor | 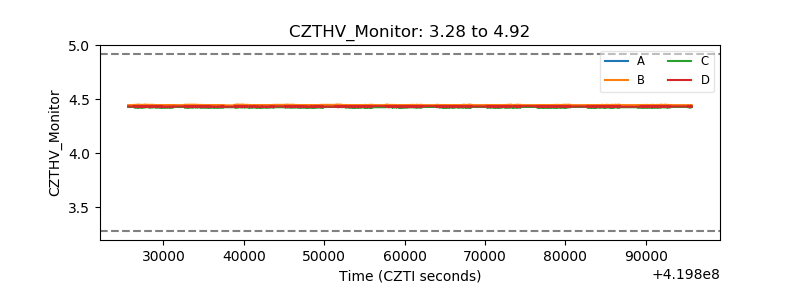 |
| D_VDD | 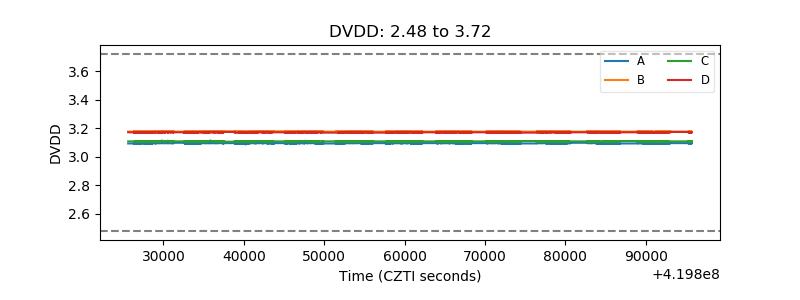 |
| Temperature 1 | 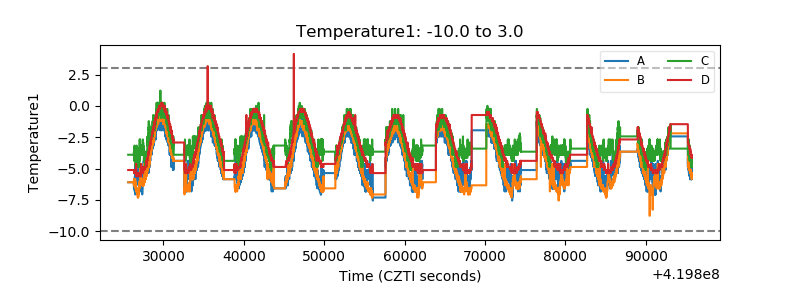 |
| Veto HV Monitor | 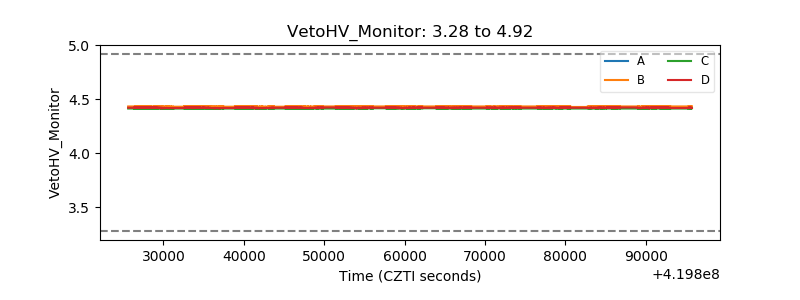 |
| Veto LLD | 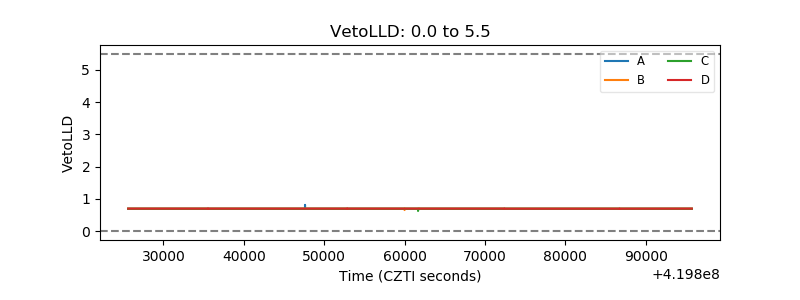 |
| Alpha Counter | 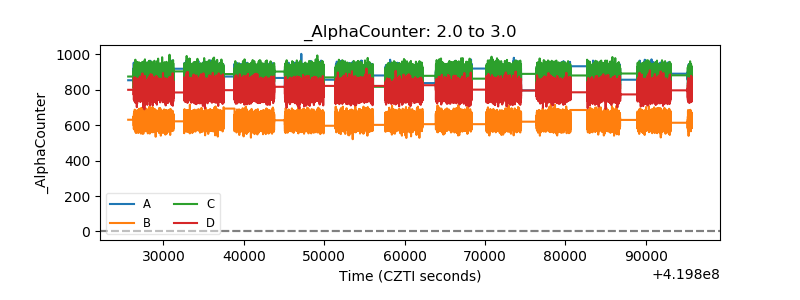 |
| _CPM_Rate | 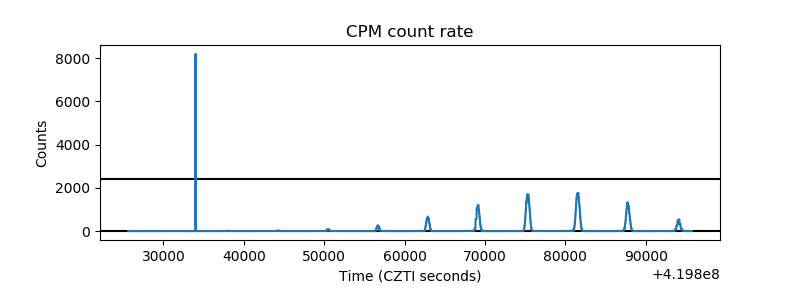 |
| CZT Counter | 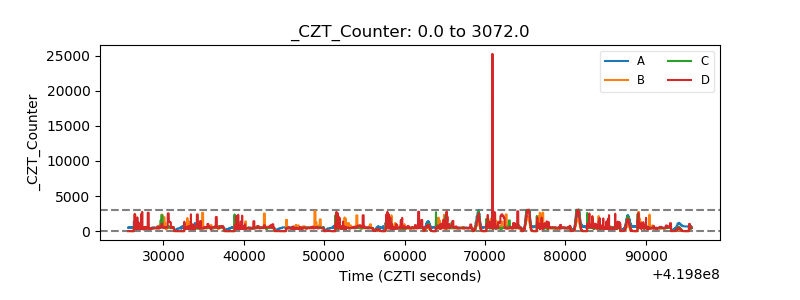 |
| +2.5 Volts monitor | 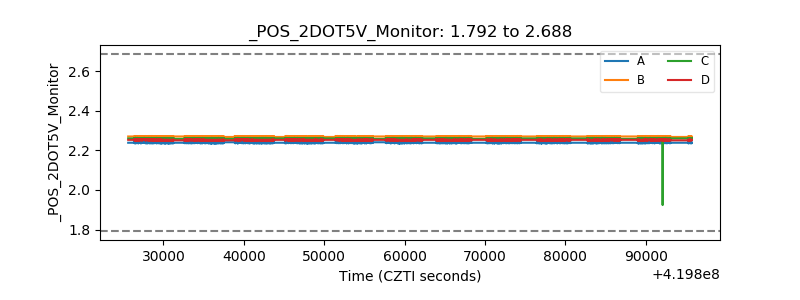 |
| +5 Volts monitor | 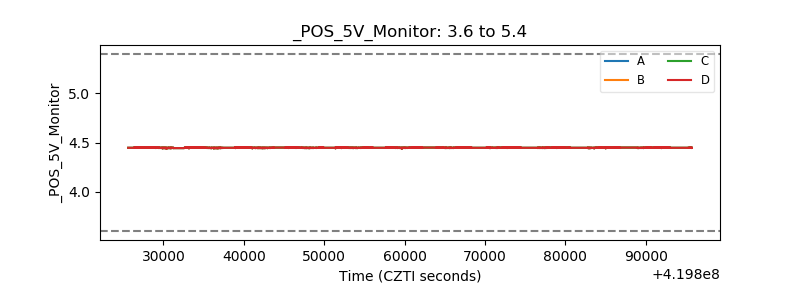 |
| _ROLL_ROT | 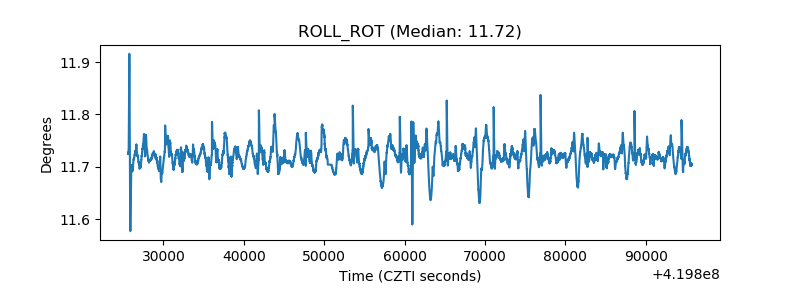 |
| _Roll_DEC | 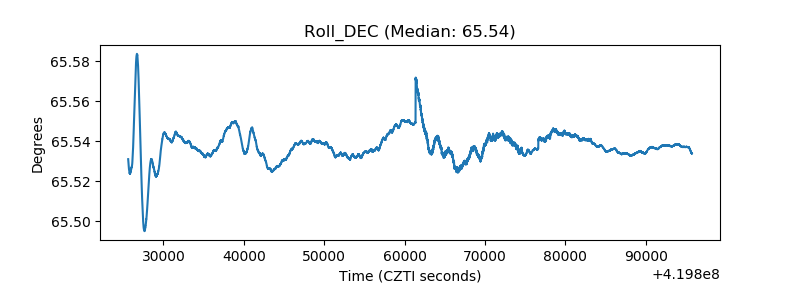 |
| _Roll_RA | 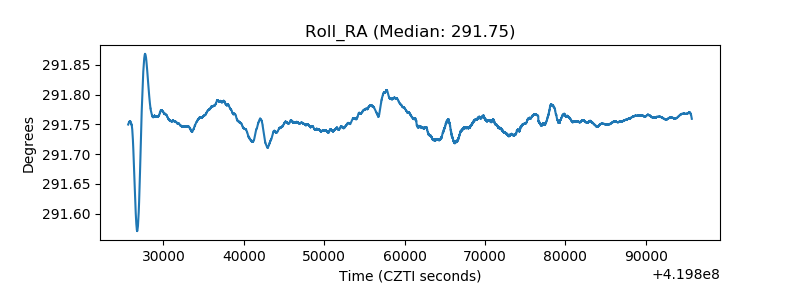 |
| Veto Counter | 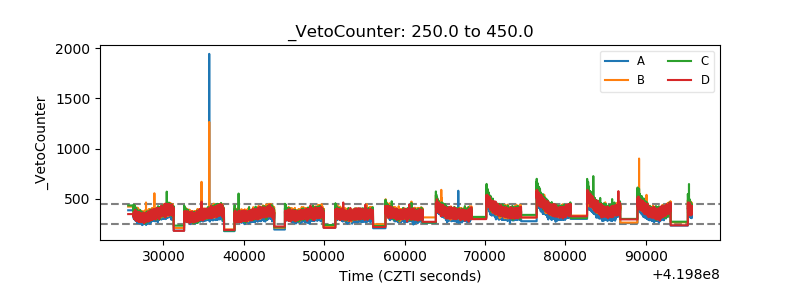 |