| Param | Original file | Final file |
|---|---|---|
| Filename | modeM0/AS1A12_044T19_9000005580cztM0_level2.fits | modeM0/AS1A12_044T19_9000005580cztM0_level2_quad_clean.evt |
| Size (bytes) | 267,356,160 | 323,864,640 |
| Size | 255.0 MB | 308.9 MB |
| Events in quadrant A | 1,596,786 | 2,027,626 |
| Events in quadrant B | 1,533,248 | 2,037,275 |
| Events in quadrant C | 1,556,896 | 1,926,267 |
| Events in quadrant D | 1,345,746 | 1,753,471 |
| Mode M9 | |||
|---|---|---|---|
| Quadrant | BADHDUFLAG | Total packets | Discarded packets |
| A | 0 | 103 | 0 |
| B | 0 | 103 | 0 |
| C | 0 | 103 | 0 |
| D | 0 | 103 | 0 |
| Mode SS | |||
|---|---|---|---|
| Quadrant | BADHDUFLAG | Total packets | Discarded packets |
| A | 0 | 614 | 0 |
| B | 0 | 614 | 0 |
| C | 0 | 614 | 0 |
| D | 0 | 614 | 0 |
| Mode M0 | |||
|---|---|---|---|
| Quadrant | BADHDUFLAG | Total packets | Discarded packets |
| A | 0 | 63958 | 0 |
| B | 0 | 60939 | 0 |
| C | 0 | 61545 | 0 |
| D | 0 | 74855 | 0 |
| Quadrant | Total seconds | Saturated seconds | Saturation percentage |
|---|---|---|---|
| A | 30025 | 62 | 0.206495% |
| B | 30025 | 59 | 0.196503% |
| C | 30025 | 134 | 0.446295% |
| D | 30025 | 783 | 2.607827% |
Noise dominated data is calculated using 1-second bins in cleaned event files. If a bin has >2000 counts, and if more than 50% of those come from <1% of pixels, then it is considered to be noise-dominated and hence unusable.
| Quadrant | # 1 sec bins | Bins with >0 counts | Bins with >2000 counts | High rate bins dominated by noise | Noise dominated (total time) | Noise dominated (detector-on time) | Marked lightcurve |
|---|---|---|---|---|---|---|---|
| A | 39552 | 30024 | 0 | 0 | 0.00% | 0.00% | 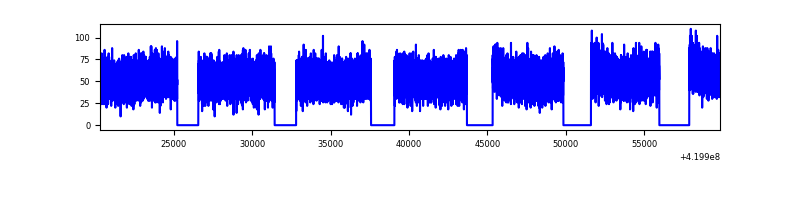 |
| B | 39552 | 30024 | 0 | 0 | 0.00% | 0.00% | 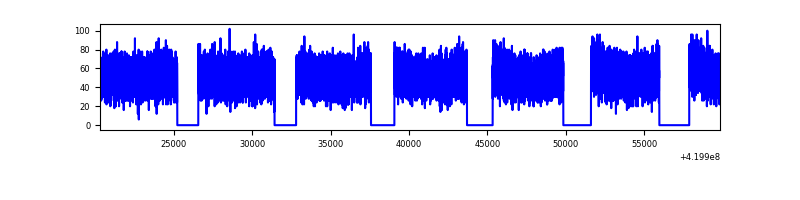 |
| C | 39552 | 30024 | 0 | 0 | 0.00% | 0.00% | 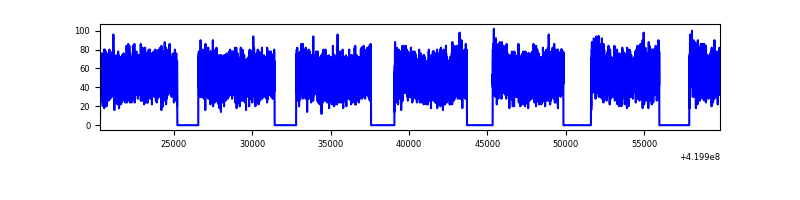 |
| D | 39552 | 30009 | 0 | 0 | 0.00% | 0.00% | 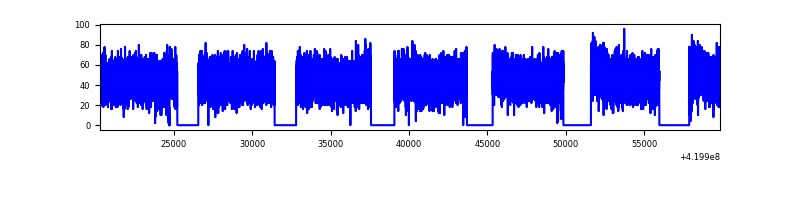 |
Top three noisy pixels from each quadrant. If the there are fewer than three noisy pixels in the level2.evt file, extra rows are filled as -1
| Pixel properties | Quadrant properties | ||||||
|---|---|---|---|---|---|---|---|
| Quadrant | DetID | PixID | Counts | Sigma | Mean | Median | Sigma |
| A | 7 | 110 | 1330 | 8.76 | 416 | 389 | 107.4 |
| A | 9 | 19 | 1311 | 8.58 | 416 | 389 | 107.4 |
| A | 0 | 29 | 1262 | 8.13 | 416 | 389 | 107.4 |
| B | 2 | 9 | 1331 | 11.62 | 405 | 384 | 81.5 |
| B | 5 | 128 | 1139 | 9.26 | 405 | 384 | 81.5 |
| B | 3 | 80 | 1086 | 8.61 | 405 | 384 | 81.5 |
| C | 1 | 81 | 1254 | 8.18 | 411 | 384 | 106.4 |
| C | 1 | 80 | 1161 | 7.31 | 411 | 384 | 106.4 |
| C | 1 | 65 | 1109 | 6.82 | 411 | 384 | 106.4 |
| D | 4 | 160 | 965 | 5.89 | 384 | 349 | 104.5 |
| D | 6 | 231 | 955 | 5.8 | 384 | 349 | 104.5 |
| D | 7 | 3 | 946 | 5.71 | 384 | 349 | 104.5 |
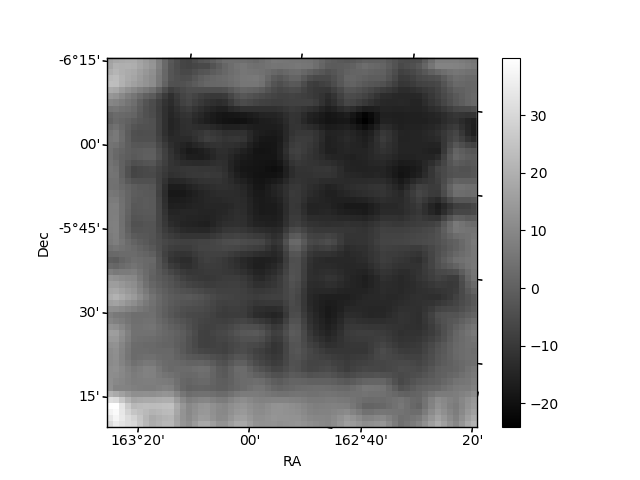
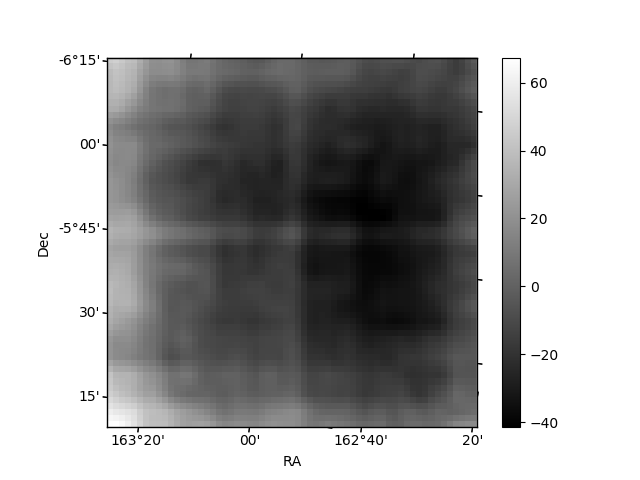
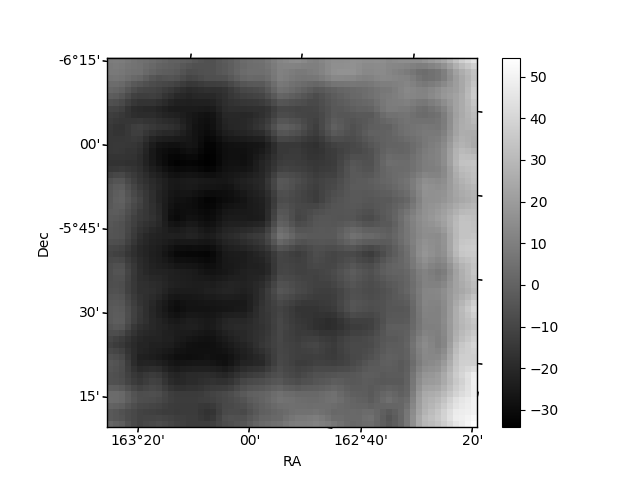
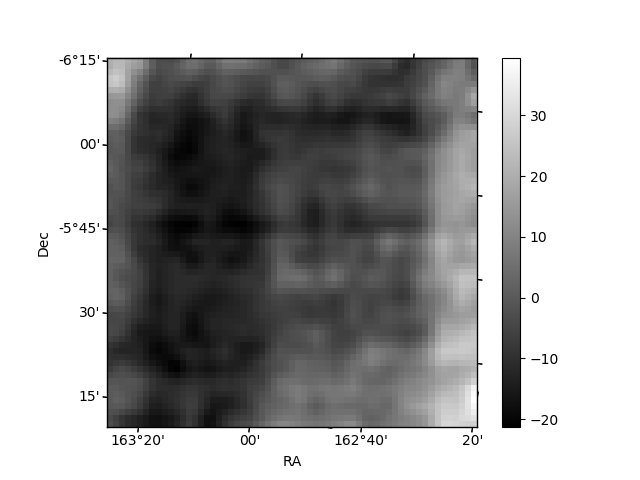
Histogram calculated using DETX and DETY for each event in the final _common_clean file
| Quadrant A | 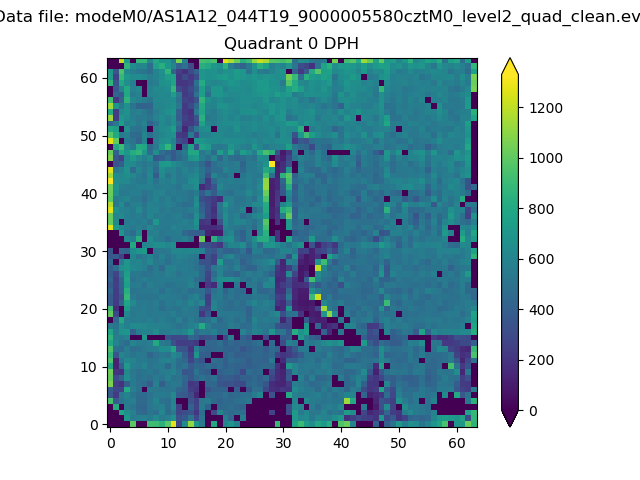 |
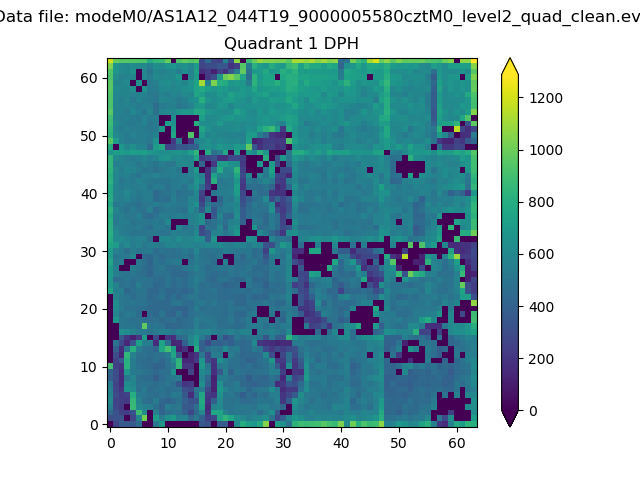 |
Quadrant B |
|---|---|---|---|
| Quadrant D | 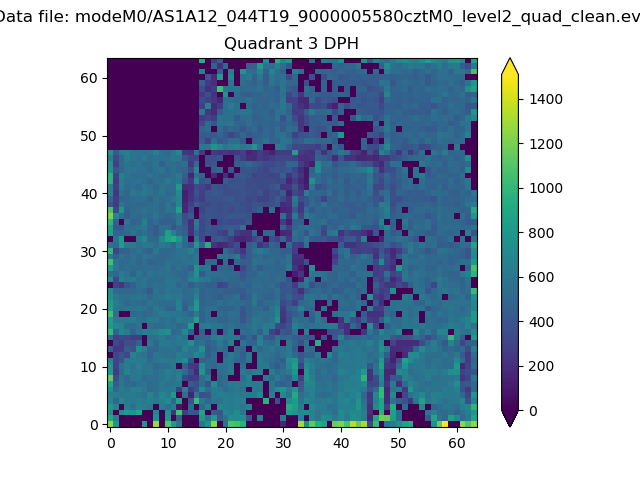 |
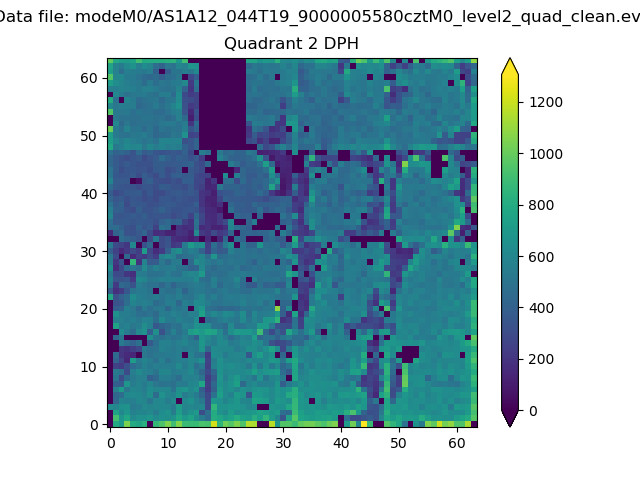 |
Quadrant C |
| Plot type | Count rate plots | Images |
|---|---|---|
| Comparison with Poisson distribution Blue bars denote a histogram of data divided into 1 sec bins. Red curve is a Poisson curve with rate = median count rate of data. |
 |
 |
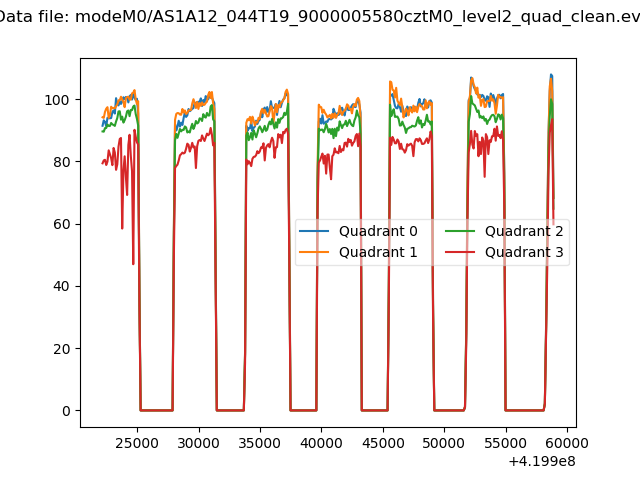
| Quadrant-wise count rates Data is divided into 100 sec bins |
 |
|
| Module-wise count rates for Quadrant A Data is divided into 100 sec bins |
 |
 |
| Module-wise count rates for Quadrant B Data is divided into 100 sec bins |
 |
 |
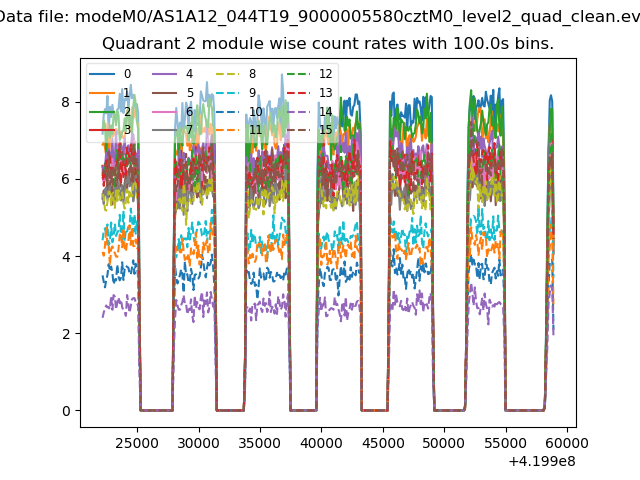
| Module-wise count rates for Quadrant C Data is divided into 100 sec bins |
 |
 |
| Module-wise count rates for Quadrant D Data is divided into 100 sec bins |
 |
 |
| Parameter | Plot |
|---|---|
| CZT HV Monitor | 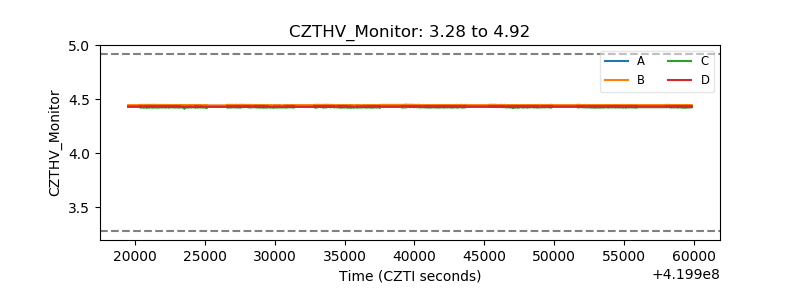 |
| D_VDD | 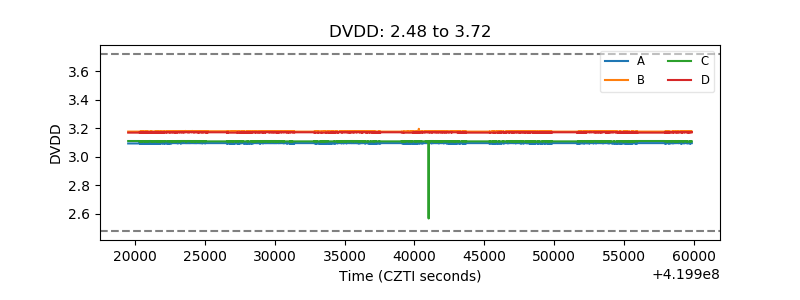 |
| Temperature 1 |  |
| Veto HV Monitor | 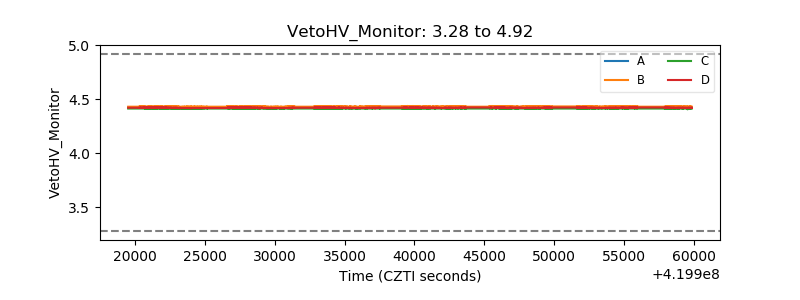 |
| Veto LLD | 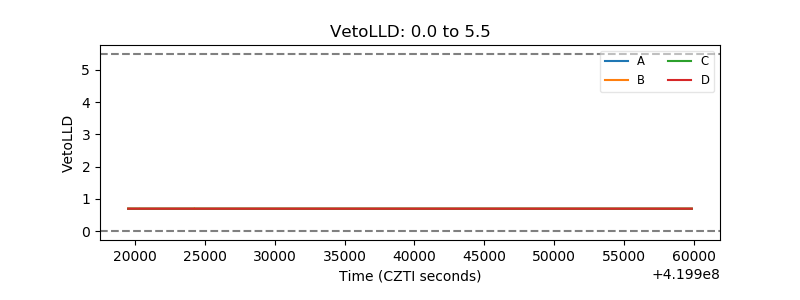 |
| Alpha Counter | 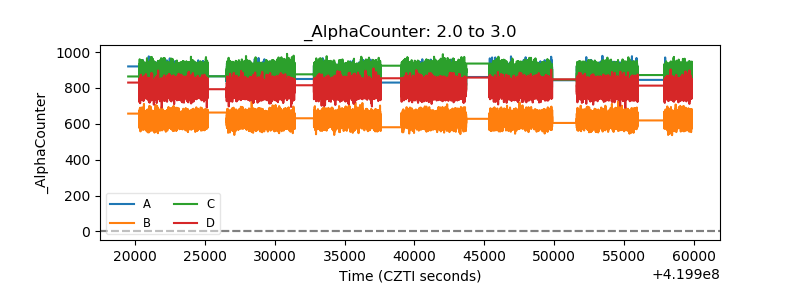 |
| _CPM_Rate | 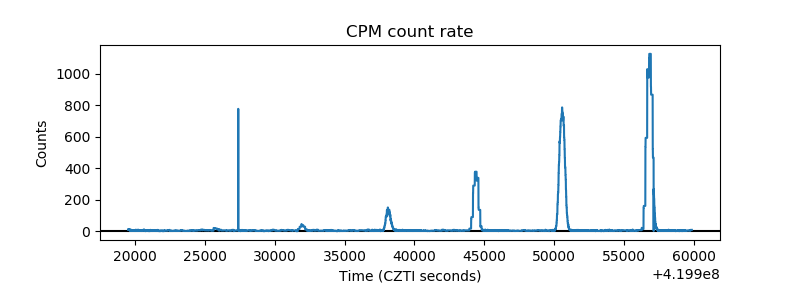 |
| CZT Counter |  |
| +2.5 Volts monitor | 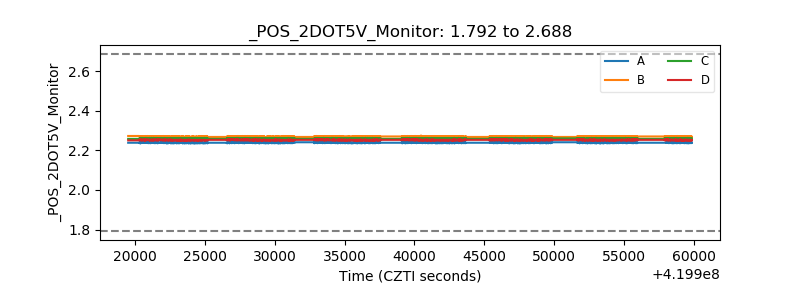 |
| +5 Volts monitor | 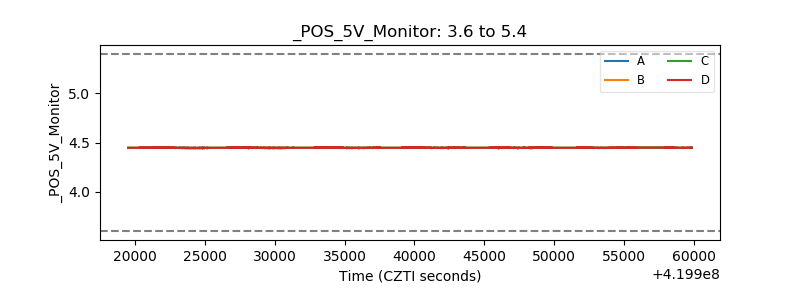 |
| _ROLL_ROT | 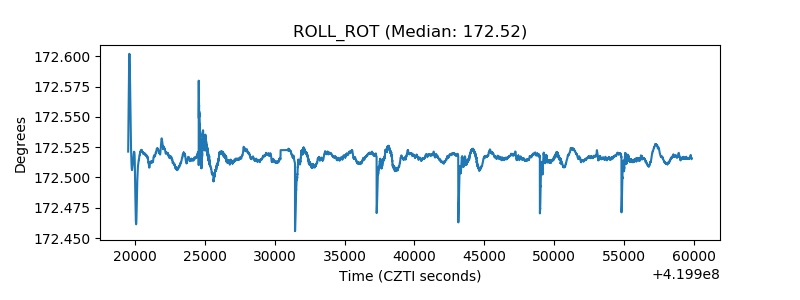 |
| _Roll_DEC | 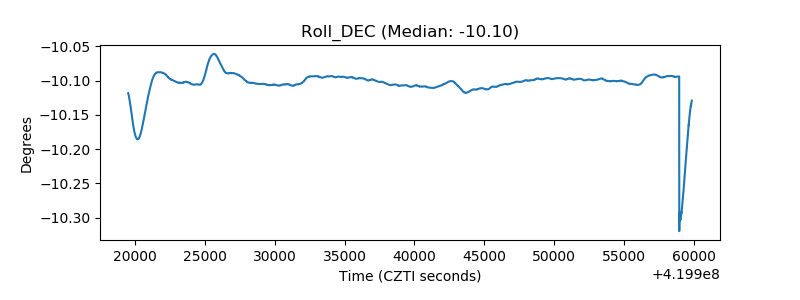 |
| _Roll_RA | 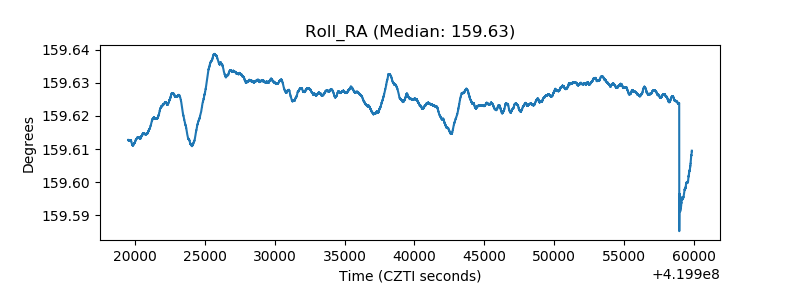 |
| Veto Counter | 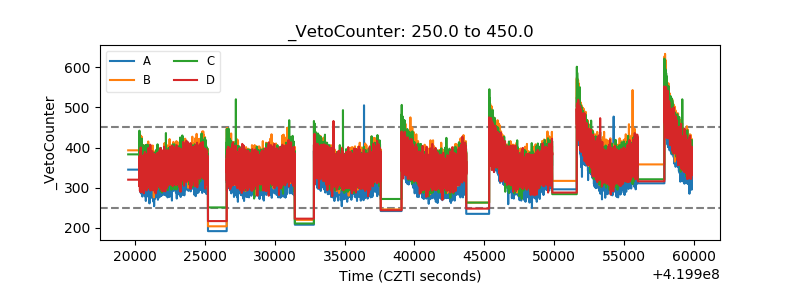 |