| Param | Original file | Final file |
|---|---|---|
| Filename | modeM0/AS1A12_052T04_9000005582cztM0_level2.fits | modeM0/AS1A12_052T04_9000005582cztM0_level2_quad_clean.evt |
| Size (bytes) | 2,038,723,200 | 2,298,856,320 |
| Size | 1.9 GB | 2.1 GB |
| Events in quadrant A | 12,458,748 | 14,652,484 |
| Events in quadrant B | 11,966,240 | 14,612,448 |
| Events in quadrant C | 10,944,072 | 12,088,919 |
| Events in quadrant D | 10,392,392 | 12,308,541 |
| Mode M9 | |||
|---|---|---|---|
| Quadrant | BADHDUFLAG | Total packets | Discarded packets |
| A | 0 | 873 | 0 |
| B | 0 | 873 | 0 |
| C | 0 | 873 | 0 |
| D | 0 | 873 | 0 |
| Mode SS | |||
|---|---|---|---|
| Quadrant | BADHDUFLAG | Total packets | Discarded packets |
| A | 0 | 4760 | 0 |
| B | 0 | 4760 | 0 |
| C | 0 | 4760 | 0 |
| D | 0 | 4760 | 0 |
| Mode M0 | |||
|---|---|---|---|
| Quadrant | BADHDUFLAG | Total packets | Discarded packets |
| A | 0 | 504091 | 0 |
| B | 0 | 481342 | 0 |
| C | 0 | 691875 | 0 |
| D | 0 | 598083 | 0 |
| Quadrant | Total seconds | Saturated seconds | Saturation percentage |
|---|---|---|---|
| A | 233073 | 503 | 0.215812% |
| B | 233073 | 872 | 0.374132% |
| C | 233073 | 30071 | 12.901966% |
| D | 233073 | 9300 | 3.990166% |
Noise dominated data is calculated using 1-second bins in cleaned event files. If a bin has >2000 counts, and if more than 50% of those come from <1% of pixels, then it is considered to be noise-dominated and hence unusable.
| Quadrant | # 1 sec bins | Bins with >0 counts | Bins with >2000 counts | High rate bins dominated by noise | Noise dominated (total time) | Noise dominated (detector-on time) | Marked lightcurve |
|---|---|---|---|---|---|---|---|
| A | 320450 | 233073 | 0 | 0 | 0.00% | 0.00% |  |
| B | 320450 | 233067 | 0 | 0 | 0.00% | 0.00% |  |
| C | 320450 | 228881 | 0 | 0 | 0.00% | 0.00% |  |
| D | 320450 | 232753 | 0 | 0 | 0.00% | 0.00% |  |
Top three noisy pixels from each quadrant. If the there are fewer than three noisy pixels in the level2.evt file, extra rows are filled as -1
| Pixel properties | Quadrant properties | ||||||
|---|---|---|---|---|---|---|---|
| Quadrant | DetID | PixID | Counts | Sigma | Mean | Median | Sigma |
| A | 9 | 19 | 10257 | 8.87 | 3248 | 3043 | 813.0 |
| A | 7 | 110 | 10177 | 8.78 | 3248 | 3043 | 813.0 |
| A | 0 | 29 | 10045 | 8.61 | 3248 | 3043 | 813.0 |
| B | 2 | 9 | 10181 | 11.71 | 3162 | 3012 | 612.0 |
| B | 3 | 80 | 8547 | 9.04 | 3162 | 3012 | 612.0 |
| B | 3 | 17 | 8430 | 8.85 | 3162 | 3012 | 612.0 |
| C | 1 | 81 | 8979 | 8.48 | 2892 | 2707 | 739.7 |
| C | 3 | 203 | 8635 | 8.01 | 2892 | 2707 | 739.7 |
| C | 3 | 202 | 8621 | 8.0 | 2892 | 2707 | 739.7 |
| D | 7 | 3 | 7730 | 6.34 | 2972 | 2701 | 792.9 |
| D | 10 | 189 | 7653 | 6.24 | 2972 | 2701 | 792.9 |
| D | 4 | 160 | 7452 | 5.99 | 2972 | 2701 | 792.9 |
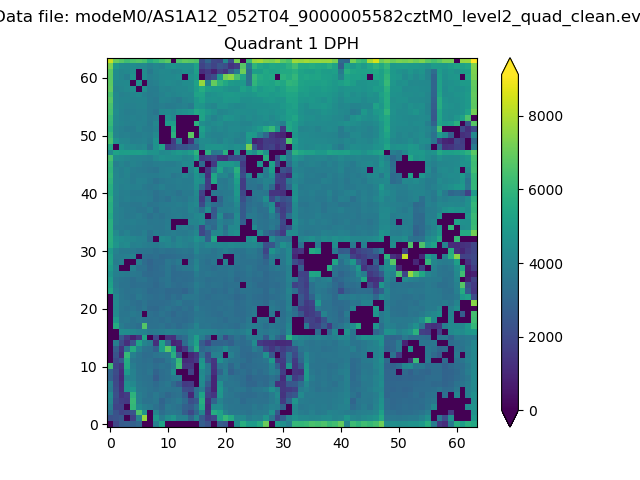
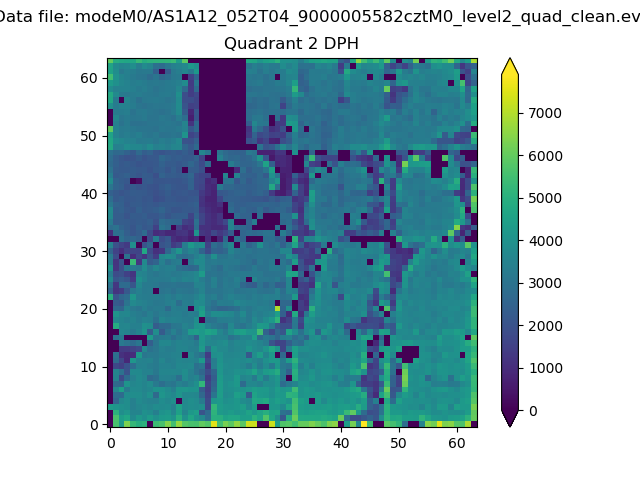
Histogram calculated using DETX and DETY for each event in the final _common_clean file
| Quadrant A |  |
 |
Quadrant B |
|---|---|---|---|
| Quadrant D |  |
 |
Quadrant C |
| Plot type | Count rate plots | Images |
|---|---|---|
| Comparison with Poisson distribution Blue bars denote a histogram of data divided into 1 sec bins. Red curve is a Poisson curve with rate = median count rate of data. |
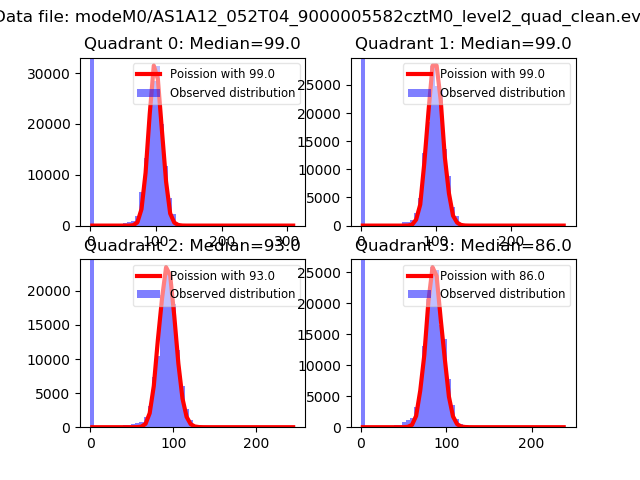 |
 |
| Quadrant-wise count rates Data is divided into 100 sec bins |
 |
|
| Module-wise count rates for Quadrant A Data is divided into 100 sec bins |
 |
 |
| Module-wise count rates for Quadrant B Data is divided into 100 sec bins |
 |
 |
| Module-wise count rates for Quadrant C Data is divided into 100 sec bins |
 |
 |
| Module-wise count rates for Quadrant D Data is divided into 100 sec bins |
 |
 |
| Parameter | Plot |
|---|---|
| CZT HV Monitor | 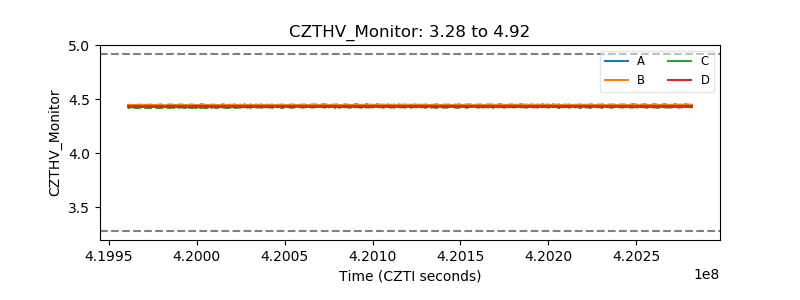 |
| D_VDD | 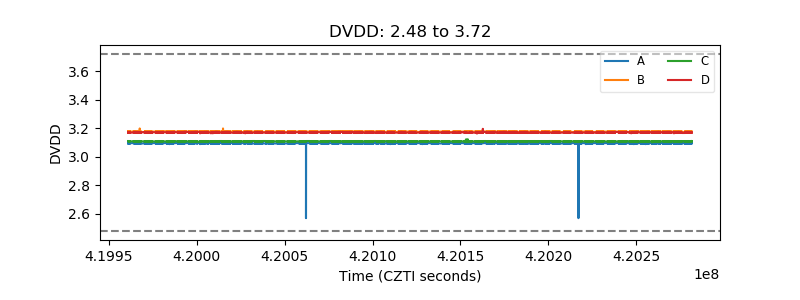 |
| Temperature 1 | 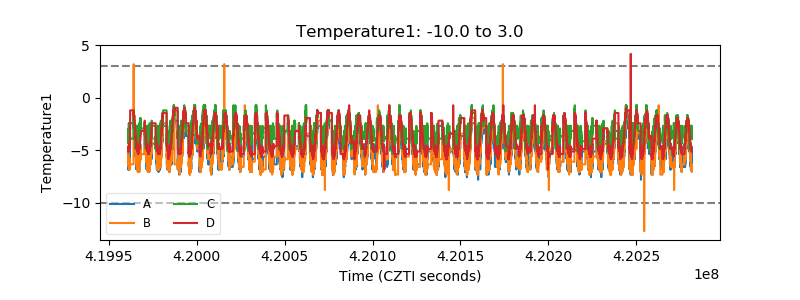 |
| Veto HV Monitor | 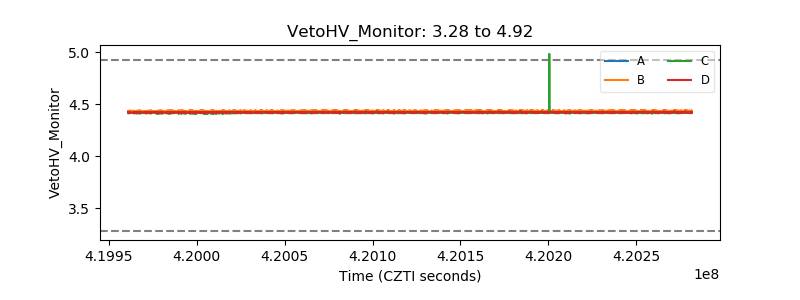 |
| Veto LLD | 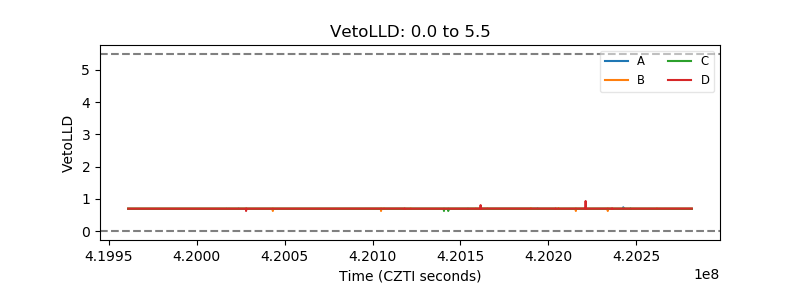 |
| Alpha Counter |  |
| _CPM_Rate |  |
| CZT Counter |  |
| +2.5 Volts monitor |  |
| +5 Volts monitor | 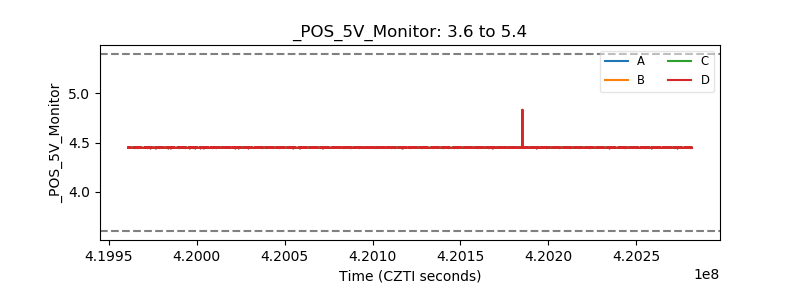 |
| _ROLL_ROT |  |
| _Roll_DEC |  |
| _Roll_RA |  |
| Veto Counter |  |