| Param | Original file | Final file |
|---|---|---|
| Filename | modeM0/AS1A12_066T01_9000005584cztM0_level2.fits | modeM0/AS1A12_066T01_9000005584cztM0_level2_quad_clean.evt |
| Size (bytes) | 868,308,480 | 915,206,400 |
| Size | 828.1 MB | 872.8 MB |
| Events in quadrant A | 5,273,036 | 5,623,770 |
| Events in quadrant B | 5,013,188 | 5,566,349 |
| Events in quadrant C | 5,092,116 | 5,243,071 |
| Events in quadrant D | 4,399,914 | 4,767,890 |
| Mode SS | |||
|---|---|---|---|
| Quadrant | BADHDUFLAG | Total packets | Discarded packets |
| A | 0 | 1946 | 0 |
| B | 0 | 1946 | 0 |
| C | 0 | 1946 | 0 |
| D | 0 | 1946 | 0 |
| Mode M0 | |||
|---|---|---|---|
| Quadrant | BADHDUFLAG | Total packets | Discarded packets |
| A | 0 | 205555 | 0 |
| B | 0 | 202323 | 0 |
| C | 0 | 199647 | 0 |
| D | 0 | 242915 | 0 |
| Mode M9 | |||
|---|---|---|---|
| Quadrant | BADHDUFLAG | Total packets | Discarded packets |
| A | 0 | 393 | 0 |
| B | 0 | 393 | 0 |
| C | 0 | 393 | 0 |
| D | 0 | 393 | 0 |
| Quadrant | Total seconds | Saturated seconds | Saturation percentage |
|---|---|---|---|
| A | 95077 | 170 | 0.178802% |
| B | 95077 | 948 | 0.997087% |
| C | 95077 | 825 | 0.867718% |
| D | 95077 | 3602 | 3.788508% |
Noise dominated data is calculated using 1-second bins in cleaned event files. If a bin has >2000 counts, and if more than 50% of those come from <1% of pixels, then it is considered to be noise-dominated and hence unusable.
| Quadrant | # 1 sec bins | Bins with >0 counts | Bins with >2000 counts | High rate bins dominated by noise | Noise dominated (total time) | Noise dominated (detector-on time) | Marked lightcurve |
|---|---|---|---|---|---|---|---|
| A | 134458 | 95071 | 0 | 0 | 0.00% | 0.00% | 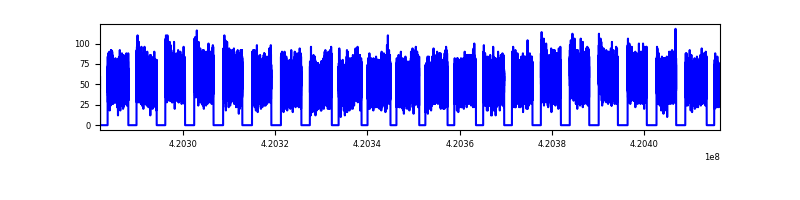 |
| B | 134458 | 95057 | 0 | 0 | 0.00% | 0.00% | 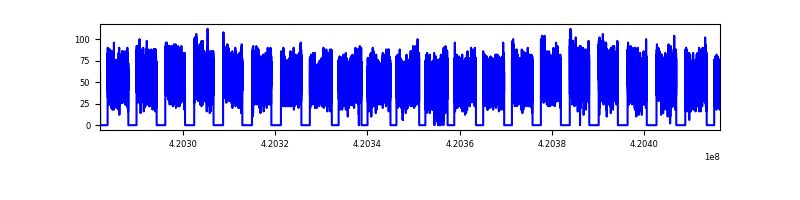 |
| C | 134458 | 95052 | 0 | 0 | 0.00% | 0.00% |  |
| D | 134458 | 94969 | 0 | 0 | 0.00% | 0.00% |  |
Top three noisy pixels from each quadrant. If the there are fewer than three noisy pixels in the level2.evt file, extra rows are filled as -1
| Pixel properties | Quadrant properties | ||||||
|---|---|---|---|---|---|---|---|
| Quadrant | DetID | PixID | Counts | Sigma | Mean | Median | Sigma |
| A | 7 | 110 | 4336 | 8.87 | 1372 | 1283 | 344.2 |
| A | 9 | 19 | 4241 | 8.59 | 1372 | 1283 | 344.2 |
| A | 0 | 29 | 4097 | 8.17 | 1372 | 1283 | 344.2 |
| B | 2 | 9 | 4213 | 11.42 | 1325 | 1261 | 258.5 |
| B | 3 | 80 | 3575 | 8.95 | 1325 | 1261 | 258.5 |
| B | 3 | 17 | 3506 | 8.68 | 1325 | 1261 | 258.5 |
| C | 1 | 81 | 4103 | 8.26 | 1344 | 1255 | 344.9 |
| C | 1 | 80 | 3969 | 7.87 | 1344 | 1255 | 344.9 |
| C | 3 | 202 | 3939 | 7.78 | 1344 | 1255 | 344.9 |
| D | 7 | 3 | 3259 | 6.31 | 1256 | 1143 | 335.6 |
| D | 10 | 189 | 3253 | 6.29 | 1256 | 1143 | 335.6 |
| D | 4 | 160 | 3202 | 6.14 | 1256 | 1143 | 335.6 |
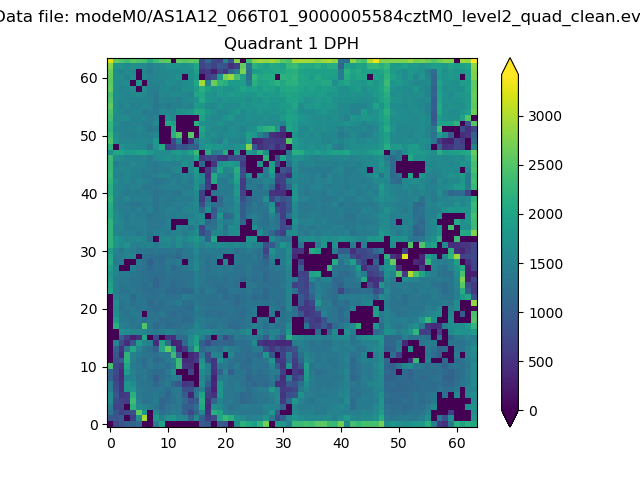
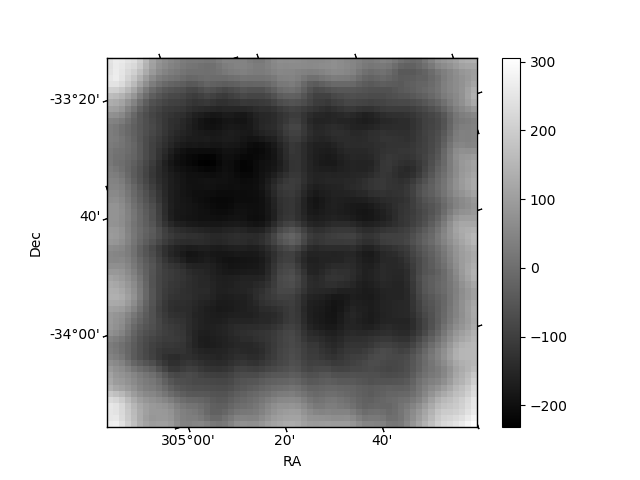
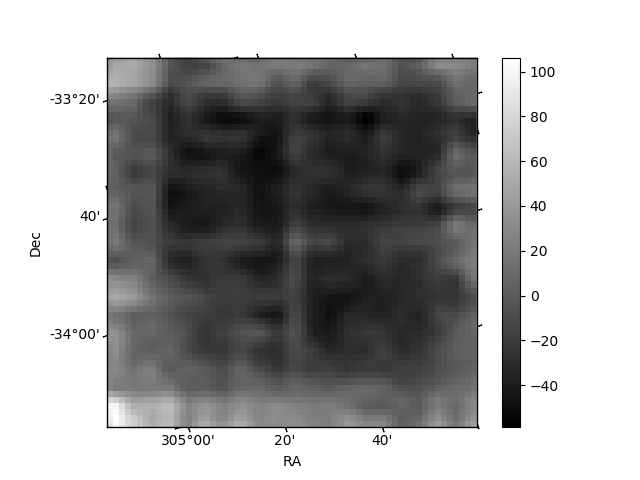
Histogram calculated using DETX and DETY for each event in the final _common_clean file
| Quadrant A |  |
 |
Quadrant B |
|---|---|---|---|
| Quadrant D | 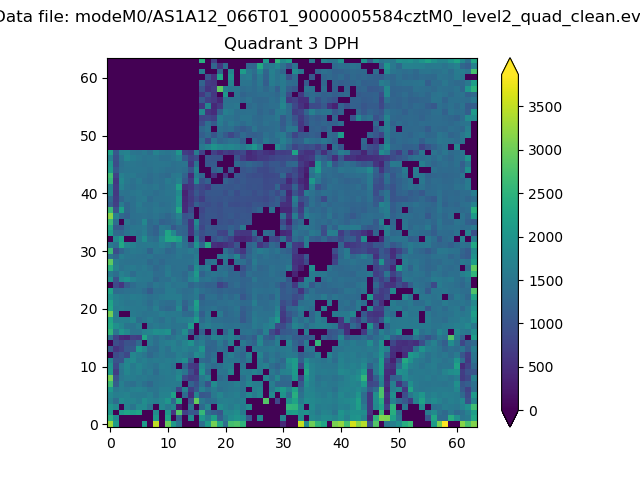 |
 |
Quadrant C |
| Plot type | Count rate plots | Images |
|---|---|---|
| Comparison with Poisson distribution Blue bars denote a histogram of data divided into 1 sec bins. Red curve is a Poisson curve with rate = median count rate of data. |
 |
 |
| Quadrant-wise count rates Data is divided into 100 sec bins |
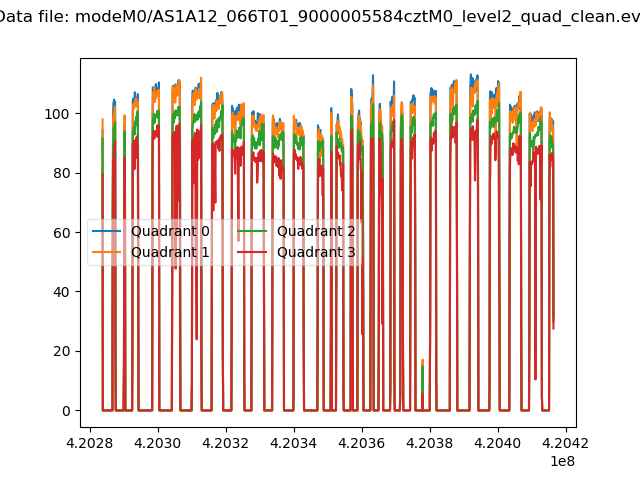 |
|
| Module-wise count rates for Quadrant A Data is divided into 100 sec bins |
 |
 |
| Module-wise count rates for Quadrant B Data is divided into 100 sec bins |
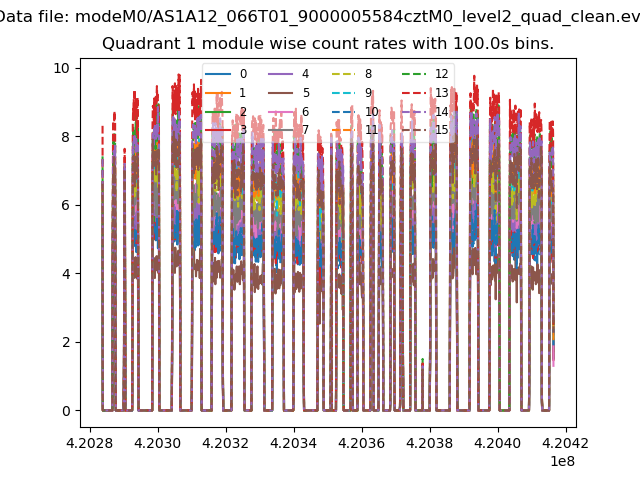 |
 |
| Module-wise count rates for Quadrant C Data is divided into 100 sec bins |
 |
 |
| Module-wise count rates for Quadrant D Data is divided into 100 sec bins |
 |
 |
| Parameter | Plot |
|---|---|
| CZT HV Monitor |  |
| D_VDD | 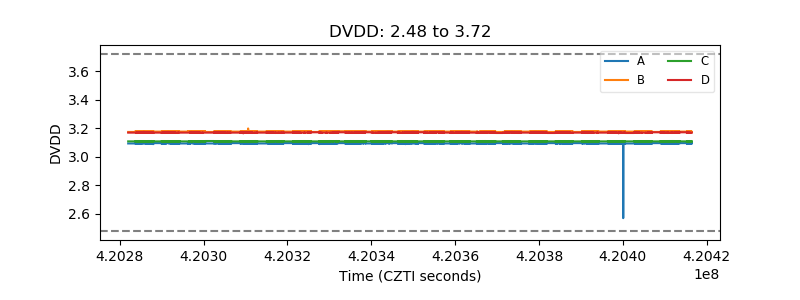 |
| Temperature 1 | 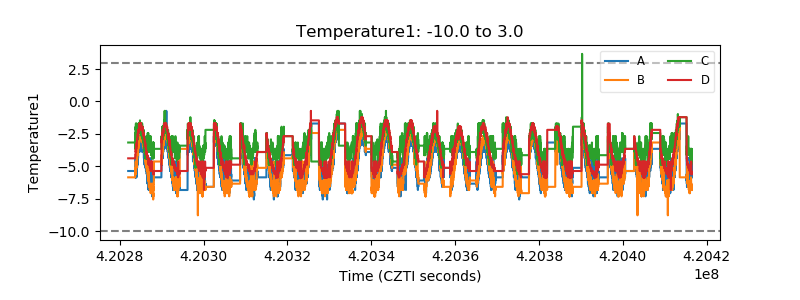 |
| Veto HV Monitor | 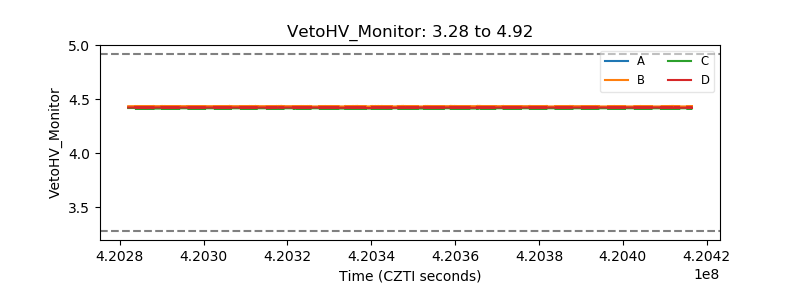 |
| Veto LLD |  |
| Alpha Counter |  |
| _CPM_Rate | 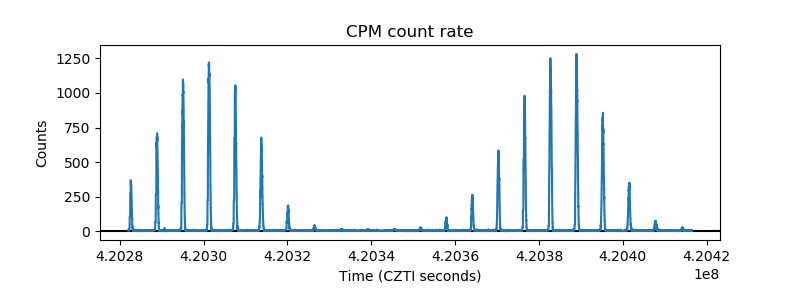 |
| CZT Counter |  |
| +2.5 Volts monitor |  |
| +5 Volts monitor |  |
| _ROLL_ROT | 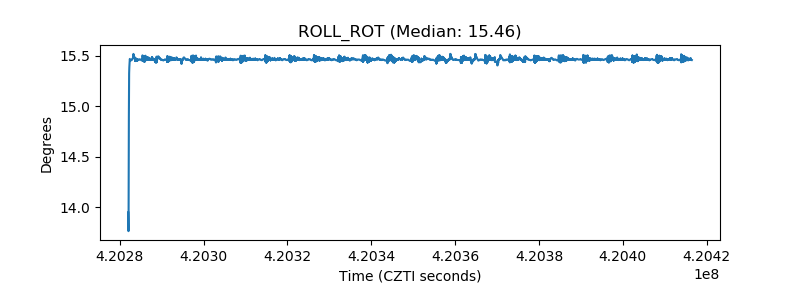 |
| _Roll_DEC | 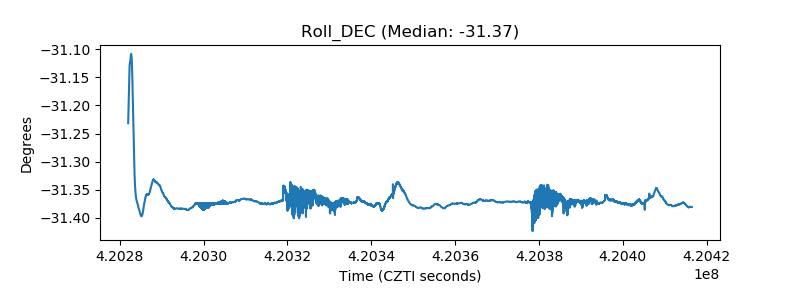 |
| _Roll_RA | 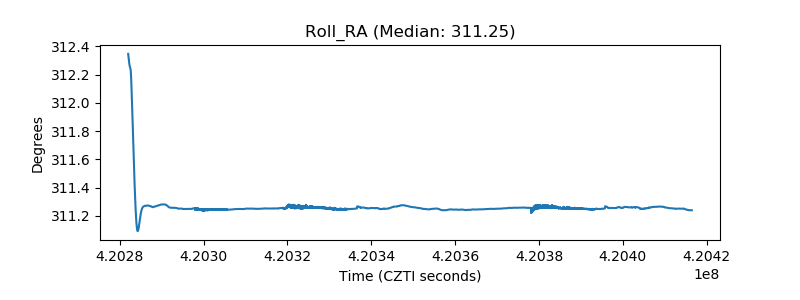 |
| Veto Counter | 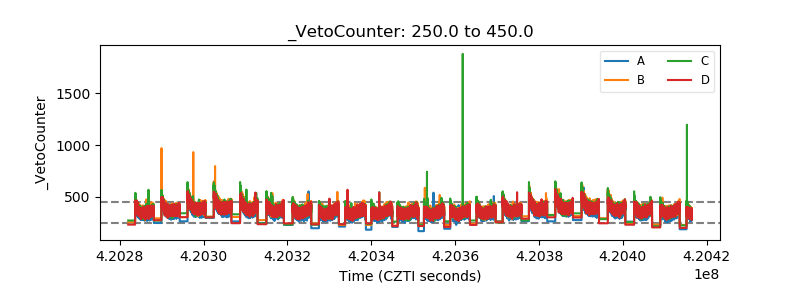 |