| Param | Original file | Final file |
|---|---|---|
| Filename | modeM0/AS1T05_101T01_9000005586cztM0_level2.fits | modeM0/AS1T05_101T01_9000005586cztM0_level2_quad_clean.evt |
| Size (bytes) | 146,424,960 | 192,571,200 |
| Size | 139.6 MB | 183.7 MB |
| Events in quadrant A | 867,122 | 1,213,845 |
| Events in quadrant B | 832,682 | 1,229,978 |
| Events in quadrant C | 844,262 | 1,168,700 |
| Events in quadrant D | 736,488 | 1,065,583 |
| Mode M0 | |||
|---|---|---|---|
| Quadrant | BADHDUFLAG | Total packets | Discarded packets |
| A | 0 | 35568 | 0 |
| B | 0 | 34069 | 0 |
| C | 0 | 35039 | 0 |
| D | 0 | 39217 | 0 |
| Mode SS | |||
|---|---|---|---|
| Quadrant | BADHDUFLAG | Total packets | Discarded packets |
| A | 0 | 340 | 0 |
| B | 0 | 340 | 0 |
| C | 0 | 340 | 0 |
| D | 0 | 340 | 0 |
| Mode M9 | |||
|---|---|---|---|
| Quadrant | BADHDUFLAG | Total packets | Discarded packets |
| A | 0 | 41 | 0 |
| B | 0 | 41 | 0 |
| C | 0 | 41 | 0 |
| D | 0 | 41 | 0 |
| Quadrant | Total seconds | Saturated seconds | Saturation percentage |
|---|---|---|---|
| A | 16738 | 22 | 0.131437% |
| B | 16740 | 31 | 0.185185% |
| C | 16740 | 71 | 0.424134% |
| D | 16740 | 369 | 2.204301% |
Noise dominated data is calculated using 1-second bins in cleaned event files. If a bin has >2000 counts, and if more than 50% of those come from <1% of pixels, then it is considered to be noise-dominated and hence unusable.
| Quadrant | # 1 sec bins | Bins with >0 counts | Bins with >2000 counts | High rate bins dominated by noise | Noise dominated (total time) | Noise dominated (detector-on time) | Marked lightcurve |
|---|---|---|---|---|---|---|---|
| A | 20768 | 16736 | 0 | 0 | 0.00% | 0.00% |  |
| B | 20768 | 16738 | 0 | 0 | 0.00% | 0.00% | 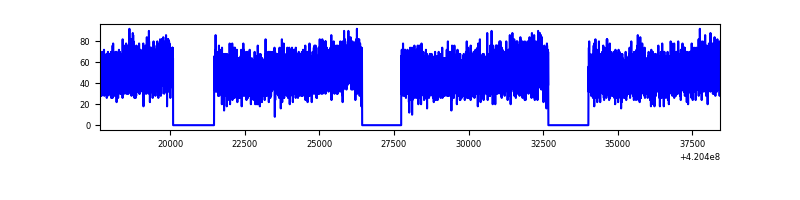 |
| C | 20768 | 16739 | 0 | 0 | 0.00% | 0.00% |  |
| D | 20768 | 16735 | 0 | 0 | 0.00% | 0.00% | 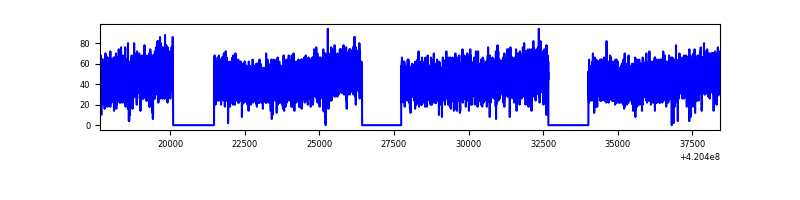 |
Top three noisy pixels from each quadrant. If the there are fewer than three noisy pixels in the level2.evt file, extra rows are filled as -1
| Pixel properties | Quadrant properties | ||||||
|---|---|---|---|---|---|---|---|
| Quadrant | DetID | PixID | Counts | Sigma | Mean | Median | Sigma |
| A | 7 | 110 | 736 | 8.84 | 226 | 212 | 59.3 |
| A | 9 | 19 | 721 | 8.59 | 226 | 212 | 59.3 |
| A | 0 | 29 | 702 | 8.27 | 226 | 212 | 59.3 |
| B | 2 | 9 | 707 | 10.92 | 220 | 210 | 45.5 |
| B | 3 | 80 | 616 | 8.92 | 220 | 210 | 45.5 |
| B | 5 | 128 | 575 | 8.02 | 220 | 210 | 45.5 |
| C | 1 | 81 | 674 | 7.84 | 223 | 208 | 59.4 |
| C | 1 | 80 | 644 | 7.34 | 223 | 208 | 59.4 |
| C | 3 | 158 | 591 | 6.45 | 223 | 208 | 59.4 |
| D | 10 | 189 | 567 | 6.53 | 210 | 192 | 57.4 |
| D | 7 | 3 | 554 | 6.3 | 210 | 192 | 57.4 |
| D | 6 | 38 | 541 | 6.08 | 210 | 192 | 57.4 |
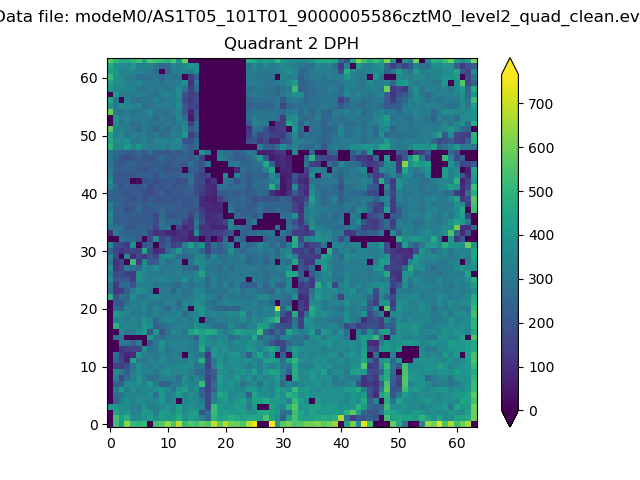
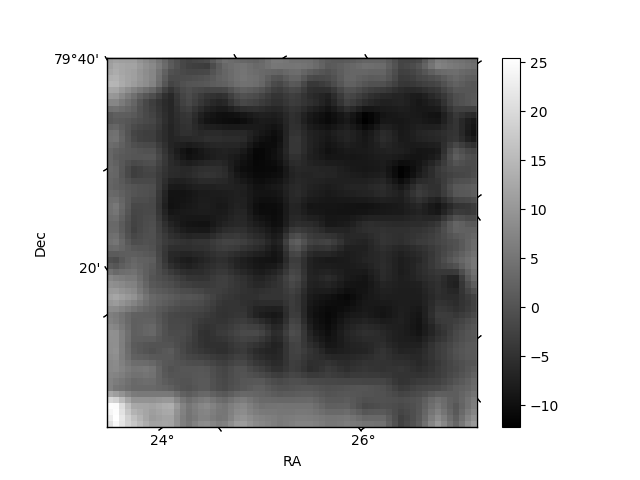
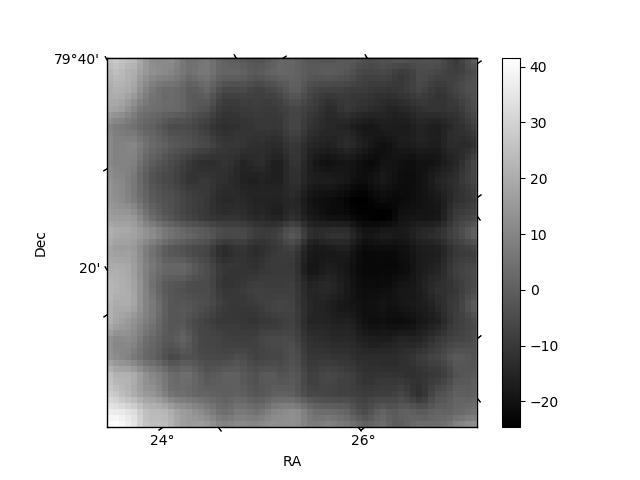
Histogram calculated using DETX and DETY for each event in the final _common_clean file
| Quadrant A | 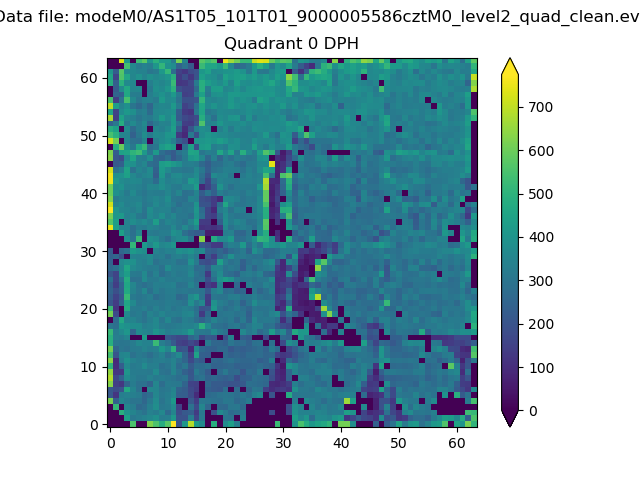 |
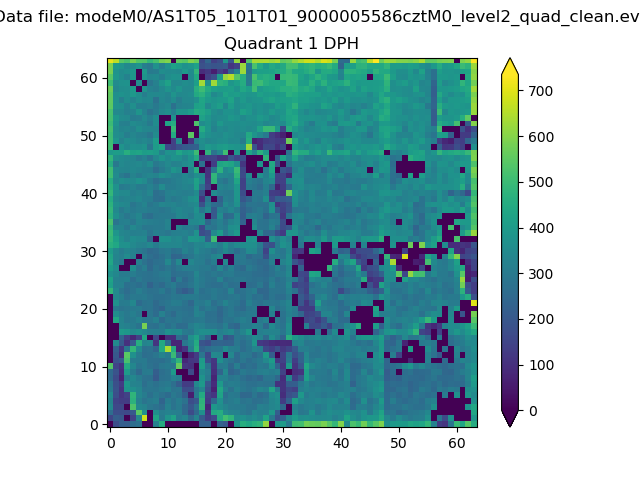 |
Quadrant B |
|---|---|---|---|
| Quadrant D | 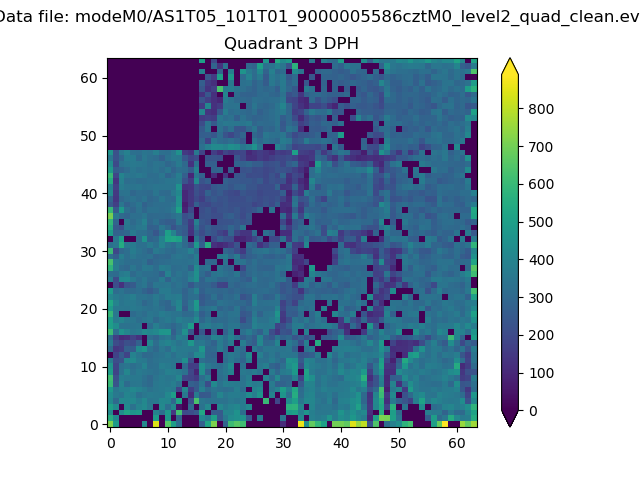 |
 |
Quadrant C |
| Plot type | Count rate plots | Images |
|---|---|---|
| Comparison with Poisson distribution Blue bars denote a histogram of data divided into 1 sec bins. Red curve is a Poisson curve with rate = median count rate of data. |
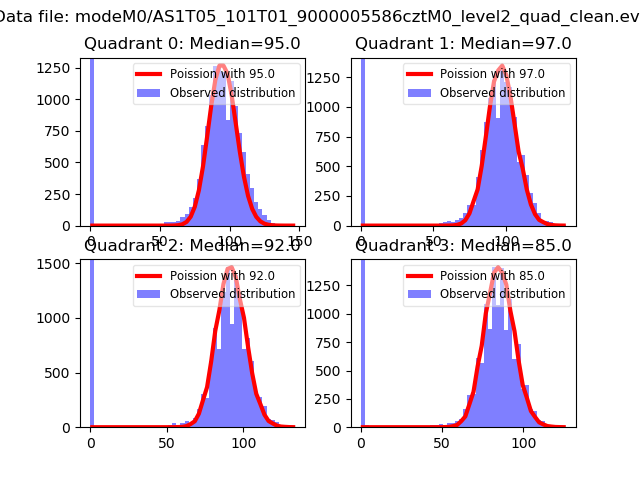 |
 |
| Quadrant-wise count rates Data is divided into 100 sec bins |
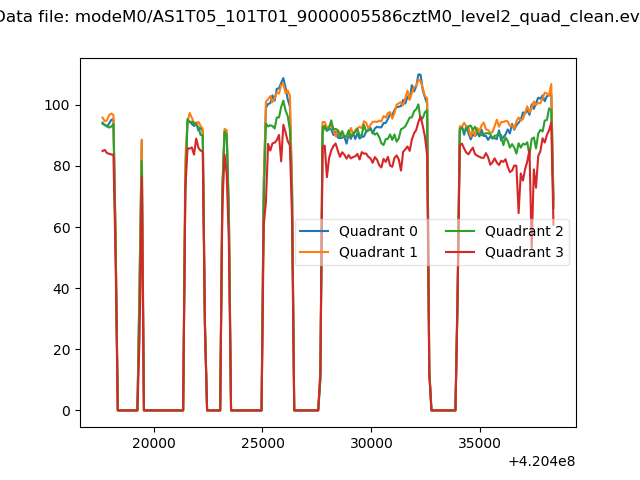 |
|
| Module-wise count rates for Quadrant A Data is divided into 100 sec bins |
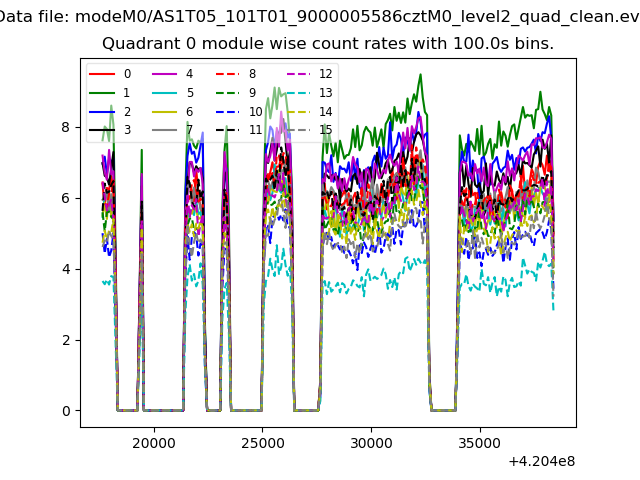 |
 |
| Module-wise count rates for Quadrant B Data is divided into 100 sec bins |
 |
 |
| Module-wise count rates for Quadrant C Data is divided into 100 sec bins |
 |
 |
| Module-wise count rates for Quadrant D Data is divided into 100 sec bins |
 |
 |
| Parameter | Plot |
|---|---|
| CZT HV Monitor |  |
| D_VDD | 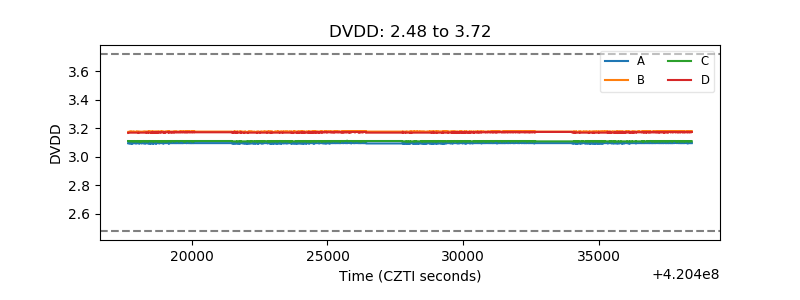 |
| Temperature 1 |  |
| Veto HV Monitor |  |
| Veto LLD |  |
| Alpha Counter |  |
| _CPM_Rate |  |
| CZT Counter | 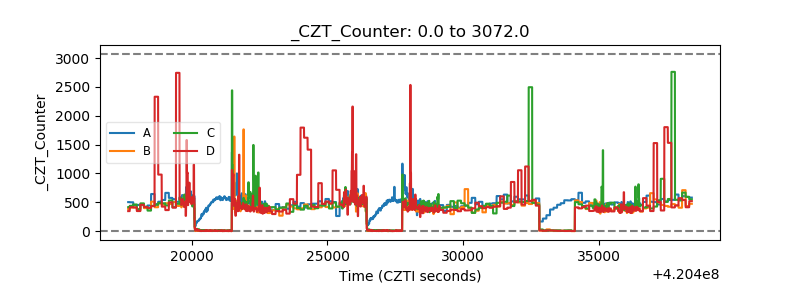 |
| +2.5 Volts monitor |  |
| +5 Volts monitor |  |
| _ROLL_ROT |  |
| _Roll_DEC |  |
| _Roll_RA |  |
| Veto Counter |  |