| Param | Original file | Final file |
|---|---|---|
| Filename | modeM0/AS1A12_029T02_9000005590cztM0_level2.fits | modeM0/AS1A12_029T02_9000005590cztM0_level2_quad_clean.evt |
| Size (bytes) | 1,683,374,400 | 1,921,409,280 |
| Size | 1.6 GB | 1.8 GB |
| Events in quadrant A | 10,087,998 | 11,781,331 |
| Events in quadrant B | 9,724,849 | 11,866,853 |
| Events in quadrant C | 9,903,248 | 11,443,097 |
| Events in quadrant D | 8,542,280 | 10,383,647 |
| Mode SS | |||
|---|---|---|---|
| Quadrant | BADHDUFLAG | Total packets | Discarded packets |
| A | 0 | 3802 | 0 |
| B | 0 | 3803 | 0 |
| C | 0 | 3804 | 0 |
| D | 0 | 3802 | 0 |
| Mode M0 | |||
|---|---|---|---|
| Quadrant | BADHDUFLAG | Total packets | Discarded packets |
| A | 0 | 413153 | 0 |
| B | 0 | 381586 | 0 |
| C | 0 | 405617 | 0 |
| D | 0 | 455163 | 0 |
| Mode M9 | |||
|---|---|---|---|
| Quadrant | BADHDUFLAG | Total packets | Discarded packets |
| A | 0 | 702 | 0 |
| B | 0 | 702 | 0 |
| C | 0 | 702 | 0 |
| D | 0 | 702 | 0 |
| Quadrant | Total seconds | Saturated seconds | Saturation percentage |
|---|---|---|---|
| A | 185689 | 545 | 0.293501% |
| B | 185692 | 547 | 0.294574% |
| C | 185665 | 2311 | 1.244715% |
| D | 185663 | 5567 | 2.998443% |
Noise dominated data is calculated using 1-second bins in cleaned event files. If a bin has >2000 counts, and if more than 50% of those come from <1% of pixels, then it is considered to be noise-dominated and hence unusable.
| Quadrant | # 1 sec bins | Bins with >0 counts | Bins with >2000 counts | High rate bins dominated by noise | Noise dominated (total time) | Noise dominated (detector-on time) | Marked lightcurve |
|---|---|---|---|---|---|---|---|
| A | 256558 | 185812 | 0 | 0 | 0.00% | 0.00% |  |
| B | 256558 | 185806 | 0 | 0 | 0.00% | 0.00% |  |
| C | 256557 | 185717 | 0 | 0 | 0.00% | 0.00% |  |
| D | 256557 | 185726 | 0 | 0 | 0.00% | 0.00% |  |
Top three noisy pixels from each quadrant. If the there are fewer than three noisy pixels in the level2.evt file, extra rows are filled as -1
| Pixel properties | Quadrant properties | ||||||
|---|---|---|---|---|---|---|---|
| Quadrant | DetID | PixID | Counts | Sigma | Mean | Median | Sigma |
| A | 9 | 19 | 8101 | 8.51 | 2631 | 2461 | 662.8 |
| A | 0 | 29 | 8098 | 8.5 | 2631 | 2461 | 662.8 |
| A | 7 | 110 | 8078 | 8.47 | 2631 | 2461 | 662.8 |
| B | 2 | 9 | 8379 | 11.87 | 2568 | 2445 | 499.7 |
| B | 3 | 17 | 6905 | 8.92 | 2568 | 2445 | 499.7 |
| B | 3 | 80 | 6899 | 8.91 | 2568 | 2445 | 499.7 |
| C | 1 | 81 | 7998 | 8.22 | 2617 | 2446 | 675.7 |
| C | 3 | 202 | 7874 | 8.03 | 2617 | 2446 | 675.7 |
| C | 3 | 203 | 7824 | 7.96 | 2617 | 2446 | 675.7 |
| D | 7 | 3 | 6339 | 6.33 | 2445 | 2228 | 649.1 |
| D | 10 | 189 | 6240 | 6.18 | 2445 | 2228 | 649.1 |
| D | 3 | 14 | 6181 | 6.09 | 2445 | 2228 | 649.1 |
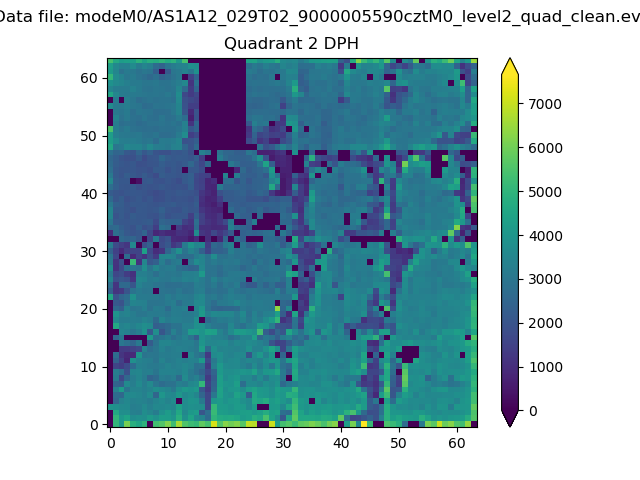
Histogram calculated using DETX and DETY for each event in the final _common_clean file
| Quadrant A |  |
 |
Quadrant B |
|---|---|---|---|
| Quadrant D |  |
 |
Quadrant C |
| Plot type | Count rate plots | Images |
|---|---|---|
| Comparison with Poisson distribution Blue bars denote a histogram of data divided into 1 sec bins. Red curve is a Poisson curve with rate = median count rate of data. |
 |
 |
| Quadrant-wise count rates Data is divided into 100 sec bins |
 |
|
| Module-wise count rates for Quadrant A Data is divided into 100 sec bins |
 |
 |
| Module-wise count rates for Quadrant B Data is divided into 100 sec bins |
 |
 |
| Module-wise count rates for Quadrant C Data is divided into 100 sec bins |
 |
 |
| Module-wise count rates for Quadrant D Data is divided into 100 sec bins |
 |
 |
| Parameter | Plot |
|---|---|
| CZT HV Monitor |  |
| D_VDD |  |
| Temperature 1 |  |
| Veto HV Monitor |  |
| Veto LLD |  |
| Alpha Counter |  |
| _CPM_Rate |  |
| CZT Counter |  |
| +2.5 Volts monitor |  |
| +5 Volts monitor |  |
| _ROLL_ROT |  |
| _Roll_DEC |  |
| _Roll_RA |  |
| Veto Counter |  |