| Param | Original file | Final file |
|---|---|---|
| Filename | modeM0/AS1A12_006T09_9000005592cztM0_level2.fits | modeM0/AS1A12_006T09_9000005592cztM0_level2_quad_clean.evt |
| Size (bytes) | 331,562,880 | 320,189,760 |
| Size | 316.2 MB | 305.4 MB |
| Events in quadrant A | 1,987,368 | 1,879,362 |
| Events in quadrant B | 1,899,682 | 1,872,657 |
| Events in quadrant C | 1,934,068 | 1,782,847 |
| Events in quadrant D | 1,661,010 | 1,602,609 |
| Mode M9 | |||
|---|---|---|---|
| Quadrant | BADHDUFLAG | Total packets | Discarded packets |
| A | 0 | 132 | 0 |
| B | 0 | 132 | 0 |
| C | 0 | 132 | 0 |
| D | 0 | 132 | 0 |
| Mode SS | |||
|---|---|---|---|
| Quadrant | BADHDUFLAG | Total packets | Discarded packets |
| A | 0 | 762 | 0 |
| B | 0 | 762 | 0 |
| C | 0 | 762 | 0 |
| D | 0 | 762 | 0 |
| Mode M0 | |||
|---|---|---|---|
| Quadrant | BADHDUFLAG | Total packets | Discarded packets |
| A | 0 | 79680 | 0 |
| B | 0 | 79701 | 0 |
| C | 0 | 79041 | 0 |
| D | 0 | 99822 | 0 |
| Quadrant | Total seconds | Saturated seconds | Saturation percentage |
|---|---|---|---|
| A | 37258 | 62 | 0.166407% |
| B | 37256 | 271 | 0.727400% |
| C | 37259 | 302 | 0.810542% |
| D | 37252 | 1594 | 4.278965% |
Noise dominated data is calculated using 1-second bins in cleaned event files. If a bin has >2000 counts, and if more than 50% of those come from <1% of pixels, then it is considered to be noise-dominated and hence unusable.
| Quadrant | # 1 sec bins | Bins with >0 counts | Bins with >2000 counts | High rate bins dominated by noise | Noise dominated (total time) | Noise dominated (detector-on time) | Marked lightcurve |
|---|---|---|---|---|---|---|---|
| A | 50493 | 37259 | 0 | 0 | 0.00% | 0.00% |  |
| B | 50493 | 37259 | 0 | 0 | 0.00% | 0.00% | 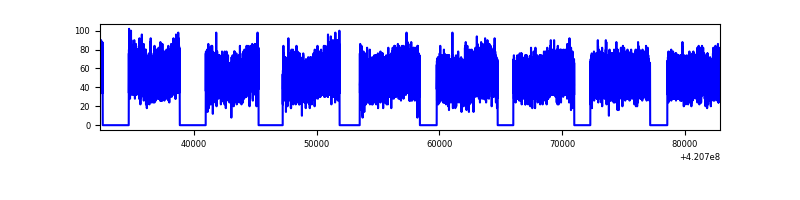 |
| C | 50493 | 37251 | 0 | 0 | 0.00% | 0.00% |  |
| D | 50493 | 37253 | 0 | 0 | 0.00% | 0.00% |  |
Top three noisy pixels from each quadrant. If the there are fewer than three noisy pixels in the level2.evt file, extra rows are filled as -1
| Pixel properties | Quadrant properties | ||||||
|---|---|---|---|---|---|---|---|
| Quadrant | DetID | PixID | Counts | Sigma | Mean | Median | Sigma |
| A | 7 | 110 | 1640 | 8.61 | 517 | 484 | 134.3 |
| A | 9 | 19 | 1615 | 8.42 | 517 | 484 | 134.3 |
| A | 0 | 29 | 1537 | 7.84 | 517 | 484 | 134.3 |
| B | 2 | 9 | 1637 | 11.65 | 501 | 476 | 99.6 |
| B | 2 | 8 | 1358 | 8.85 | 501 | 476 | 99.6 |
| B | 5 | 128 | 1330 | 8.57 | 501 | 476 | 99.6 |
| C | 1 | 81 | 1611 | 8.52 | 511 | 476 | 133.3 |
| C | 1 | 80 | 1591 | 8.37 | 511 | 476 | 133.3 |
| C | 3 | 202 | 1519 | 7.83 | 511 | 476 | 133.3 |
| D | 7 | 3 | 1233 | 6.29 | 474 | 432 | 127.3 |
| D | 3 | 14 | 1198 | 6.02 | 474 | 432 | 127.3 |
| D | 4 | 160 | 1176 | 5.84 | 474 | 432 | 127.3 |
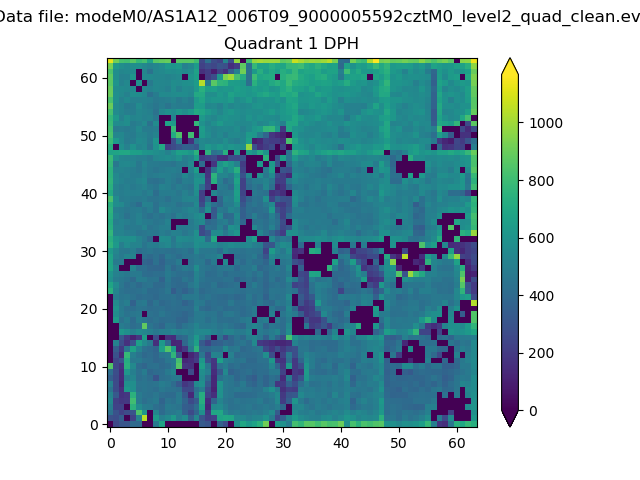
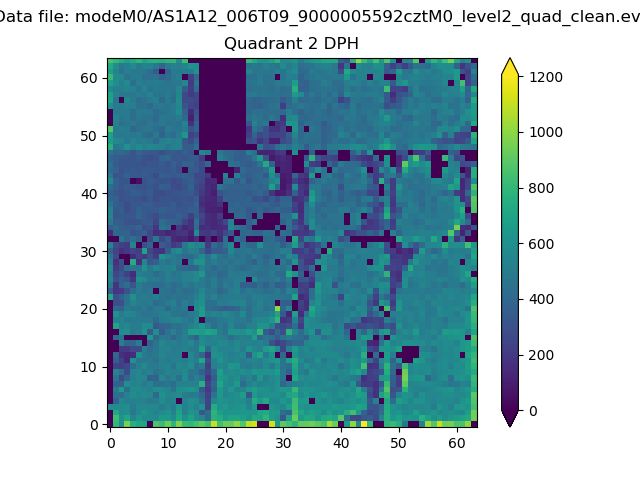
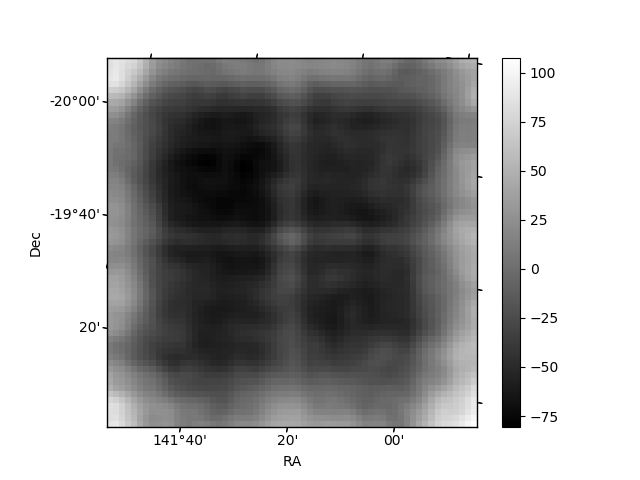
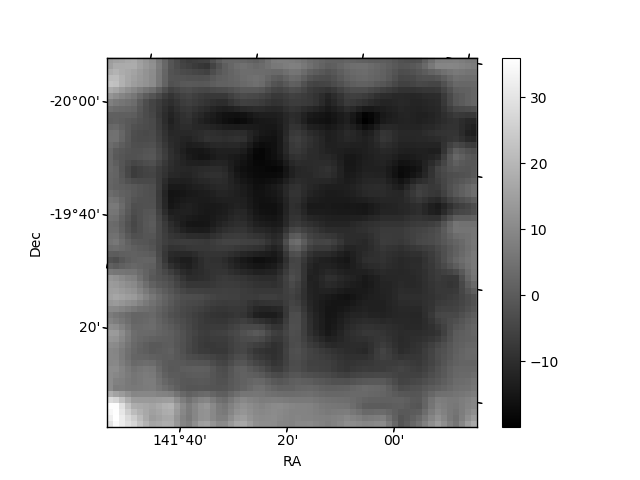
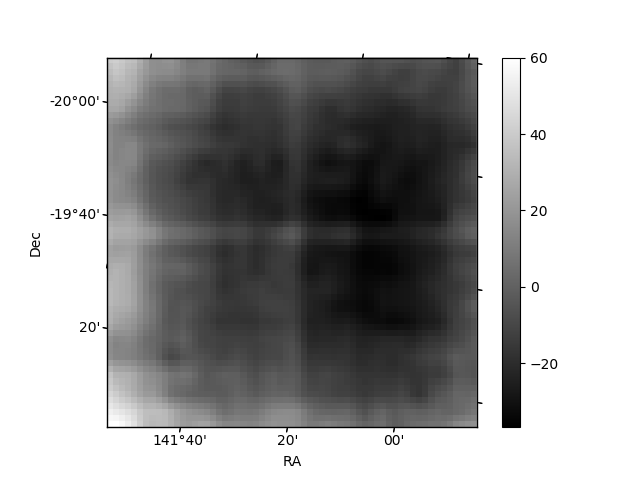
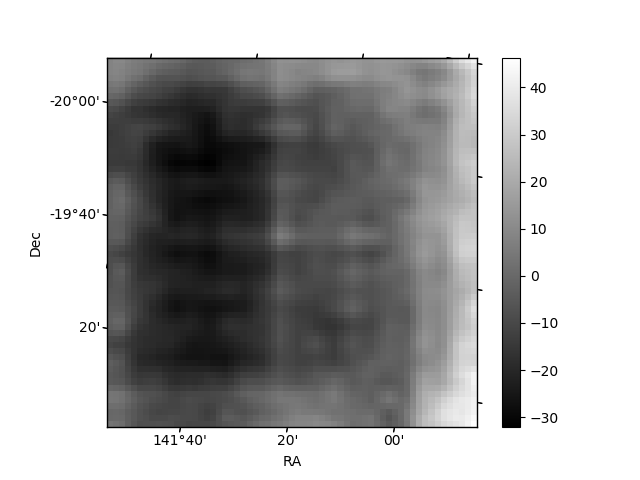
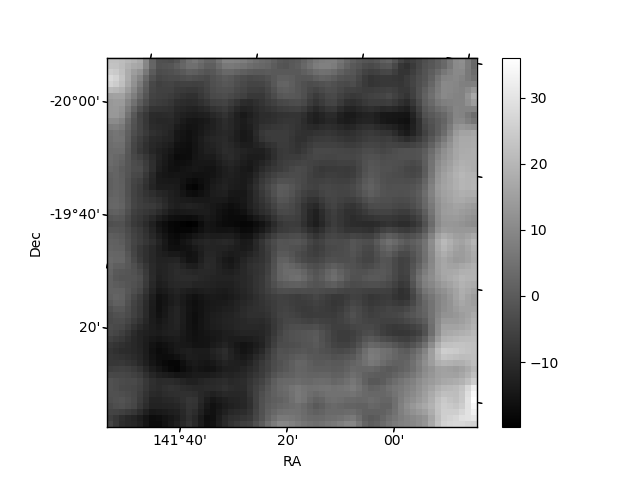
Histogram calculated using DETX and DETY for each event in the final _common_clean file
| Quadrant A |  |
 |
Quadrant B |
|---|---|---|---|
| Quadrant D | 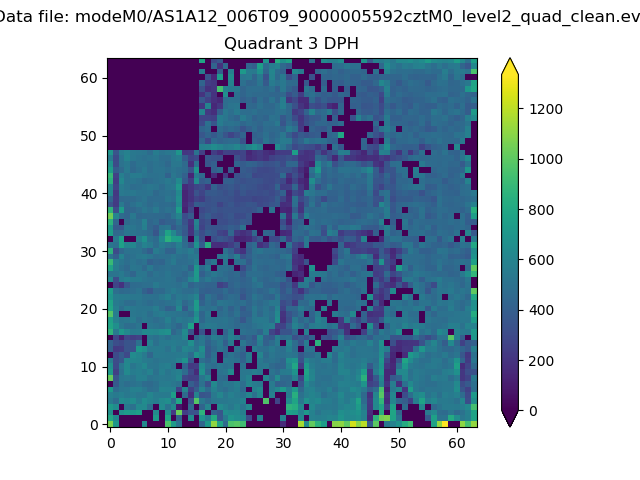 |
 |
Quadrant C |
| Plot type | Count rate plots | Images |
|---|---|---|
| Comparison with Poisson distribution Blue bars denote a histogram of data divided into 1 sec bins. Red curve is a Poisson curve with rate = median count rate of data. |
 |
 |
| Quadrant-wise count rates Data is divided into 100 sec bins |
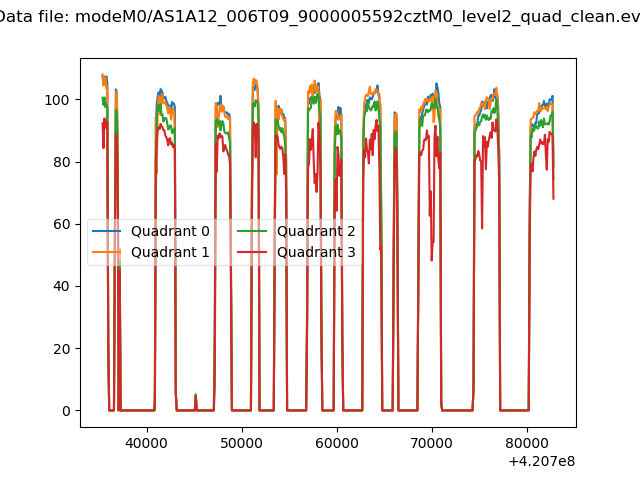 |
|
| Module-wise count rates for Quadrant A Data is divided into 100 sec bins |
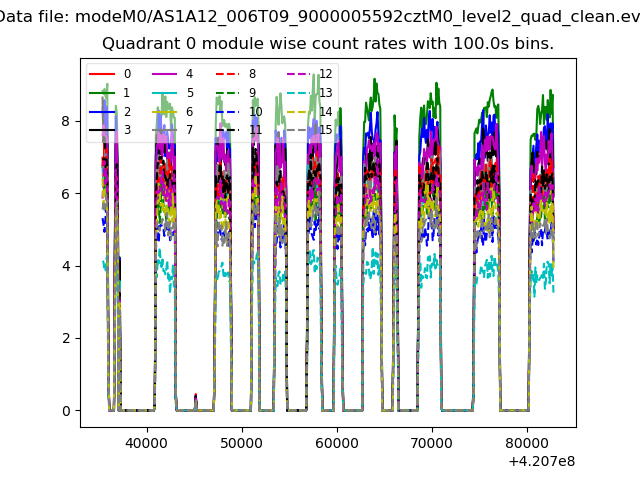 |
 |
| Module-wise count rates for Quadrant B Data is divided into 100 sec bins |
 |
 |
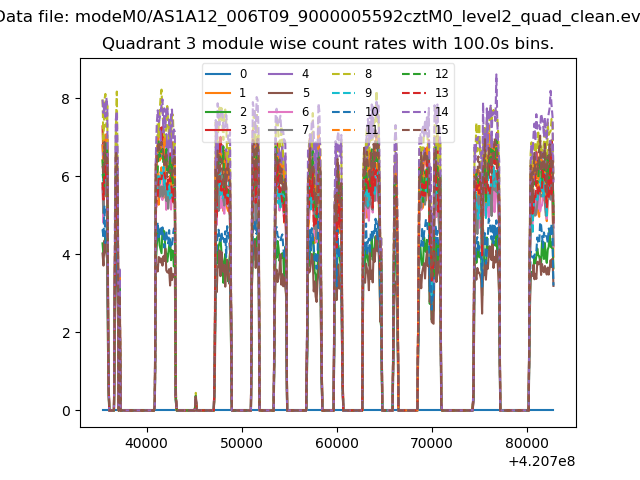
| Module-wise count rates for Quadrant C Data is divided into 100 sec bins |
 |
 |
| Module-wise count rates for Quadrant D Data is divided into 100 sec bins |
 |
 |
| Parameter | Plot |
|---|---|
| CZT HV Monitor |  |
| D_VDD | 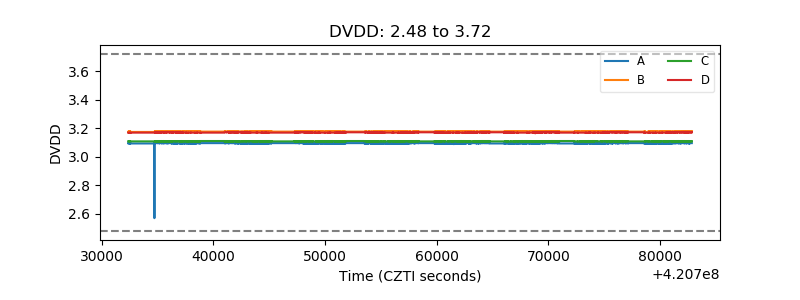 |
| Temperature 1 |  |
| Veto HV Monitor |  |
| Veto LLD |  |
| Alpha Counter | 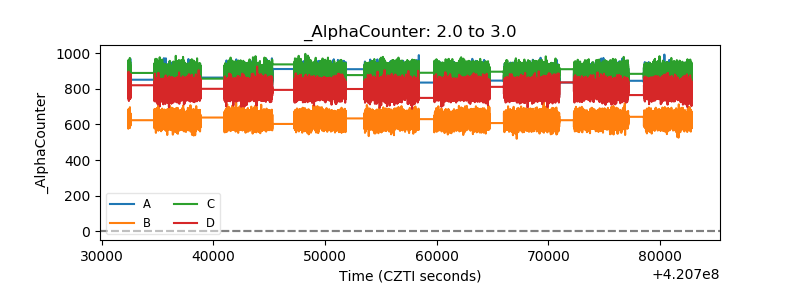 |
| _CPM_Rate | 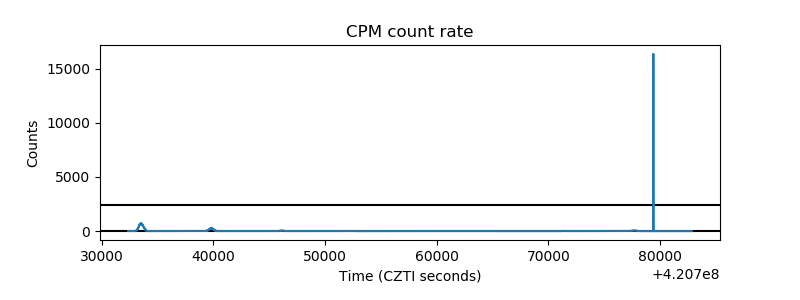 |
| CZT Counter |  |
| +2.5 Volts monitor |  |
| +5 Volts monitor |  |
| _ROLL_ROT |  |
| _Roll_DEC | 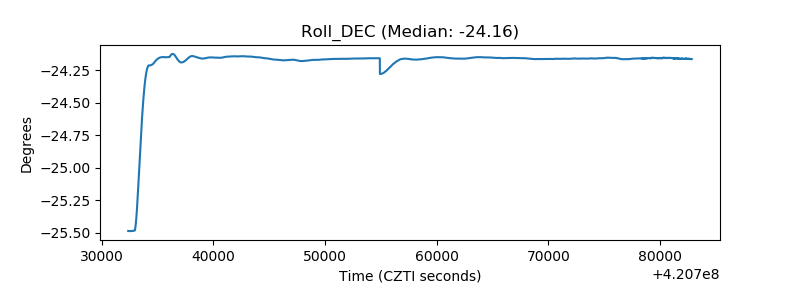 |
| _Roll_RA | 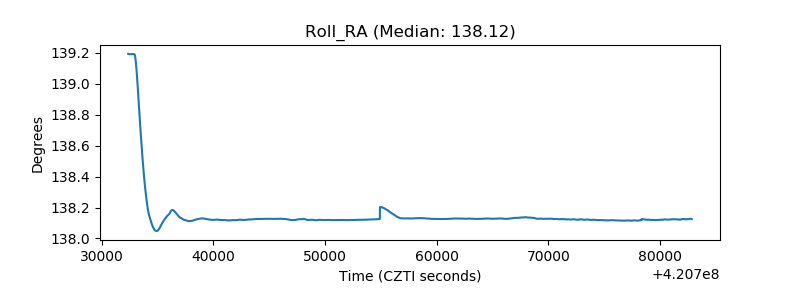 |
| Veto Counter |  |