| Param | Original file | Final file |
|---|---|---|
| Filename | modeM0/AS1A12_095T02_9000005596cztM0_level2.fits | modeM0/AS1A12_095T02_9000005596cztM0_level2_quad_clean.evt |
| Size (bytes) | 990,118,080 | 1,065,781,440 |
| Size | 944.3 MB | 1016.4 MB |
| Events in quadrant A | 5,987,286 | 6,587,074 |
| Events in quadrant B | 5,617,022 | 6,299,241 |
| Events in quadrant C | 5,827,316 | 6,248,665 |
| Events in quadrant D | 4,964,444 | 5,557,463 |
| Mode M0 | |||
|---|---|---|---|
| Quadrant | BADHDUFLAG | Total packets | Discarded packets |
| A | 0 | 251422 | 0 |
| B | 0 | 277108 | 0 |
| C | 0 | 235429 | 0 |
| D | 0 | 285025 | 0 |
| Mode SS | |||
|---|---|---|---|
| Quadrant | BADHDUFLAG | Total packets | Discarded packets |
| A | 0 | 2268 | 0 |
| B | 0 | 2268 | 0 |
| C | 0 | 2268 | 0 |
| D | 0 | 2268 | 0 |
| Mode M9 | |||
|---|---|---|---|
| Quadrant | BADHDUFLAG | Total packets | Discarded packets |
| A | 0 | 401 | 0 |
| B | 0 | 401 | 0 |
| C | 0 | 401 | 0 |
| D | 0 | 401 | 0 |
| Quadrant | Total seconds | Saturated seconds | Saturation percentage |
|---|---|---|---|
| A | 110676 | 297 | 0.268351% |
| B | 110676 | 4010 | 3.623188% |
| C | 110676 | 839 | 0.758069% |
| D | 110676 | 5515 | 4.983013% |
Noise dominated data is calculated using 1-second bins in cleaned event files. If a bin has >2000 counts, and if more than 50% of those come from <1% of pixels, then it is considered to be noise-dominated and hence unusable.
| Quadrant | # 1 sec bins | Bins with >0 counts | Bins with >2000 counts | High rate bins dominated by noise | Noise dominated (total time) | Noise dominated (detector-on time) | Marked lightcurve |
|---|---|---|---|---|---|---|---|
| A | 151060 | 110676 | 0 | 0 | 0.00% | 0.00% |  |
| B | 151060 | 110657 | 0 | 0 | 0.00% | 0.00% |  |
| C | 151060 | 110666 | 0 | 0 | 0.00% | 0.00% | 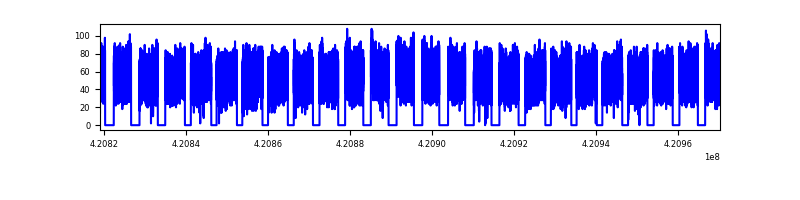 |
| D | 151060 | 110482 | 0 | 0 | 0.00% | 0.00% | 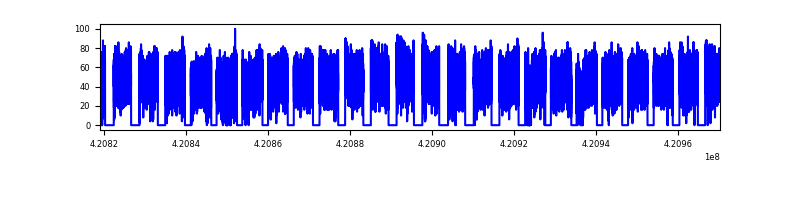 |
Top three noisy pixels from each quadrant. If the there are fewer than three noisy pixels in the level2.evt file, extra rows are filled as -1
| Pixel properties | Quadrant properties | ||||||
|---|---|---|---|---|---|---|---|
| Quadrant | DetID | PixID | Counts | Sigma | Mean | Median | Sigma |
| A | 0 | 29 | 4981 | 8.98 | 1562 | 1457 | 392.5 |
| A | 7 | 110 | 4866 | 8.69 | 1562 | 1457 | 392.5 |
| A | 9 | 19 | 4762 | 8.42 | 1562 | 1457 | 392.5 |
| B | 2 | 9 | 4858 | 11.76 | 1487 | 1416 | 292.7 |
| B | 3 | 80 | 4125 | 9.25 | 1487 | 1416 | 292.7 |
| B | 2 | 8 | 4001 | 8.83 | 1487 | 1416 | 292.7 |
| C | 1 | 81 | 4781 | 8.57 | 1538 | 1436 | 390.3 |
| C | 3 | 202 | 4643 | 8.22 | 1538 | 1436 | 390.3 |
| C | 1 | 80 | 4623 | 8.17 | 1538 | 1436 | 390.3 |
| D | 7 | 3 | 3700 | 6.34 | 1423 | 1289 | 380.3 |
| D | 10 | 189 | 3656 | 6.22 | 1423 | 1289 | 380.3 |
| D | 10 | 113 | 3600 | 6.08 | 1423 | 1289 | 380.3 |
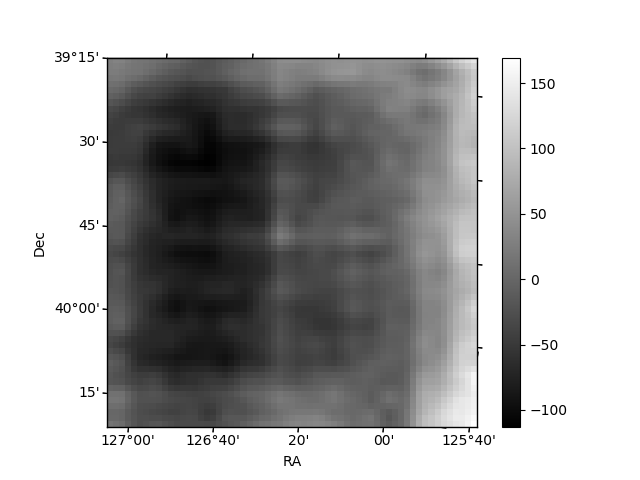
Histogram calculated using DETX and DETY for each event in the final _common_clean file
| Quadrant A | 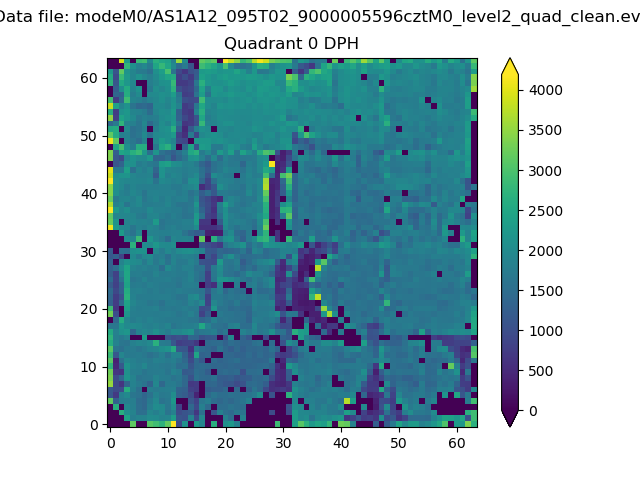 |
 |
Quadrant B |
|---|---|---|---|
| Quadrant D |  |
 |
Quadrant C |
| Plot type | Count rate plots | Images |
|---|---|---|
| Comparison with Poisson distribution Blue bars denote a histogram of data divided into 1 sec bins. Red curve is a Poisson curve with rate = median count rate of data. |
 |
 |
| Quadrant-wise count rates Data is divided into 100 sec bins |
 |
|
| Module-wise count rates for Quadrant A Data is divided into 100 sec bins |
 |
 |
| Module-wise count rates for Quadrant B Data is divided into 100 sec bins |
 |
 |
| Module-wise count rates for Quadrant C Data is divided into 100 sec bins |
 |
 |
| Module-wise count rates for Quadrant D Data is divided into 100 sec bins |
 |
 |
| Parameter | Plot |
|---|---|
| CZT HV Monitor |  |
| D_VDD | 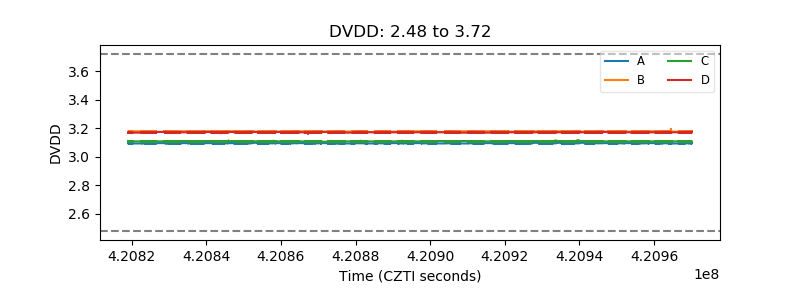 |
| Temperature 1 |  |
| Veto HV Monitor |  |
| Veto LLD |  |
| Alpha Counter |  |
| _CPM_Rate | 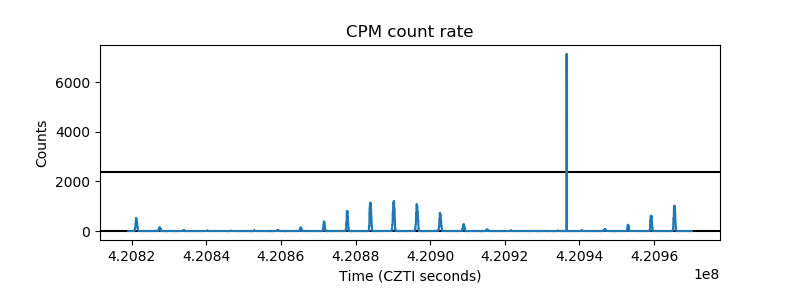 |
| CZT Counter | 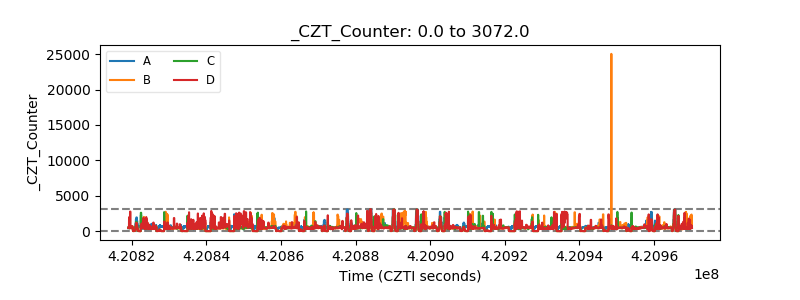 |
| +2.5 Volts monitor |  |
| +5 Volts monitor | 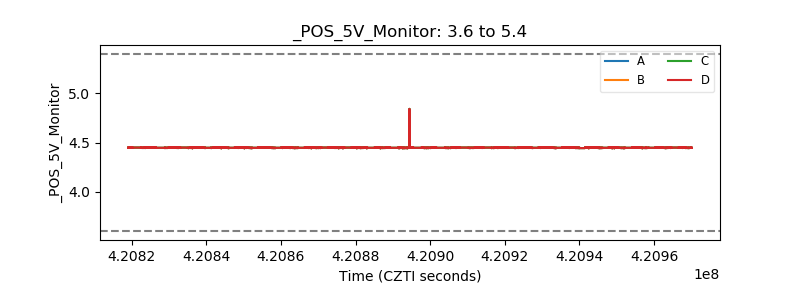 |
| _ROLL_ROT |  |
| _Roll_DEC |  |
| _Roll_RA |  |
| Veto Counter |  |