| Param | Original file | Final file |
|---|---|---|
| Filename | modeM0/AS1A12_032T01_9000005598cztM0_level2.fits | modeM0/AS1A12_032T01_9000005598cztM0_level2_quad_clean.evt |
| Size (bytes) | 117,077,760 | 83,335,680 |
| Size | 111.7 MB | 79.5 MB |
| Events in quadrant A | 730,668 | 453,000 |
| Events in quadrant B | 690,148 | 449,179 |
| Events in quadrant C | 700,184 | 424,882 |
| Events in quadrant D | 622,652 | 393,179 |
| Mode M9 | |||
|---|---|---|---|
| Quadrant | BADHDUFLAG | Total packets | Discarded packets |
| A | 0 | 54 | 0 |
| B | 0 | 54 | 0 |
| C | 0 | 54 | 0 |
| D | 0 | 54 | 0 |
| Mode SS | |||
|---|---|---|---|
| Quadrant | BADHDUFLAG | Total packets | Discarded packets |
| A | 0 | 236 | 0 |
| B | 0 | 236 | 0 |
| C | 0 | 236 | 0 |
| D | 0 | 236 | 0 |
| Mode M0 | |||
|---|---|---|---|
| Quadrant | BADHDUFLAG | Total packets | Discarded packets |
| A | 0 | 26387 | 0 |
| B | 0 | 25670 | 0 |
| C | 0 | 24485 | 0 |
| D | 0 | 26127 | 0 |
| Quadrant | Total seconds | Saturated seconds | Saturation percentage |
|---|---|---|---|
| A | 11600 | 23 | 0.198276% |
| B | 11600 | 195 | 1.681034% |
| C | 11600 | 80 | 0.689655% |
| D | 11600 | 128 | 1.103448% |
Noise dominated data is calculated using 1-second bins in cleaned event files. If a bin has >2000 counts, and if more than 50% of those come from <1% of pixels, then it is considered to be noise-dominated and hence unusable.
| Quadrant | # 1 sec bins | Bins with >0 counts | Bins with >2000 counts | High rate bins dominated by noise | Noise dominated (total time) | Noise dominated (detector-on time) | Marked lightcurve |
|---|---|---|---|---|---|---|---|
| A | 15723 | 11599 | 0 | 0 | 0.00% | 0.00% | 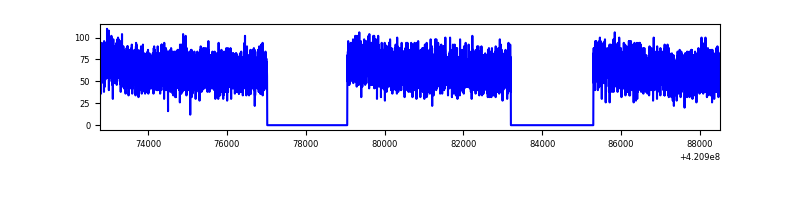 |
| B | 15723 | 11599 | 0 | 0 | 0.00% | 0.00% |  |
| C | 15723 | 11599 | 0 | 0 | 0.00% | 0.00% | 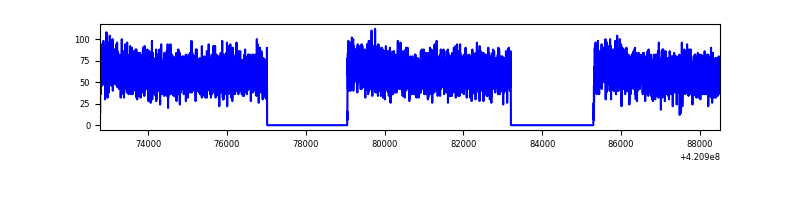 |
| D | 15723 | 11596 | 0 | 0 | 0.00% | 0.00% |  |
Top three noisy pixels from each quadrant. If the there are fewer than three noisy pixels in the level2.evt file, extra rows are filled as -1
| Pixel properties | Quadrant properties | ||||||
|---|---|---|---|---|---|---|---|
| Quadrant | DetID | PixID | Counts | Sigma | Mean | Median | Sigma |
| A | 7 | 110 | 607 | 8.74 | 190 | 180 | 48.9 |
| A | 14 | 95 | 601 | 8.62 | 190 | 180 | 48.9 |
| A | 9 | 19 | 599 | 8.58 | 190 | 180 | 48.9 |
| B | 2 | 9 | 568 | 10.42 | 182 | 175 | 37.7 |
| B | 2 | 8 | 500 | 8.62 | 182 | 175 | 37.7 |
| B | 3 | 80 | 477 | 8.01 | 182 | 175 | 37.7 |
| C | 3 | 203 | 549 | 7.71 | 185 | 174 | 48.6 |
| C | 1 | 81 | 543 | 7.59 | 185 | 174 | 48.6 |
| C | 3 | 202 | 540 | 7.53 | 185 | 174 | 48.6 |
| D | 7 | 3 | 477 | 6.53 | 177 | 163 | 48.1 |
| D | 10 | 189 | 458 | 6.13 | 177 | 163 | 48.1 |
| D | 10 | 113 | 441 | 5.78 | 177 | 163 | 48.1 |
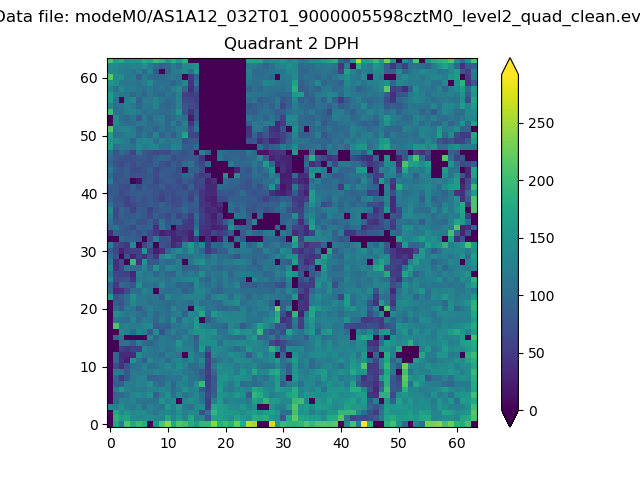
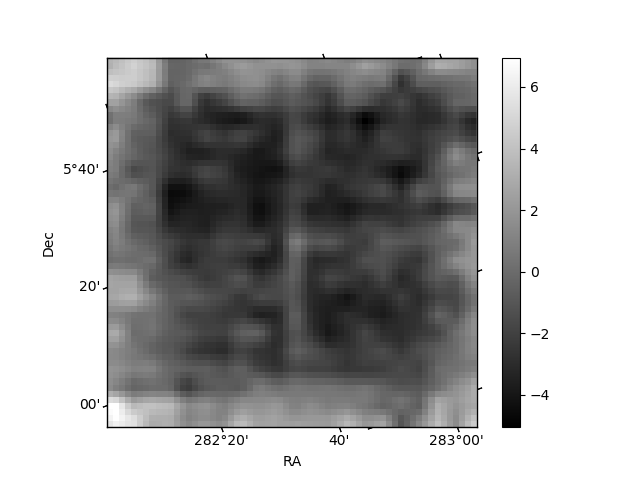
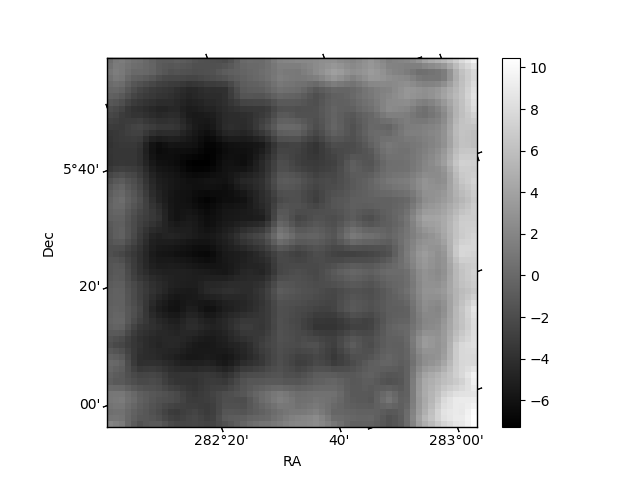
Histogram calculated using DETX and DETY for each event in the final _common_clean file
| Quadrant A | 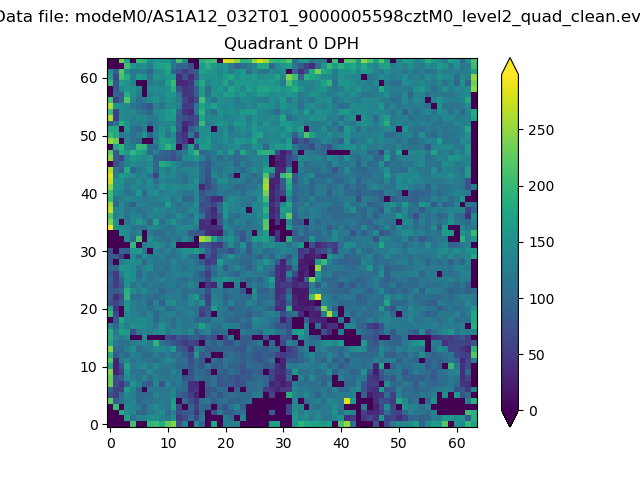 |
 |
Quadrant B |
|---|---|---|---|
| Quadrant D |  |
 |
Quadrant C |
| Plot type | Count rate plots | Images |
|---|---|---|
| Comparison with Poisson distribution Blue bars denote a histogram of data divided into 1 sec bins. Red curve is a Poisson curve with rate = median count rate of data. |
 |
 |
| Quadrant-wise count rates Data is divided into 100 sec bins |
 |
|
| Module-wise count rates for Quadrant A Data is divided into 100 sec bins |
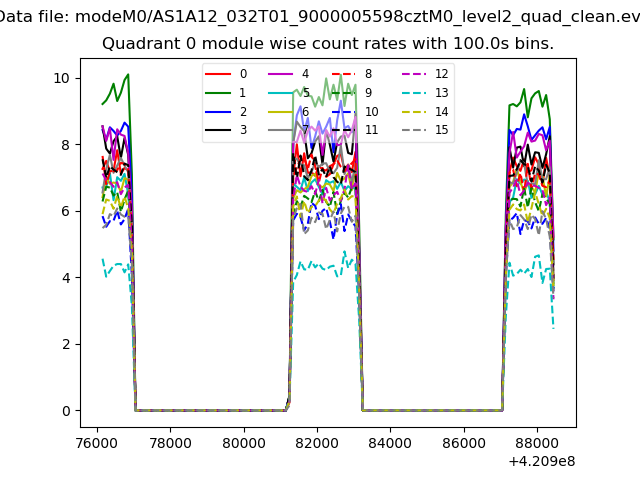 |
 |
| Module-wise count rates for Quadrant B Data is divided into 100 sec bins |
 |
 |
| Module-wise count rates for Quadrant C Data is divided into 100 sec bins |
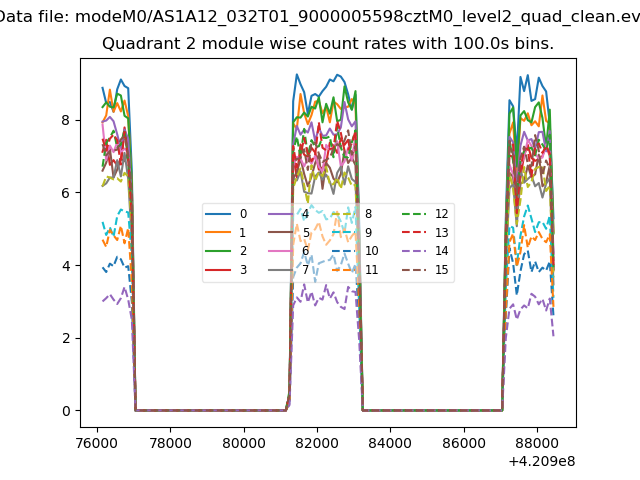 |
 |
| Module-wise count rates for Quadrant D Data is divided into 100 sec bins |
 |
 |
| Parameter | Plot |
|---|---|
| CZT HV Monitor |  |
| D_VDD | 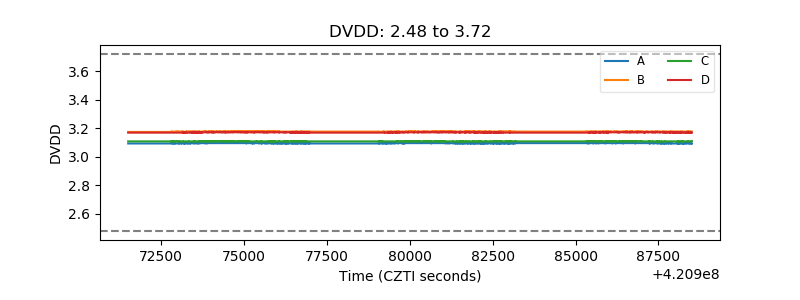 |
| Temperature 1 | 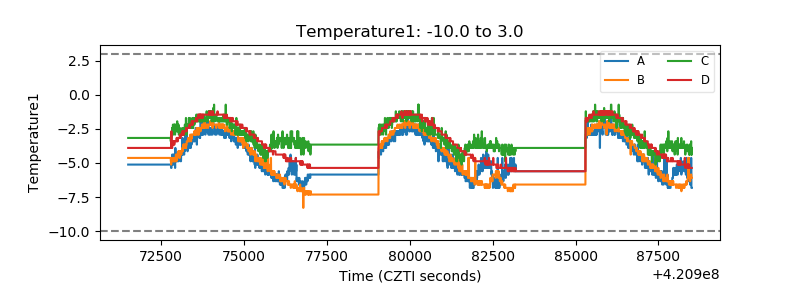 |
| Veto HV Monitor | 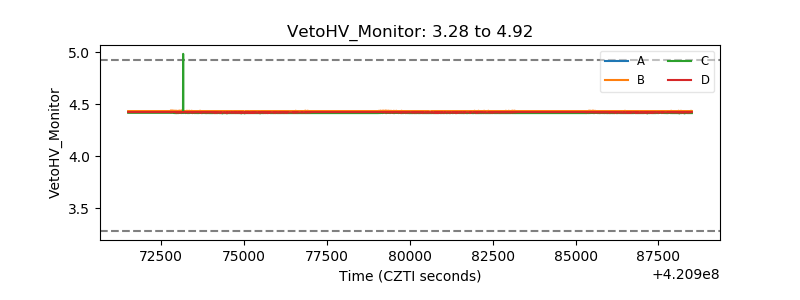 |
| Veto LLD |  |
| Alpha Counter |  |
| _CPM_Rate |  |
| CZT Counter | 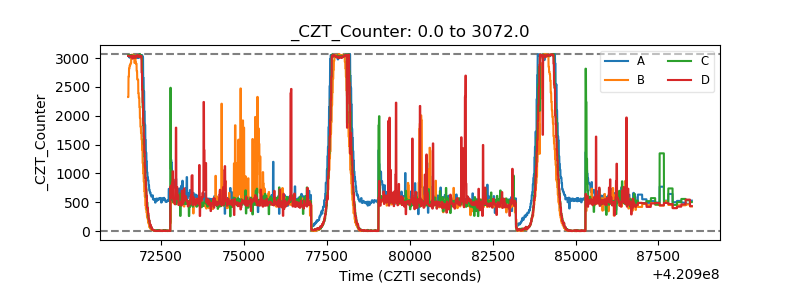 |
| +2.5 Volts monitor | 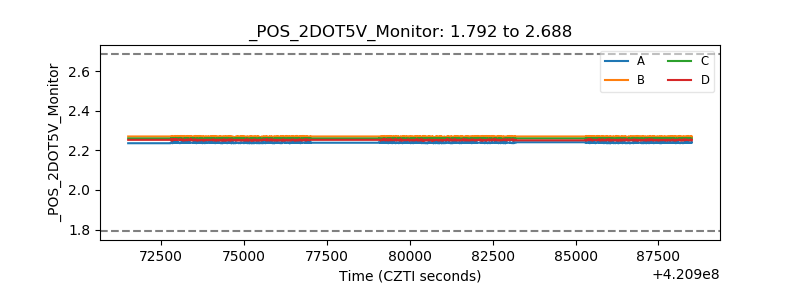 |
| +5 Volts monitor |  |
| _ROLL_ROT |  |
| _Roll_DEC |  |
| _Roll_RA | 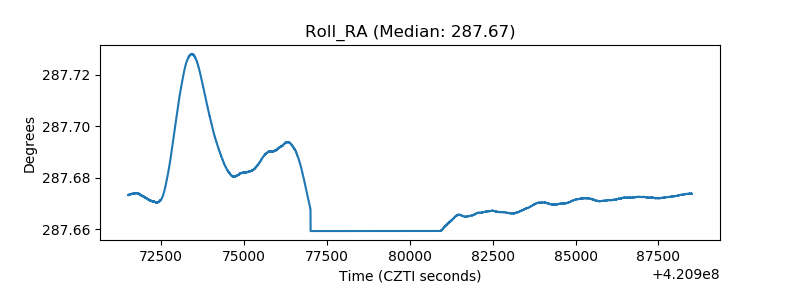 |
| Veto Counter | 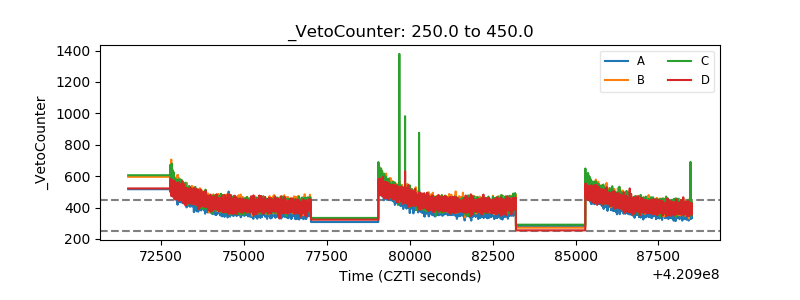 |