| Param | Original file | Final file |
|---|---|---|
| Filename | modeM0/AS1A12_025T12_9000005604cztM0_level2.fits | modeM0/AS1A12_025T12_9000005604cztM0_level2_quad_clean.evt |
| Size (bytes) | 262,607,040 | 239,950,080 |
| Size | 250.4 MB | 228.8 MB |
| Events in quadrant A | 1,605,140 | 1,411,433 |
| Events in quadrant B | 1,512,354 | 1,381,625 |
| Events in quadrant C | 1,536,484 | 1,324,265 |
| Events in quadrant D | 1,357,386 | 1,207,231 |
| Mode M9 | |||
|---|---|---|---|
| Quadrant | BADHDUFLAG | Total packets | Discarded packets |
| A | 0 | 104 | 0 |
| B | 0 | 104 | 0 |
| C | 0 | 104 | 0 |
| D | 0 | 104 | 0 |
| Mode SS | |||
|---|---|---|---|
| Quadrant | BADHDUFLAG | Total packets | Discarded packets |
| A | 0 | 572 | 0 |
| B | 0 | 572 | 0 |
| C | 0 | 572 | 0 |
| D | 0 | 572 | 0 |
| Mode M0 | |||
|---|---|---|---|
| Quadrant | BADHDUFLAG | Total packets | Discarded packets |
| A | 0 | 60844 | 0 |
| B | 0 | 66918 | 0 |
| C | 0 | 67300 | 0 |
| D | 0 | 63863 | 0 |
| Quadrant | Total seconds | Saturated seconds | Saturation percentage |
|---|---|---|---|
| A | 28251 | 40 | 0.141588% |
| B | 28251 | 847 | 2.998124% |
| C | 28251 | 303 | 1.072528% |
| D | 28251 | 414 | 1.465435% |
Noise dominated data is calculated using 1-second bins in cleaned event files. If a bin has >2000 counts, and if more than 50% of those come from <1% of pixels, then it is considered to be noise-dominated and hence unusable.
| Quadrant | # 1 sec bins | Bins with >0 counts | Bins with >2000 counts | High rate bins dominated by noise | Noise dominated (total time) | Noise dominated (detector-on time) | Marked lightcurve |
|---|---|---|---|---|---|---|---|
| A | 38587 | 28252 | 0 | 0 | 0.00% | 0.00% |  |
| B | 38587 | 28250 | 0 | 0 | 0.00% | 0.00% |  |
| C | 38587 | 28248 | 0 | 0 | 0.00% | 0.00% | 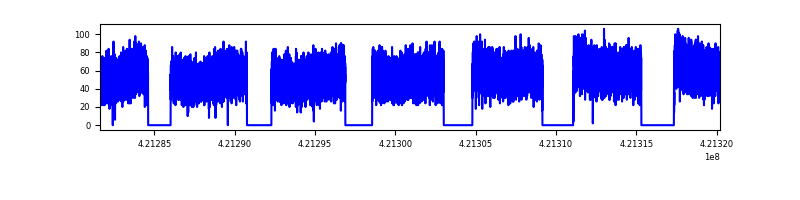 |
| D | 38587 | 28248 | 0 | 0 | 0.00% | 0.00% |  |
Top three noisy pixels from each quadrant. If the there are fewer than three noisy pixels in the level2.evt file, extra rows are filled as -1
| Pixel properties | Quadrant properties | ||||||
|---|---|---|---|---|---|---|---|
| Quadrant | DetID | PixID | Counts | Sigma | Mean | Median | Sigma |
| A | 7 | 110 | 1276 | 8.28 | 419 | 393 | 106.7 |
| A | 9 | 19 | 1228 | 7.83 | 419 | 393 | 106.7 |
| A | 0 | 29 | 1195 | 7.52 | 419 | 393 | 106.7 |
| B | 2 | 9 | 1349 | 11.99 | 399 | 380 | 80.8 |
| B | 2 | 8 | 1072 | 8.56 | 399 | 380 | 80.8 |
| B | 3 | 80 | 1066 | 8.49 | 399 | 380 | 80.8 |
| C | 1 | 81 | 1268 | 8.34 | 406 | 380 | 106.5 |
| C | 1 | 80 | 1187 | 7.58 | 406 | 380 | 106.5 |
| C | 3 | 202 | 1127 | 7.01 | 406 | 380 | 106.5 |
| D | 7 | 3 | 1072 | 6.98 | 387 | 355 | 102.7 |
| D | 4 | 160 | 996 | 6.24 | 387 | 355 | 102.7 |
| D | 6 | 67 | 967 | 5.96 | 387 | 355 | 102.7 |
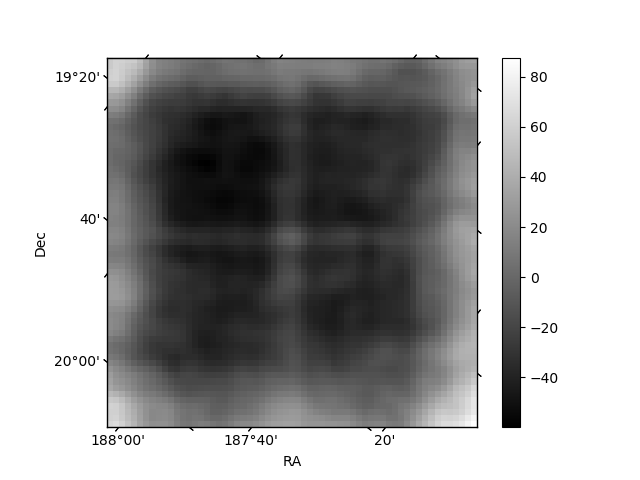
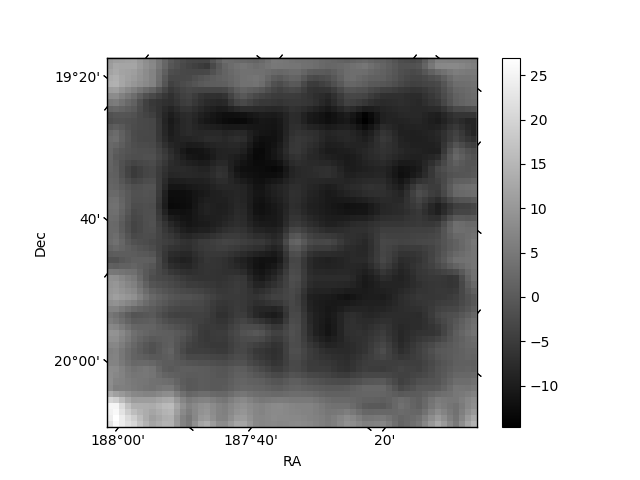
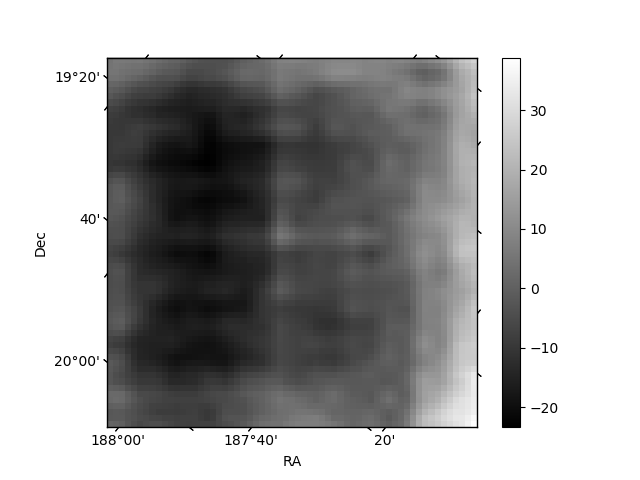
Histogram calculated using DETX and DETY for each event in the final _common_clean file
| Quadrant A |  |
 |
Quadrant B |
|---|---|---|---|
| Quadrant D |  |
 |
Quadrant C |
| Plot type | Count rate plots | Images |
|---|---|---|
| Comparison with Poisson distribution Blue bars denote a histogram of data divided into 1 sec bins. Red curve is a Poisson curve with rate = median count rate of data. |
 |
 |
| Quadrant-wise count rates Data is divided into 100 sec bins |
 |
|
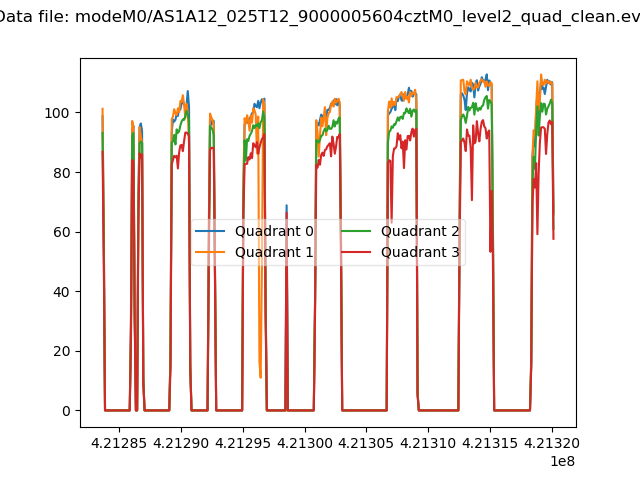
| Module-wise count rates for Quadrant A Data is divided into 100 sec bins |
 |
 |
| Module-wise count rates for Quadrant B Data is divided into 100 sec bins |
 |
 |
| Module-wise count rates for Quadrant C Data is divided into 100 sec bins |
 |
 |
| Module-wise count rates for Quadrant D Data is divided into 100 sec bins |
 |
 |
| Parameter | Plot |
|---|---|
| CZT HV Monitor | 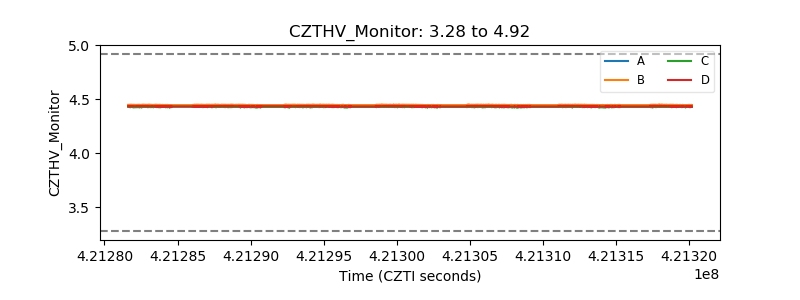 |
| D_VDD |  |
| Temperature 1 |  |
| Veto HV Monitor |  |
| Veto LLD |  |
| Alpha Counter |  |
| _CPM_Rate | 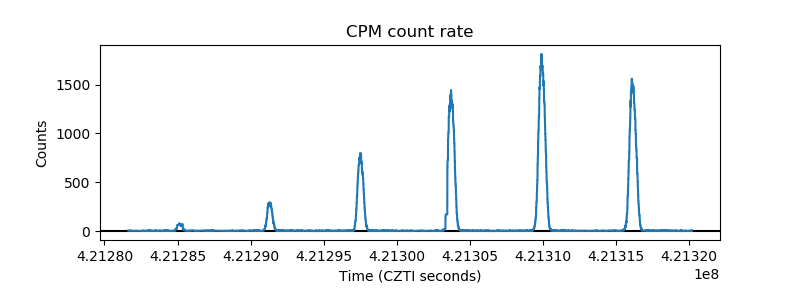 |
| CZT Counter | 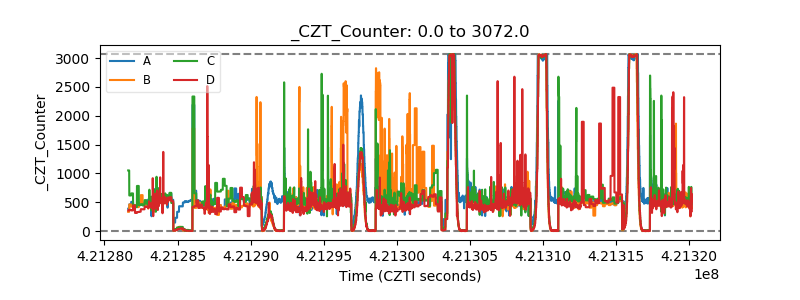 |
| +2.5 Volts monitor |  |
| +5 Volts monitor |  |
| _ROLL_ROT |  |
| _Roll_DEC |  |
| _Roll_RA | 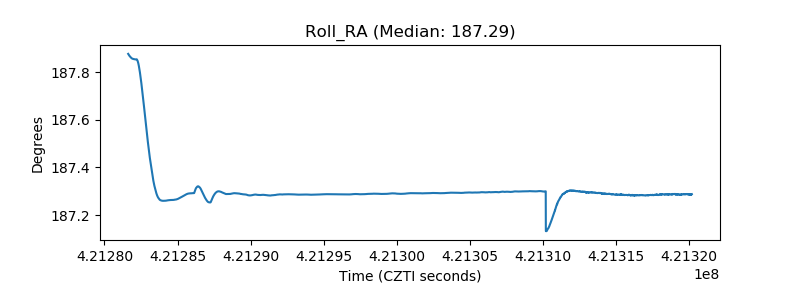 |
| Veto Counter |  |