| Param | Original file | Final file |
|---|---|---|
| Filename | modeM0/AS1A12_025T14_9000005606cztM0_level2.fits | modeM0/AS1A12_025T14_9000005606cztM0_level2_quad_clean.evt |
| Size (bytes) | 83,649,600 | 102,427,200 |
| Size | 79.8 MB | 97.7 MB |
| Events in quadrant A | 517,108 | 662,864 |
| Events in quadrant B | 488,976 | 656,015 |
| Events in quadrant C | 491,892 | 616,258 |
| Events in quadrant D | 431,182 | 561,954 |
| Mode M0 | |||
|---|---|---|---|
| Quadrant | BADHDUFLAG | Total packets | Discarded packets |
| A | 0 | 18853 | 0 |
| B | 0 | 19493 | 0 |
| C | 0 | 19462 | 0 |
| D | 0 | 24627 | 0 |
| Mode SS | |||
|---|---|---|---|
| Quadrant | BADHDUFLAG | Total packets | Discarded packets |
| A | 0 | 180 | 0 |
| B | 0 | 180 | 0 |
| C | 0 | 180 | 0 |
| D | 0 | 180 | 0 |
| Mode M9 | |||
|---|---|---|---|
| Quadrant | BADHDUFLAG | Total packets | Discarded packets |
| A | 0 | 42 | 0 |
| B | 0 | 42 | 0 |
| C | 0 | 42 | 0 |
| D | 0 | 42 | 0 |
| Quadrant | Total seconds | Saturated seconds | Saturation percentage |
|---|---|---|---|
| A | 8702 | 12 | 0.137899% |
| B | 8702 | 63 | 0.723972% |
| C | 8702 | 107 | 1.229602% |
| D | 8702 | 84 | 0.965295% |
Noise dominated data is calculated using 1-second bins in cleaned event files. If a bin has >2000 counts, and if more than 50% of those come from <1% of pixels, then it is considered to be noise-dominated and hence unusable.
| Quadrant | # 1 sec bins | Bins with >0 counts | Bins with >2000 counts | High rate bins dominated by noise | Noise dominated (total time) | Noise dominated (detector-on time) | Marked lightcurve |
|---|---|---|---|---|---|---|---|
| A | 12978 | 8703 | 0 | 0 | 0.00% | 0.00% |  |
| B | 12978 | 8702 | 0 | 0 | 0.00% | 0.00% |  |
| C | 12978 | 8697 | 0 | 0 | 0.00% | 0.00% |  |
| D | 12978 | 8701 | 0 | 0 | 0.00% | 0.00% |  |
Top three noisy pixels from each quadrant. If the there are fewer than three noisy pixels in the level2.evt file, extra rows are filled as -1
| Pixel properties | Quadrant properties | ||||||
|---|---|---|---|---|---|---|---|
| Quadrant | DetID | PixID | Counts | Sigma | Mean | Median | Sigma |
| A | 0 | 29 | 444 | 8.96 | 135 | 128 | 35.3 |
| A | 9 | 19 | 435 | 8.71 | 135 | 128 | 35.3 |
| A | 7 | 110 | 434 | 8.68 | 135 | 128 | 35.3 |
| B | 2 | 9 | 429 | 11.12 | 129 | 123 | 27.5 |
| B | 3 | 17 | 397 | 9.96 | 129 | 123 | 27.5 |
| B | 3 | 80 | 366 | 8.83 | 129 | 123 | 27.5 |
| C | 1 | 80 | 387 | 7.59 | 130 | 123 | 34.8 |
| C | 3 | 203 | 384 | 7.51 | 130 | 123 | 34.8 |
| C | 1 | 81 | 379 | 7.36 | 130 | 123 | 34.8 |
| D | 7 | 3 | 342 | 6.76 | 123 | 112 | 34.0 |
| D | 10 | 189 | 327 | 6.32 | 123 | 112 | 34.0 |
| D | 6 | 67 | 313 | 5.91 | 123 | 112 | 34.0 |
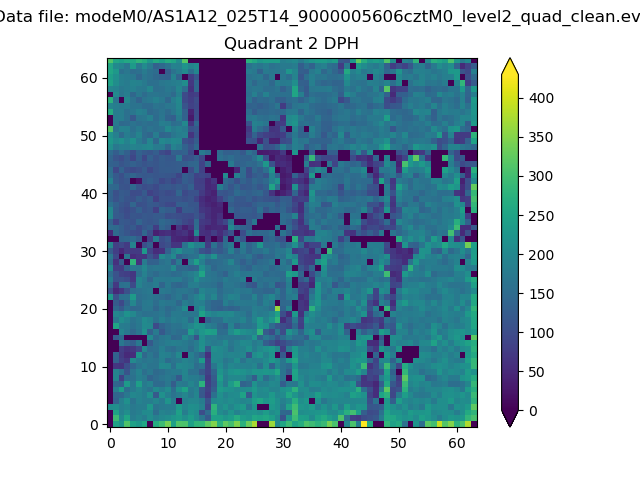
Histogram calculated using DETX and DETY for each event in the final _common_clean file
| Quadrant A |  |
 |
Quadrant B |
|---|---|---|---|
| Quadrant D | 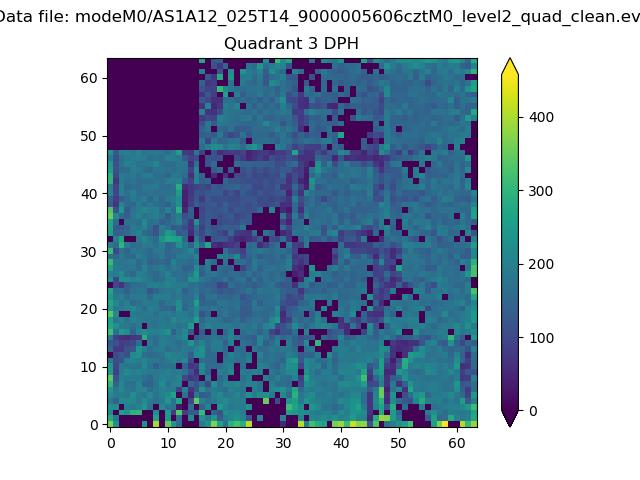 |
 |
Quadrant C |
| Plot type | Count rate plots | Images |
|---|---|---|
| Comparison with Poisson distribution Blue bars denote a histogram of data divided into 1 sec bins. Red curve is a Poisson curve with rate = median count rate of data. |
 |
 |
| Quadrant-wise count rates Data is divided into 100 sec bins |
 |
|
| Module-wise count rates for Quadrant A Data is divided into 100 sec bins |
 |
 |
| Module-wise count rates for Quadrant B Data is divided into 100 sec bins |
 |
 |
| Module-wise count rates for Quadrant C Data is divided into 100 sec bins |
 |
 |
| Module-wise count rates for Quadrant D Data is divided into 100 sec bins |
 |
 |
| Parameter | Plot |
|---|---|
| CZT HV Monitor |  |
| D_VDD | 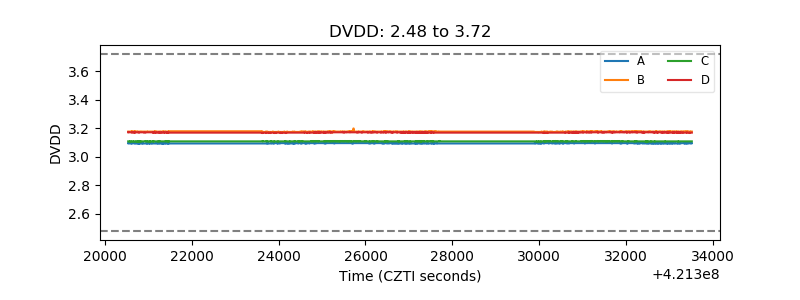 |
| Temperature 1 |  |
| Veto HV Monitor |  |
| Veto LLD | 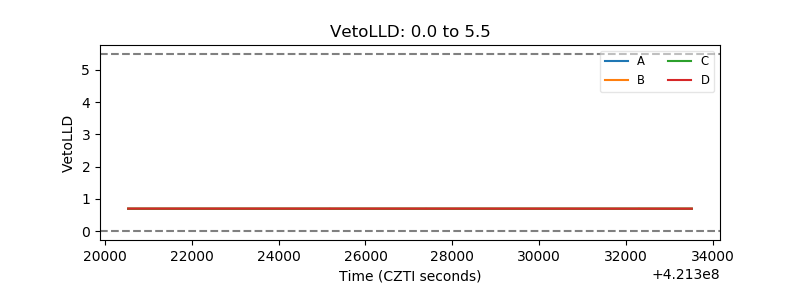 |
| Alpha Counter |  |
| _CPM_Rate |  |
| CZT Counter |  |
| +2.5 Volts monitor |  |
| +5 Volts monitor |  |
| _ROLL_ROT |  |
| _Roll_DEC |  |
| _Roll_RA |  |
| Veto Counter |  |