| Param | Original file | Final file |
|---|---|---|
| Filename | modeM0/AS1A12_037T01_9000005608cztM0_level2.fits | modeM0/AS1A12_037T01_9000005608cztM0_level2_quad_clean.evt |
| Size (bytes) | 259,810,560 | 265,559,040 |
| Size | 247.8 MB | 253.3 MB |
| Events in quadrant A | 1,571,460 | 1,620,971 |
| Events in quadrant B | 1,488,428 | 1,587,589 |
| Events in quadrant C | 1,445,950 | 1,398,807 |
| Events in quadrant D | 1,311,986 | 1,385,626 |
| Mode SS | |||
|---|---|---|---|
| Quadrant | BADHDUFLAG | Total packets | Discarded packets |
| A | 0 | 610 | 0 |
| B | 0 | 610 | 0 |
| C | 0 | 610 | 0 |
| D | 0 | 610 | 0 |
| Mode M0 | |||
|---|---|---|---|
| Quadrant | BADHDUFLAG | Total packets | Discarded packets |
| A | 0 | 63729 | 0 |
| B | 0 | 68352 | 0 |
| C | 0 | 85972 | 0 |
| D | 0 | 86947 | 0 |
| Mode M9 | |||
|---|---|---|---|
| Quadrant | BADHDUFLAG | Total packets | Discarded packets |
| A | 0 | 108 | 0 |
| B | 0 | 108 | 0 |
| C | 0 | 108 | 0 |
| D | 0 | 108 | 0 |
| Quadrant | Total seconds | Saturated seconds | Saturation percentage |
|---|---|---|---|
| A | 29809 | 55 | 0.184508% |
| B | 29809 | 472 | 1.583414% |
| C | 29809 | 2995 | 10.047301% |
| D | 29809 | 469 | 1.573350% |
Noise dominated data is calculated using 1-second bins in cleaned event files. If a bin has >2000 counts, and if more than 50% of those come from <1% of pixels, then it is considered to be noise-dominated and hence unusable.
| Quadrant | # 1 sec bins | Bins with >0 counts | Bins with >2000 counts | High rate bins dominated by noise | Noise dominated (total time) | Noise dominated (detector-on time) | Marked lightcurve |
|---|---|---|---|---|---|---|---|
| A | 40588 | 29809 | 0 | 0 | 0.00% | 0.00% |  |
| B | 40588 | 29809 | 0 | 0 | 0.00% | 0.00% |  |
| C | 40588 | 29789 | 0 | 0 | 0.00% | 0.00% |  |
| D | 40588 | 29785 | 0 | 0 | 0.00% | 0.00% |  |
Top three noisy pixels from each quadrant. If the there are fewer than three noisy pixels in the level2.evt file, extra rows are filled as -1
| Pixel properties | Quadrant properties | ||||||
|---|---|---|---|---|---|---|---|
| Quadrant | DetID | PixID | Counts | Sigma | Mean | Median | Sigma |
| A | 7 | 110 | 1327 | 9.0 | 409 | 382 | 105.0 |
| A | 0 | 29 | 1276 | 8.52 | 409 | 382 | 105.0 |
| A | 14 | 95 | 1263 | 8.39 | 409 | 382 | 105.0 |
| B | 2 | 9 | 1247 | 10.98 | 392 | 372 | 79.7 |
| B | 3 | 17 | 1063 | 8.67 | 392 | 372 | 79.7 |
| B | 3 | 80 | 1041 | 8.39 | 392 | 372 | 79.7 |
| C | 1 | 81 | 1181 | 8.25 | 382 | 355 | 100.1 |
| C | 1 | 80 | 1123 | 7.67 | 382 | 355 | 100.1 |
| C | 3 | 202 | 1119 | 7.63 | 382 | 355 | 100.1 |
| D | 7 | 3 | 980 | 6.24 | 374 | 340 | 102.6 |
| D | 10 | 113 | 951 | 5.96 | 374 | 340 | 102.6 |
| D | 6 | 62 | 947 | 5.92 | 374 | 340 | 102.6 |
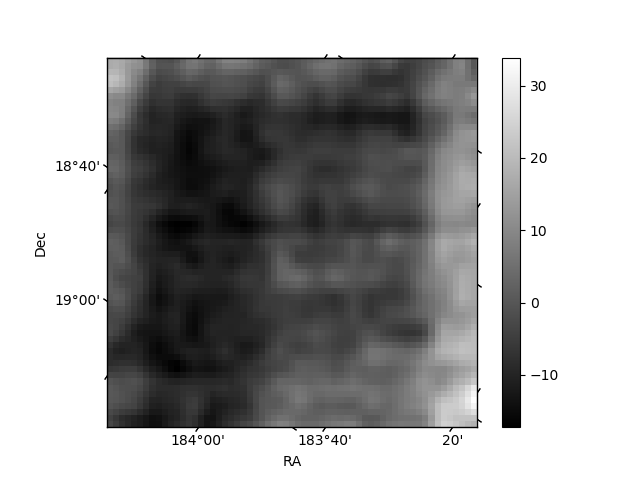
Histogram calculated using DETX and DETY for each event in the final _common_clean file
| Quadrant A | 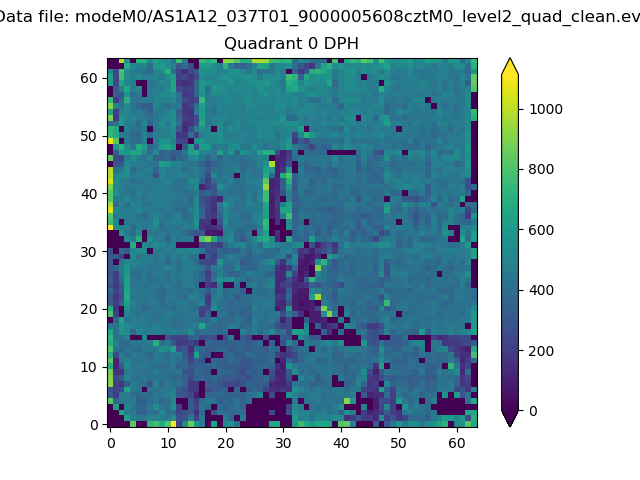 |
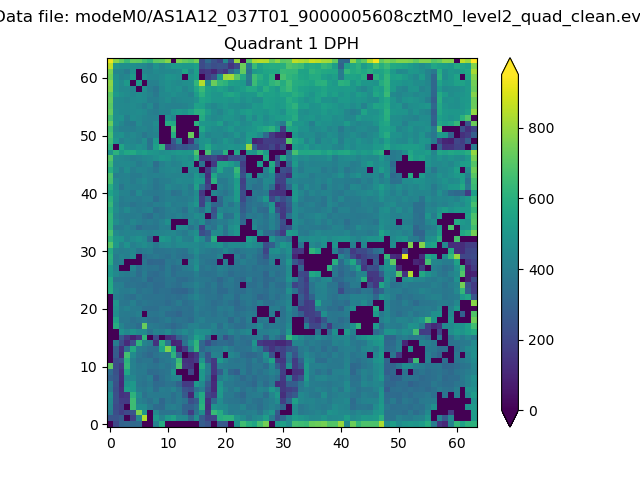 |
Quadrant B |
|---|---|---|---|
| Quadrant D | 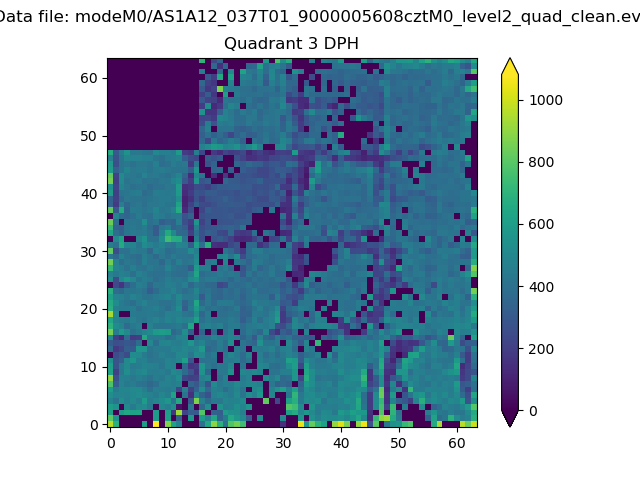 |
 |
Quadrant C |
| Plot type | Count rate plots | Images |
|---|---|---|
| Comparison with Poisson distribution Blue bars denote a histogram of data divided into 1 sec bins. Red curve is a Poisson curve with rate = median count rate of data. |
 |
 |
| Quadrant-wise count rates Data is divided into 100 sec bins |
 |
|
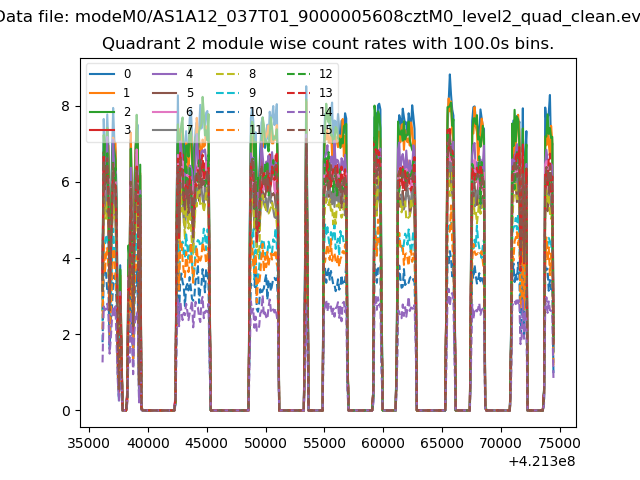
| Module-wise count rates for Quadrant A Data is divided into 100 sec bins |
 |
 |
| Module-wise count rates for Quadrant B Data is divided into 100 sec bins |
 |
 |
| Module-wise count rates for Quadrant C Data is divided into 100 sec bins |
 |
 |
| Module-wise count rates for Quadrant D Data is divided into 100 sec bins |
 |
 |
| Parameter | Plot |
|---|---|
| CZT HV Monitor | 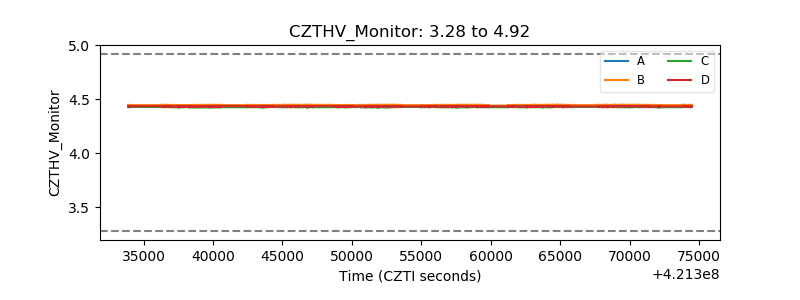 |
| D_VDD | 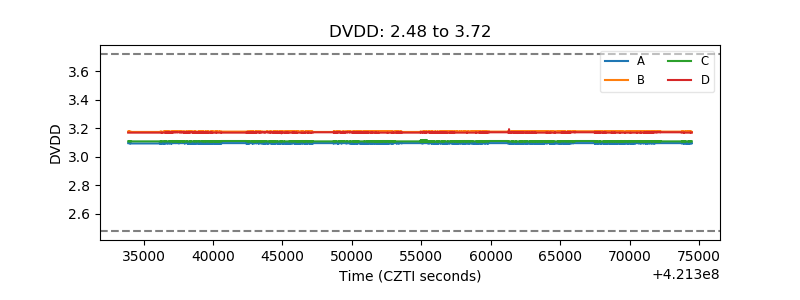 |
| Temperature 1 |  |
| Veto HV Monitor |  |
| Veto LLD |  |
| Alpha Counter |  |
| _CPM_Rate |  |
| CZT Counter |  |
| +2.5 Volts monitor |  |
| +5 Volts monitor | 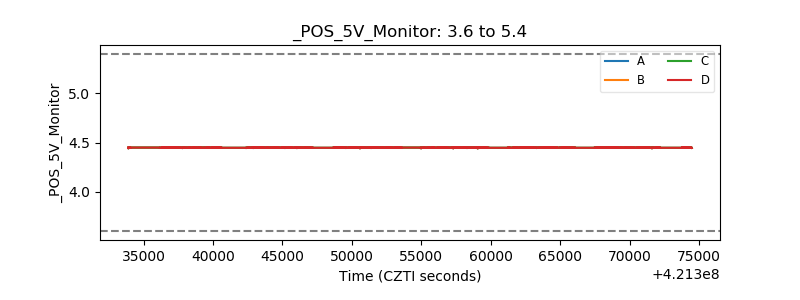 |
| _ROLL_ROT |  |
| _Roll_DEC |  |
| _Roll_RA |  |
| Veto Counter |  |