| Param | Original file | Final file |
|---|---|---|
| Filename | modeM0/AS1A12_101T01_9000005612cztM0_level2.fits | modeM0/AS1A12_101T01_9000005612cztM0_level2_quad_clean.evt |
| Size (bytes) | 321,546,240 | 292,487,040 |
| Size | 306.7 MB | 278.9 MB |
| Events in quadrant A | 1,987,334 | 1,758,906 |
| Events in quadrant B | 1,852,656 | 1,655,101 |
| Events in quadrant C | 1,694,020 | 1,386,743 |
| Events in quadrant D | 1,686,302 | 1,542,726 |
| Mode M9 | |||
|---|---|---|---|
| Quadrant | BADHDUFLAG | Total packets | Discarded packets |
| A | 0 | 137 | 0 |
| B | 0 | 137 | 0 |
| C | 0 | 137 | 0 |
| D | 0 | 137 | 0 |
| Mode M0 | |||
|---|---|---|---|
| Quadrant | BADHDUFLAG | Total packets | Discarded packets |
| A | 0 | 78906 | 0 |
| B | 0 | 86761 | 0 |
| C | 0 | 141624 | 0 |
| D | 0 | 83001 | 0 |
| Mode SS | |||
|---|---|---|---|
| Quadrant | BADHDUFLAG | Total packets | Discarded packets |
| A | 0 | 750 | 0 |
| B | 0 | 750 | 0 |
| C | 0 | 750 | 0 |
| D | 0 | 750 | 0 |
| Quadrant | Total seconds | Saturated seconds | Saturation percentage |
|---|---|---|---|
| A | 36583 | 64 | 0.174945% |
| B | 36583 | 1496 | 4.089331% |
| C | 36583 | 8175 | 22.346445% |
| D | 36583 | 758 | 2.072001% |
Noise dominated data is calculated using 1-second bins in cleaned event files. If a bin has >2000 counts, and if more than 50% of those come from <1% of pixels, then it is considered to be noise-dominated and hence unusable.
| Quadrant | # 1 sec bins | Bins with >0 counts | Bins with >2000 counts | High rate bins dominated by noise | Noise dominated (total time) | Noise dominated (detector-on time) | Marked lightcurve |
|---|---|---|---|---|---|---|---|
| A | 50387 | 36584 | 0 | 0 | 0.00% | 0.00% | 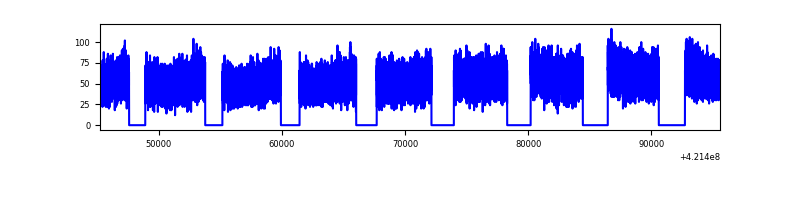 |
| B | 50387 | 36537 | 0 | 0 | 0.00% | 0.00% | 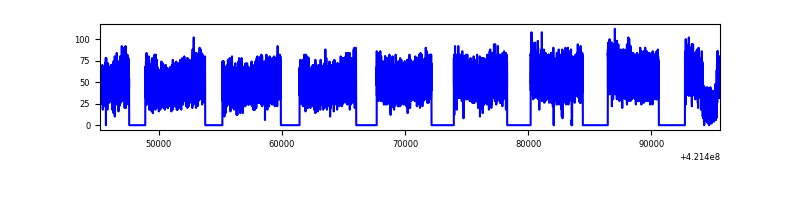 |
| C | 50387 | 36528 | 0 | 0 | 0.00% | 0.00% | 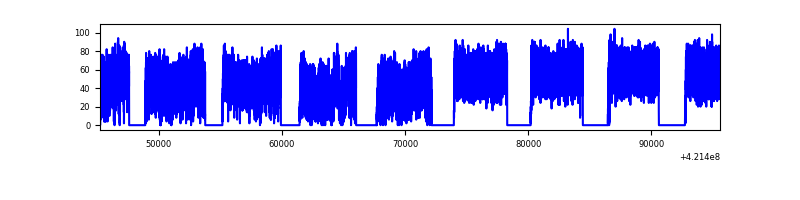 |
| D | 50387 | 36578 | 0 | 0 | 0.00% | 0.00% | 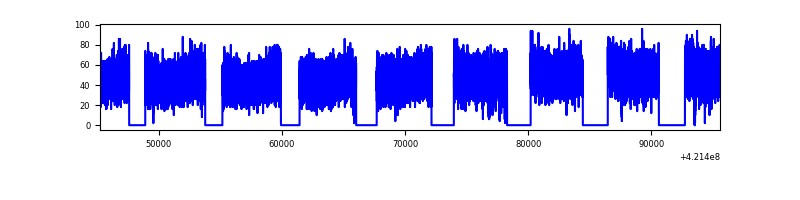 |
Top three noisy pixels from each quadrant. If the there are fewer than three noisy pixels in the level2.evt file, extra rows are filled as -1
| Pixel properties | Quadrant properties | ||||||
|---|---|---|---|---|---|---|---|
| Quadrant | DetID | PixID | Counts | Sigma | Mean | Median | Sigma |
| A | 9 | 19 | 1634 | 8.64 | 518 | 486 | 132.8 |
| A | 0 | 29 | 1611 | 8.47 | 518 | 486 | 132.8 |
| A | 7 | 110 | 1527 | 7.84 | 518 | 486 | 132.8 |
| B | 2 | 9 | 1620 | 11.8 | 489 | 468 | 97.6 |
| B | 2 | 8 | 1315 | 8.68 | 489 | 468 | 97.6 |
| B | 5 | 128 | 1290 | 8.42 | 489 | 468 | 97.6 |
| C | 3 | 203 | 1379 | 8.27 | 447 | 420 | 116.0 |
| C | 1 | 81 | 1332 | 7.86 | 447 | 420 | 116.0 |
| C | 3 | 202 | 1288 | 7.48 | 447 | 420 | 116.0 |
| D | 4 | 160 | 1259 | 6.25 | 481 | 437 | 131.6 |
| D | 7 | 3 | 1254 | 6.21 | 481 | 437 | 131.6 |
| D | 10 | 189 | 1251 | 6.19 | 481 | 437 | 131.6 |
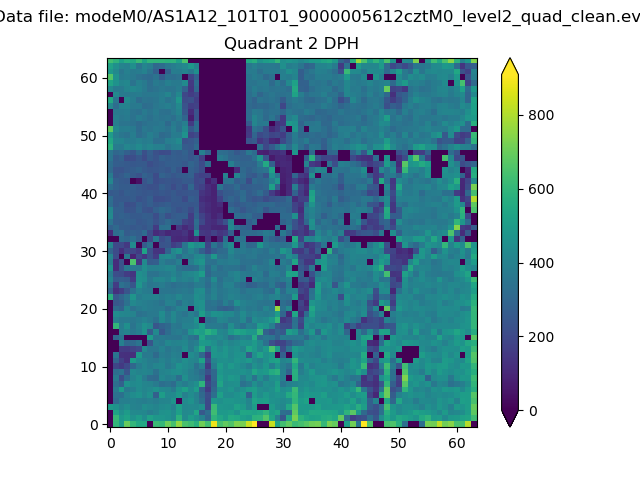
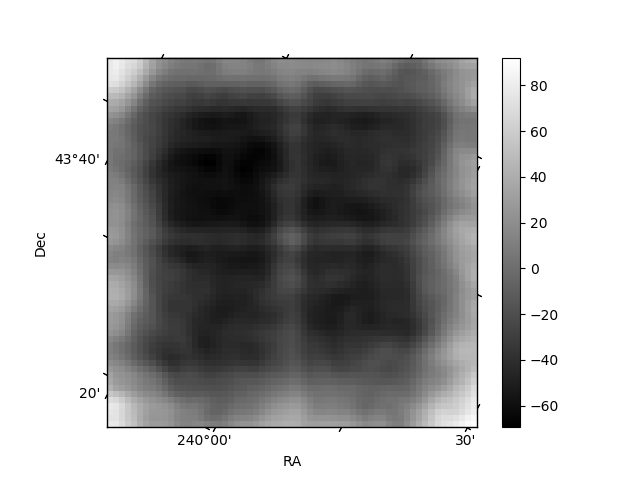
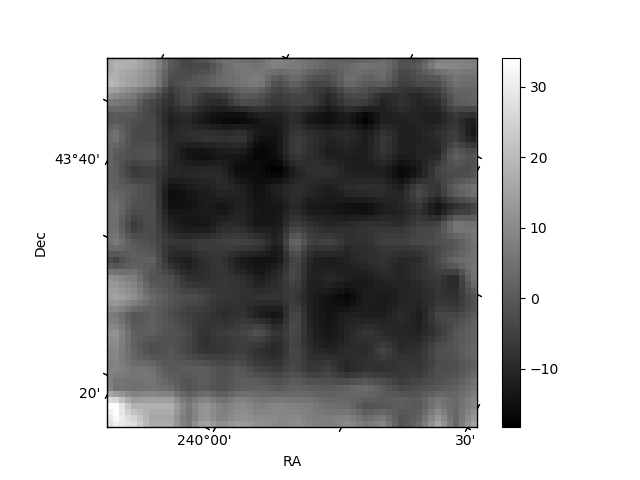
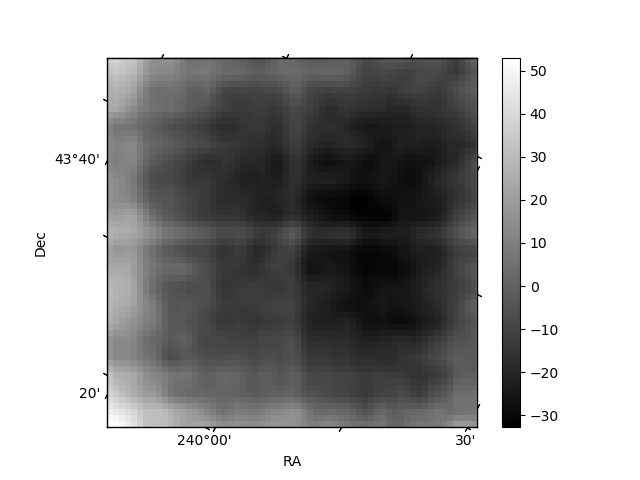
Histogram calculated using DETX and DETY for each event in the final _common_clean file
| Quadrant A | 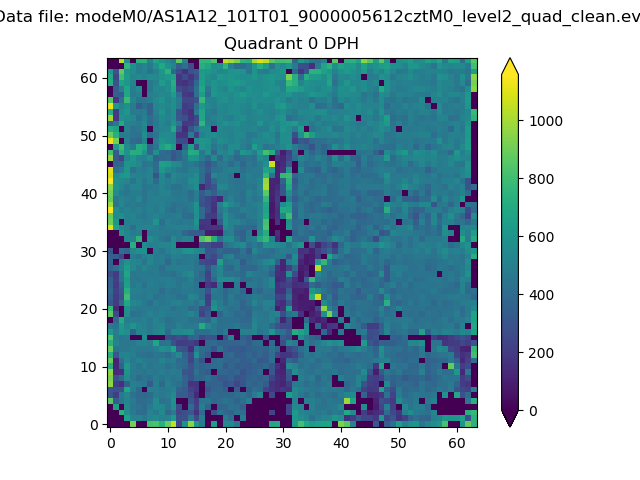 |
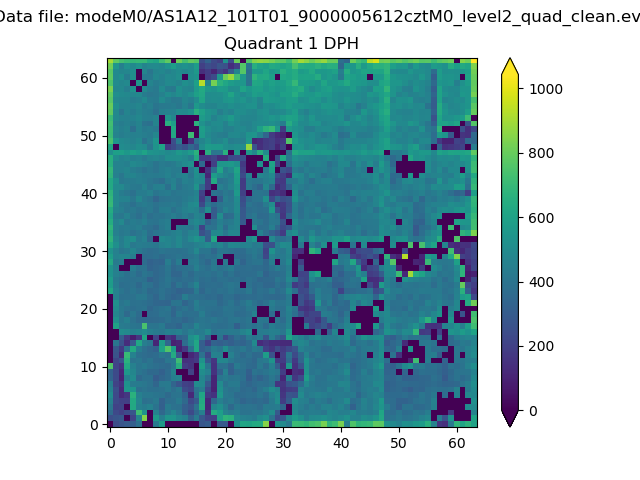 |
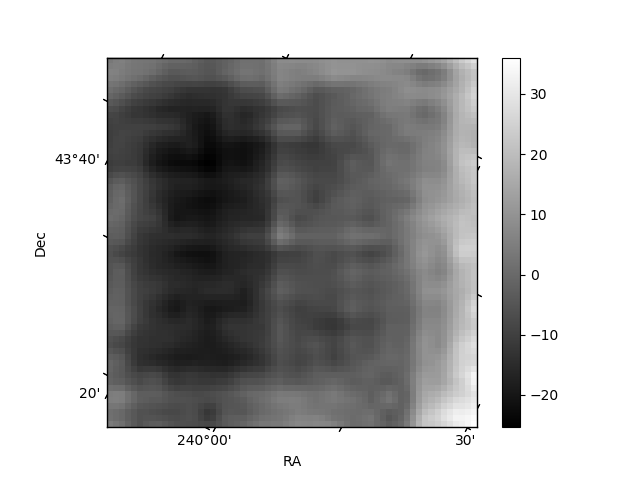
Quadrant B |
|---|---|---|---|
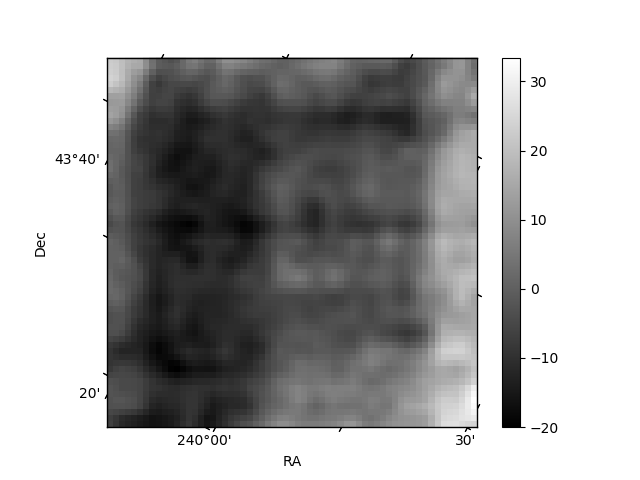
| Quadrant D | 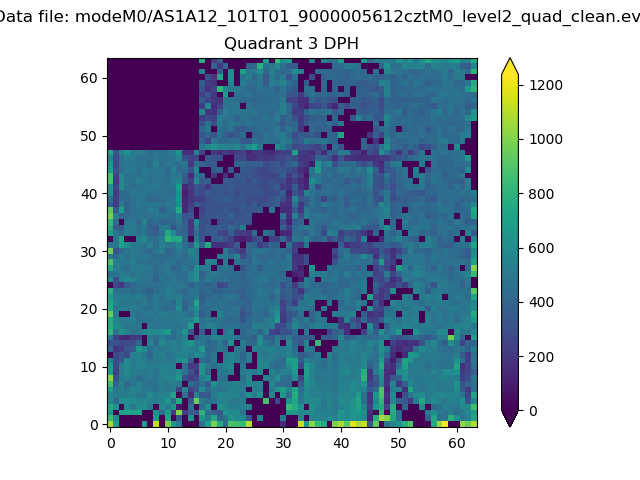 |
 |
Quadrant C |
| Plot type | Count rate plots | Images |
|---|---|---|
| Comparison with Poisson distribution Blue bars denote a histogram of data divided into 1 sec bins. Red curve is a Poisson curve with rate = median count rate of data. |
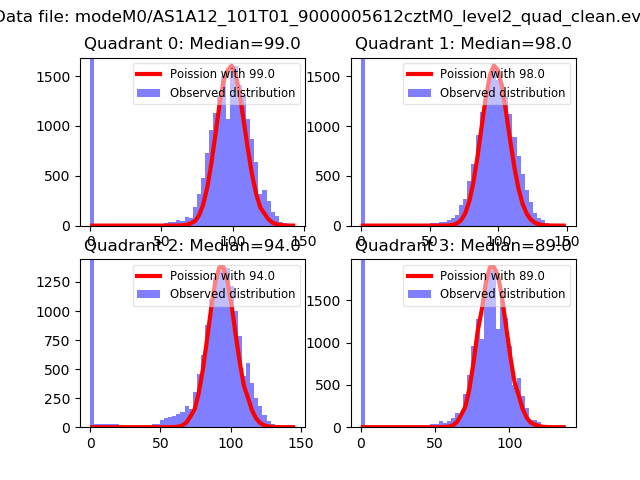 |
 |
| Quadrant-wise count rates Data is divided into 100 sec bins |
 |
|
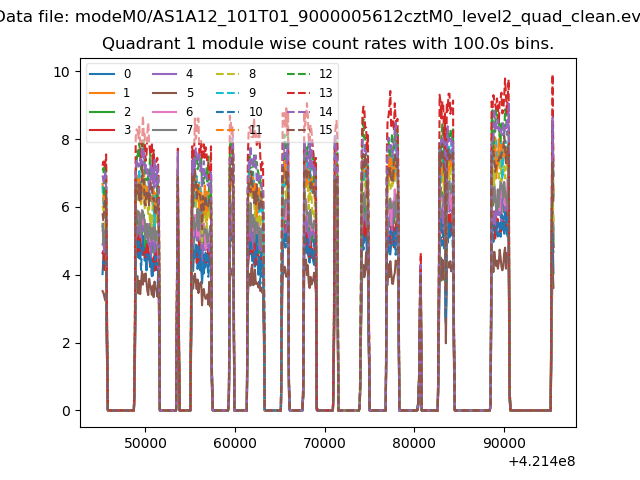
| Module-wise count rates for Quadrant A Data is divided into 100 sec bins |
 |
 |
| Module-wise count rates for Quadrant B Data is divided into 100 sec bins |
 |
 |
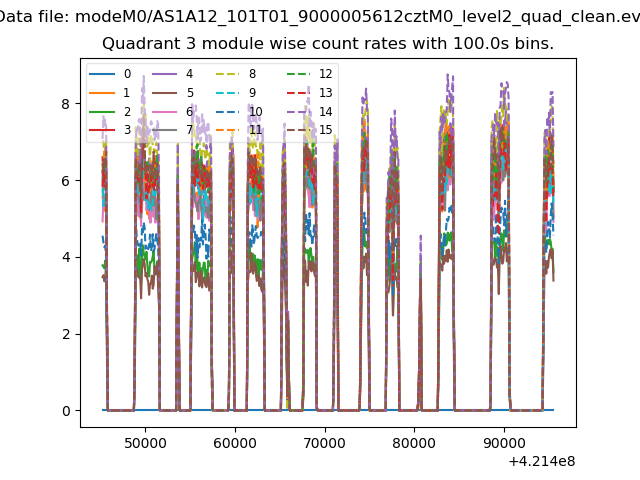
| Module-wise count rates for Quadrant C Data is divided into 100 sec bins |
 |
 |
| Module-wise count rates for Quadrant D Data is divided into 100 sec bins |
 |
 |
| Parameter | Plot |
|---|---|
| CZT HV Monitor |  |
| D_VDD | 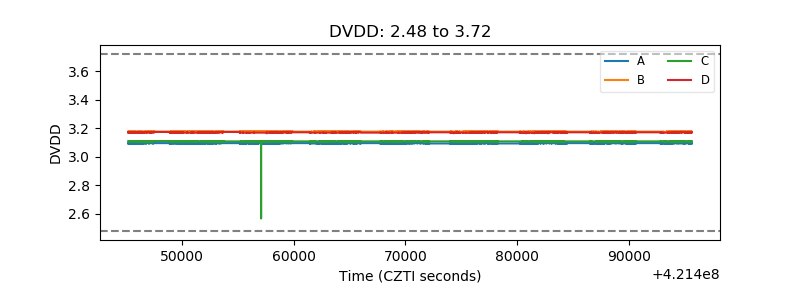 |
| Temperature 1 | 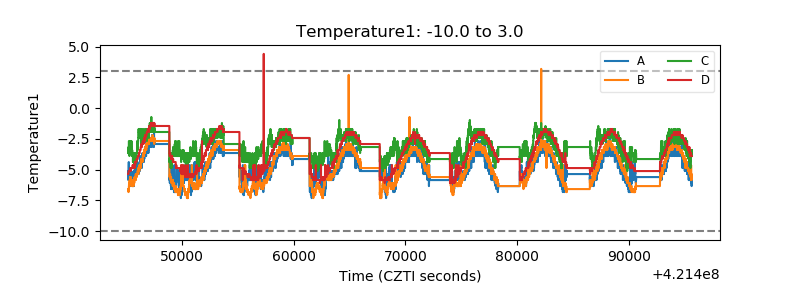 |
| Veto HV Monitor | 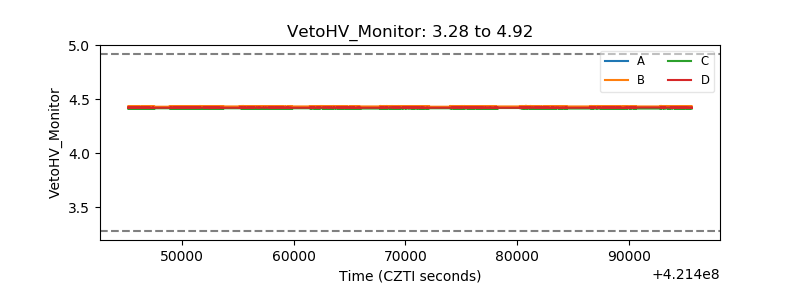 |
| Veto LLD | 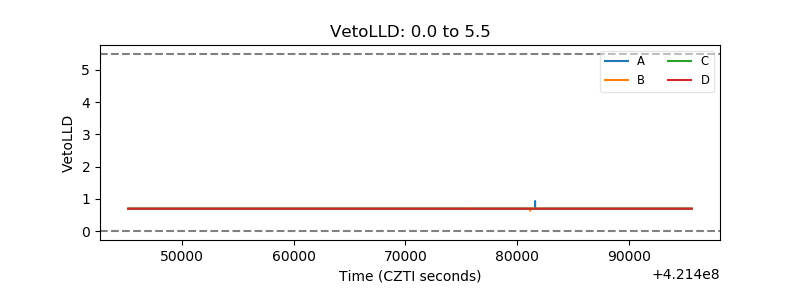 |
| Alpha Counter | 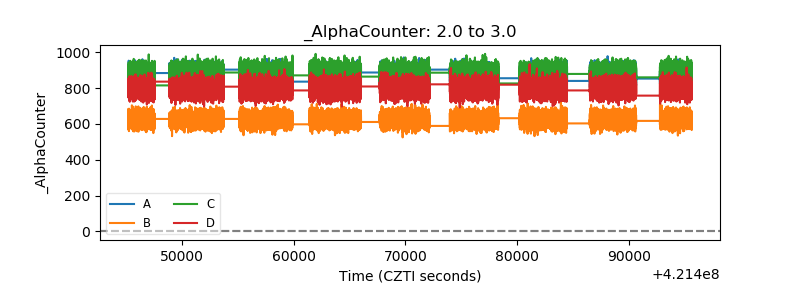 |
| _CPM_Rate | 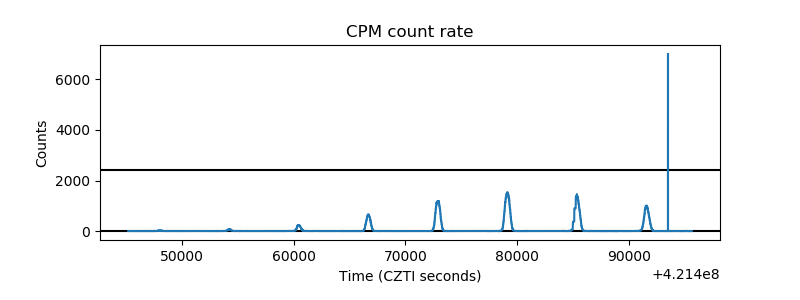 |
| CZT Counter | 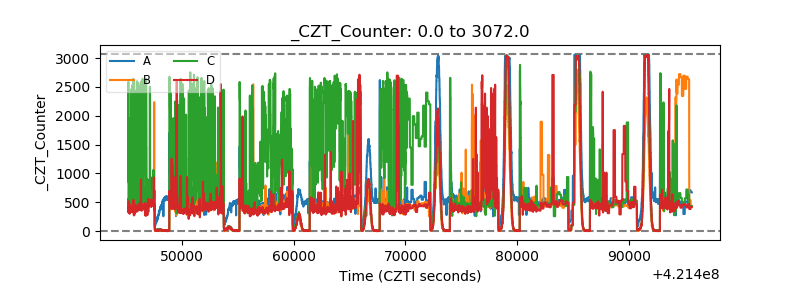 |
| +2.5 Volts monitor |  |
| +5 Volts monitor | 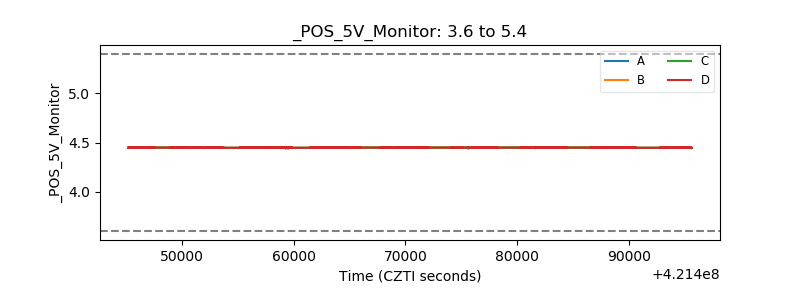 |
| _ROLL_ROT | 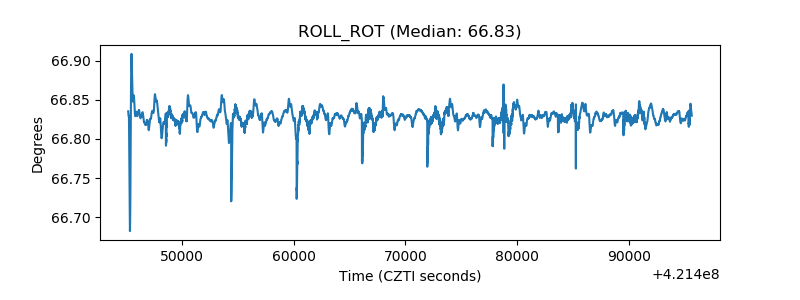 |
| _Roll_DEC | 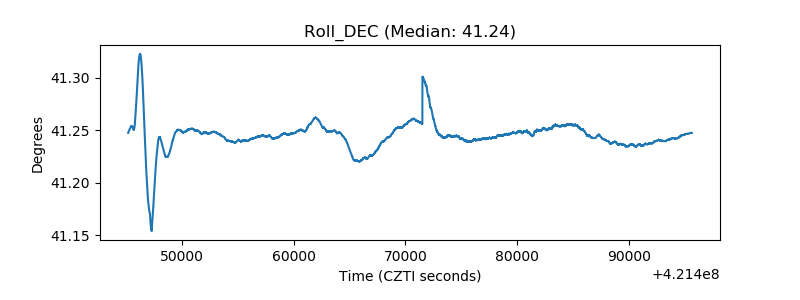 |
| _Roll_RA | 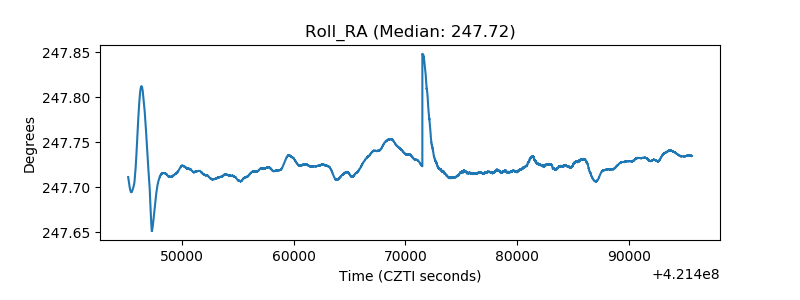 |
| Veto Counter | 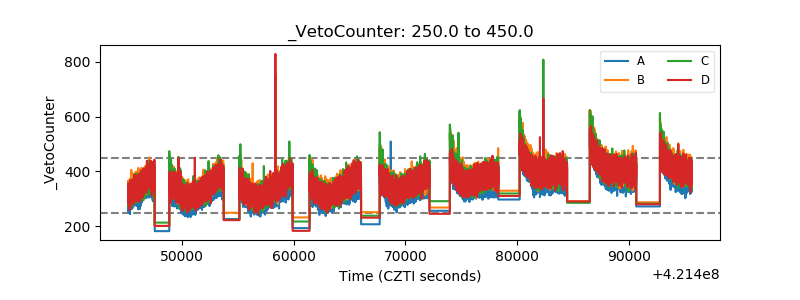 |