| Param | Original file | Final file |
|---|---|---|
| Filename | modeM0/AS1A12_101T04_9000005610cztM0_level2.fits | modeM0/AS1A12_101T04_9000005610cztM0_level2_quad_clean.evt |
| Size (bytes) | 428,751,360 | 395,046,720 |
| Size | 408.9 MB | 376.7 MB |
| Events in quadrant A | 2,695,874 | 2,422,566 |
| Events in quadrant B | 2,454,430 | 2,333,316 |
| Events in quadrant C | 2,241,984 | 1,814,755 |
| Events in quadrant D | 2,232,552 | 2,040,123 |
| Mode M0 | |||
|---|---|---|---|
| Quadrant | BADHDUFLAG | Total packets | Discarded packets |
| A | 0 | 105782 | 0 |
| B | 0 | 137898 | 0 |
| C | 0 | 193735 | 0 |
| D | 0 | 127021 | 0 |
| Mode SS | |||
|---|---|---|---|
| Quadrant | BADHDUFLAG | Total packets | Discarded packets |
| A | 0 | 996 | 0 |
| B | 0 | 996 | 0 |
| C | 0 | 996 | 0 |
| D | 0 | 996 | 0 |
| Mode M9 | |||
|---|---|---|---|
| Quadrant | BADHDUFLAG | Total packets | Discarded packets |
| A | 0 | 198 | 0 |
| B | 0 | 198 | 0 |
| C | 0 | 198 | 0 |
| D | 0 | 198 | 0 |
| Quadrant | Total seconds | Saturated seconds | Saturation percentage |
|---|---|---|---|
| A | 48850 | 90 | 0.184237% |
| B | 48849 | 3944 | 8.073860% |
| C | 48850 | 12127 | 24.824974% |
| D | 48850 | 2225 | 4.554759% |
Noise dominated data is calculated using 1-second bins in cleaned event files. If a bin has >2000 counts, and if more than 50% of those come from <1% of pixels, then it is considered to be noise-dominated and hence unusable.
| Quadrant | # 1 sec bins | Bins with >0 counts | Bins with >2000 counts | High rate bins dominated by noise | Noise dominated (total time) | Noise dominated (detector-on time) | Marked lightcurve |
|---|---|---|---|---|---|---|---|
| A | 68542 | 48851 | 0 | 0 | 0.00% | 0.00% | 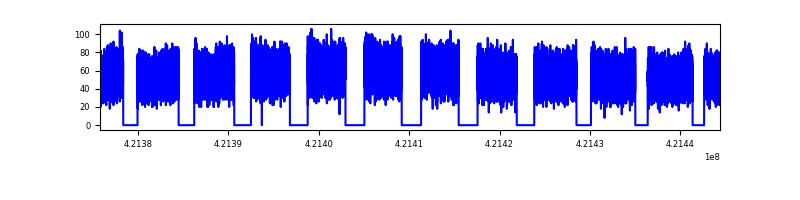 |
| B | 68542 | 48826 | 0 | 0 | 0.00% | 0.00% |  |
| C | 68542 | 48724 | 0 | 0 | 0.00% | 0.00% | 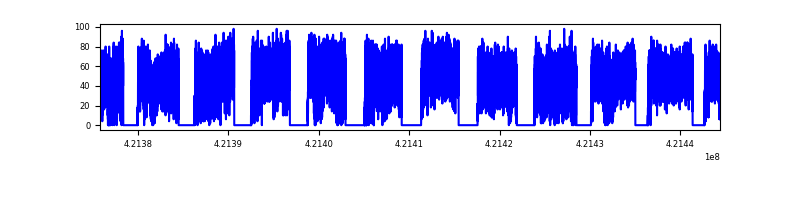 |
| D | 68542 | 48802 | 0 | 0 | 0.00% | 0.00% | 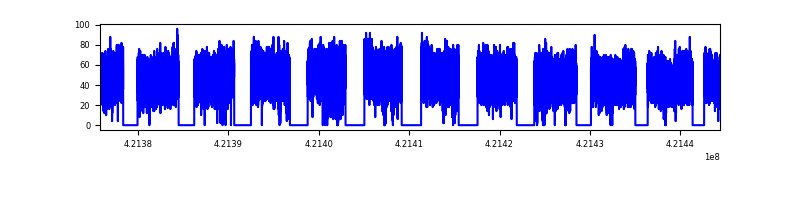 |
Top three noisy pixels from each quadrant. If the there are fewer than three noisy pixels in the level2.evt file, extra rows are filled as -1
| Pixel properties | Quadrant properties | ||||||
|---|---|---|---|---|---|---|---|
| Quadrant | DetID | PixID | Counts | Sigma | Mean | Median | Sigma |
| A | 0 | 29 | 2234 | 8.84 | 704 | 659 | 178.2 |
| A | 7 | 110 | 2215 | 8.73 | 704 | 659 | 178.2 |
| A | 9 | 19 | 2171 | 8.48 | 704 | 659 | 178.2 |
| B | 2 | 9 | 2140 | 11.7 | 650 | 621 | 129.8 |
| B | 3 | 80 | 1807 | 9.14 | 650 | 621 | 129.8 |
| B | 2 | 8 | 1707 | 8.37 | 650 | 621 | 129.8 |
| C | 1 | 81 | 1831 | 8.32 | 593 | 555 | 153.4 |
| C | 1 | 80 | 1801 | 8.12 | 593 | 555 | 153.4 |
| C | 1 | 65 | 1498 | 6.15 | 593 | 555 | 153.4 |
| D | 4 | 160 | 1639 | 6.12 | 638 | 582 | 172.6 |
| D | 10 | 189 | 1625 | 6.04 | 638 | 582 | 172.6 |
| D | 6 | 62 | 1616 | 5.99 | 638 | 582 | 172.6 |
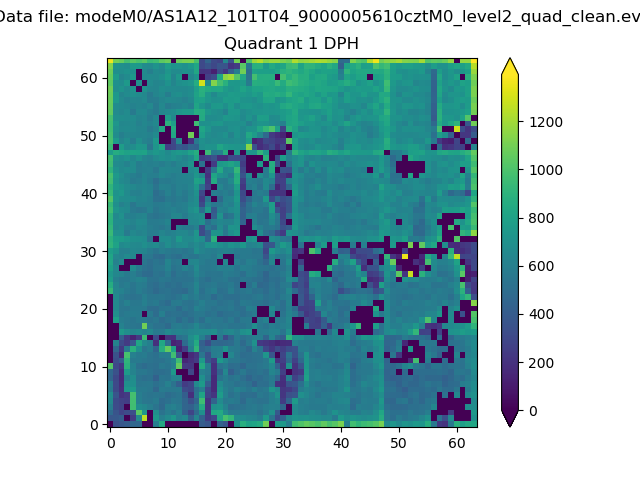
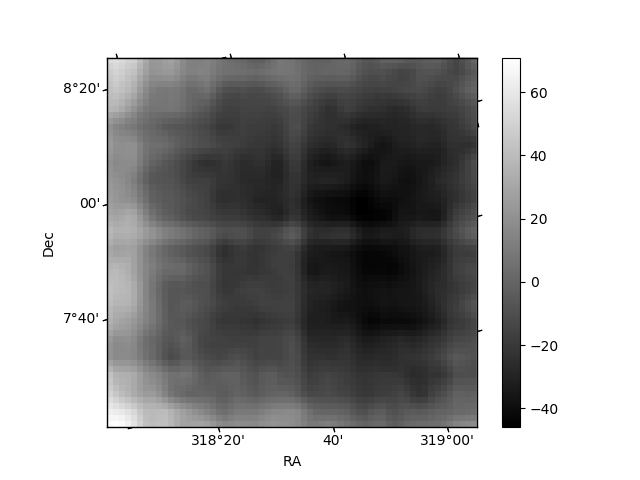
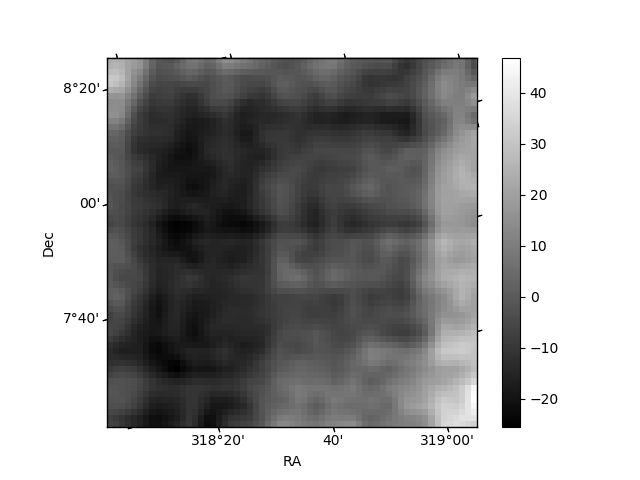
Histogram calculated using DETX and DETY for each event in the final _common_clean file
| Quadrant A | 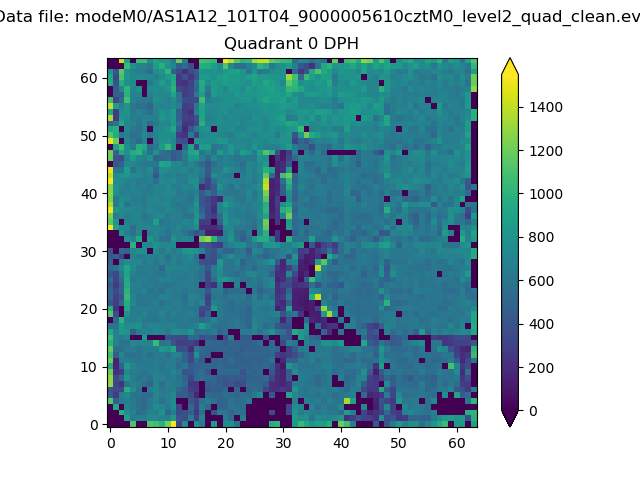 |
 |
Quadrant B |
|---|---|---|---|
| Quadrant D | 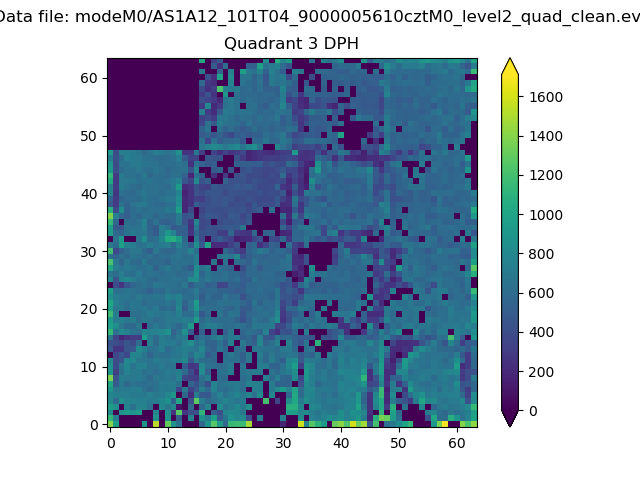 |
 |
Quadrant C |
| Plot type | Count rate plots | Images |
|---|---|---|
| Comparison with Poisson distribution Blue bars denote a histogram of data divided into 1 sec bins. Red curve is a Poisson curve with rate = median count rate of data. |
 |
 |
| Quadrant-wise count rates Data is divided into 100 sec bins |
 |
|
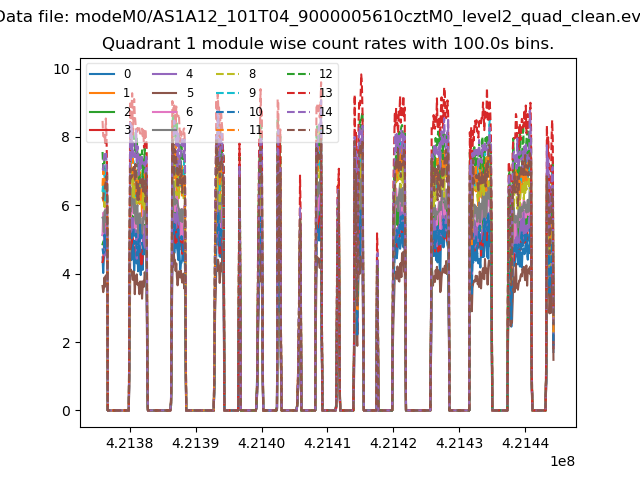
| Module-wise count rates for Quadrant A Data is divided into 100 sec bins |
 |
 |
| Module-wise count rates for Quadrant B Data is divided into 100 sec bins |
 |
 |
| Module-wise count rates for Quadrant C Data is divided into 100 sec bins |
 |
 |
| Module-wise count rates for Quadrant D Data is divided into 100 sec bins |
 |
 |
| Parameter | Plot |
|---|---|
| CZT HV Monitor | 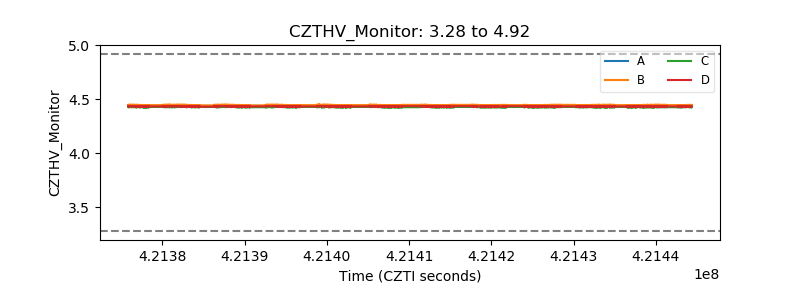 |
| D_VDD | 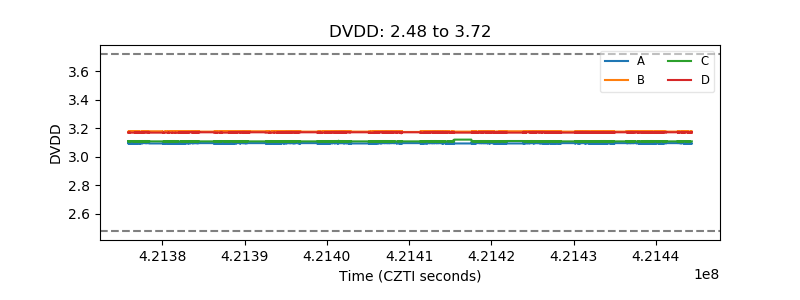 |
| Temperature 1 | 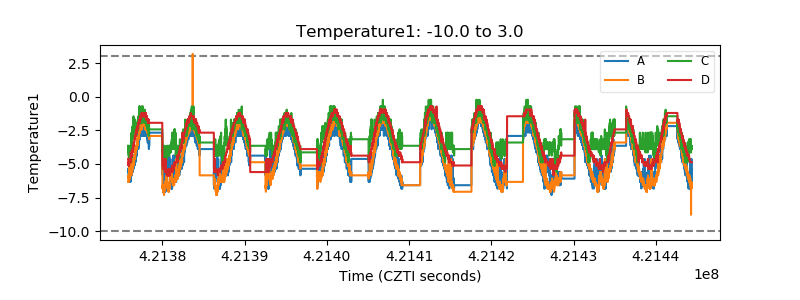 |
| Veto HV Monitor | 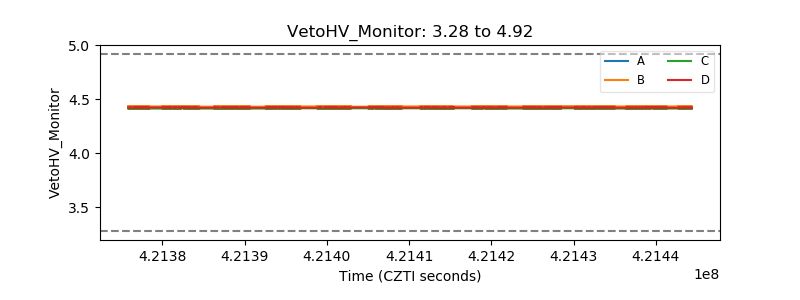 |
| Veto LLD | 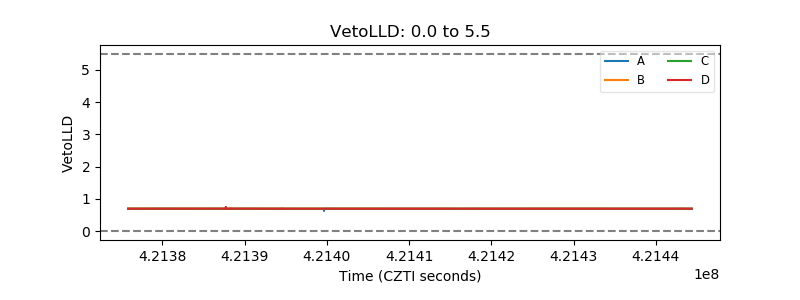 |
| Alpha Counter |  |
| _CPM_Rate |  |
| CZT Counter |  |
| +2.5 Volts monitor |  |
| +5 Volts monitor | 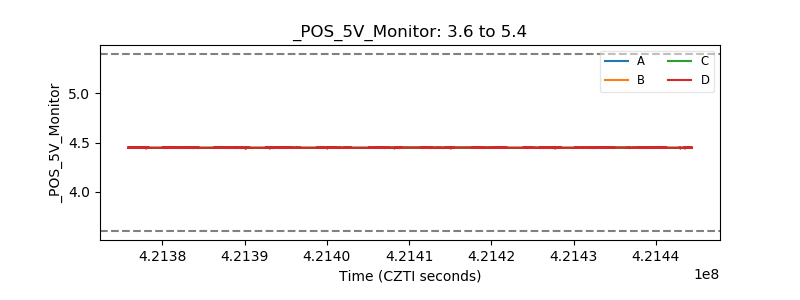 |
| _ROLL_ROT |  |
| _Roll_DEC | 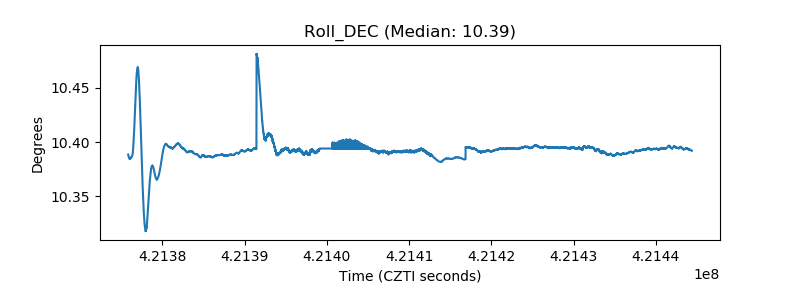 |
| _Roll_RA |  |
| Veto Counter | 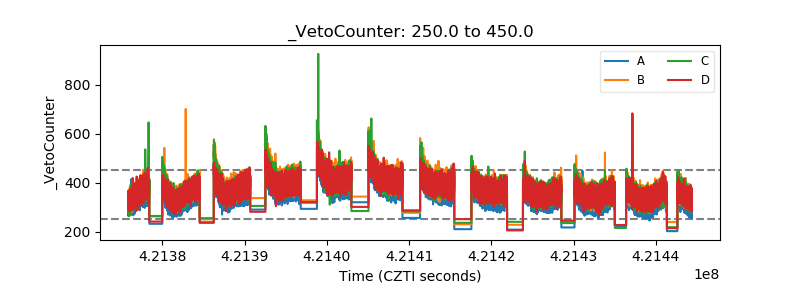 |