| Param | Original file | Final file |
|---|---|---|
| Filename | modeM0/AS1A12_089T10_9000005614cztM0_level2.fits | modeM0/AS1A12_089T10_9000005614cztM0_level2_quad_clean.evt |
| Size (bytes) | 40,720,320 | 43,712,640 |
| Size | 38.8 MB | 41.7 MB |
| Events in quadrant A | 247,048 | 271,377 |
| Events in quadrant B | 234,836 | 267,901 |
| Events in quadrant C | 227,354 | 231,358 |
| Events in quadrant D | 211,788 | 240,106 |
| Mode SS | |||
|---|---|---|---|
| Quadrant | BADHDUFLAG | Total packets | Discarded packets |
| A | 0 | 92 | 0 |
| B | 0 | 92 | 0 |
| C | 0 | 92 | 0 |
| D | 0 | 92 | 0 |
| Mode M0 | |||
|---|---|---|---|
| Quadrant | BADHDUFLAG | Total packets | Discarded packets |
| A | 0 | 9497 | 0 |
| B | 0 | 10088 | 0 |
| C | 0 | 14055 | 0 |
| D | 0 | 9637 | 0 |
| Mode M9 | |||
|---|---|---|---|
| Quadrant | BADHDUFLAG | Total packets | Discarded packets |
| A | 0 | 24 | 0 |
| B | 0 | 24 | 0 |
| C | 0 | 24 | 0 |
| D | 0 | 24 | 0 |
| Quadrant | Total seconds | Saturated seconds | Saturation percentage |
|---|---|---|---|
| A | 4442 | 9 | 0.202611% |
| B | 4442 | 68 | 1.530842% |
| C | 4442 | 492 | 11.076092% |
| D | 4442 | 52 | 1.170644% |
Noise dominated data is calculated using 1-second bins in cleaned event files. If a bin has >2000 counts, and if more than 50% of those come from <1% of pixels, then it is considered to be noise-dominated and hence unusable.
| Quadrant | # 1 sec bins | Bins with >0 counts | Bins with >2000 counts | High rate bins dominated by noise | Noise dominated (total time) | Noise dominated (detector-on time) | Marked lightcurve |
|---|---|---|---|---|---|---|---|
| A | 6565 | 4442 | 0 | 0 | 0.00% | 0.00% | 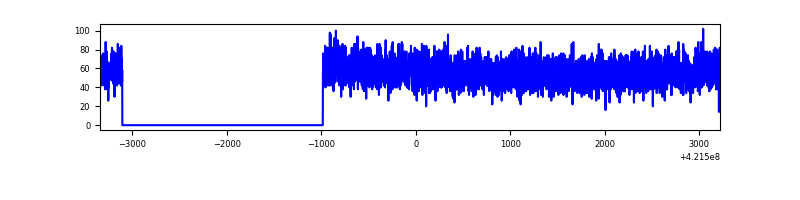 |
| B | 6565 | 4442 | 0 | 0 | 0.00% | 0.00% |  |
| C | 6564 | 4436 | 0 | 0 | 0.00% | 0.00% |  |
| D | 6565 | 4435 | 0 | 0 | 0.00% | 0.00% |  |
Top three noisy pixels from each quadrant. If the there are fewer than three noisy pixels in the level2.evt file, extra rows are filled as -1
| Pixel properties | Quadrant properties | ||||||
|---|---|---|---|---|---|---|---|
| Quadrant | DetID | PixID | Counts | Sigma | Mean | Median | Sigma |
| A | 0 | 29 | 211 | 8.33 | 64 | 60 | 18.1 |
| A | 9 | 19 | 205 | 8.0 | 64 | 60 | 18.1 |
| A | 7 | 110 | 193 | 7.34 | 64 | 60 | 18.1 |
| B | 2 | 9 | 202 | 9.9 | 62 | 59 | 14.5 |
| B | 3 | 17 | 175 | 8.03 | 62 | 59 | 14.5 |
| B | 5 | 128 | 168 | 7.54 | 62 | 59 | 14.5 |
| C | 1 | 81 | 184 | 7.34 | 60 | 56 | 17.4 |
| C | 1 | 80 | 170 | 6.54 | 60 | 56 | 17.4 |
| C | 3 | 158 | 166 | 6.31 | 60 | 56 | 17.4 |
| D | 4 | 160 | 176 | 6.78 | 60 | 55 | 17.9 |
| D | 7 | 3 | 167 | 6.27 | 60 | 55 | 17.9 |
| D | 13 | 238 | 159 | 5.83 | 60 | 55 | 17.9 |
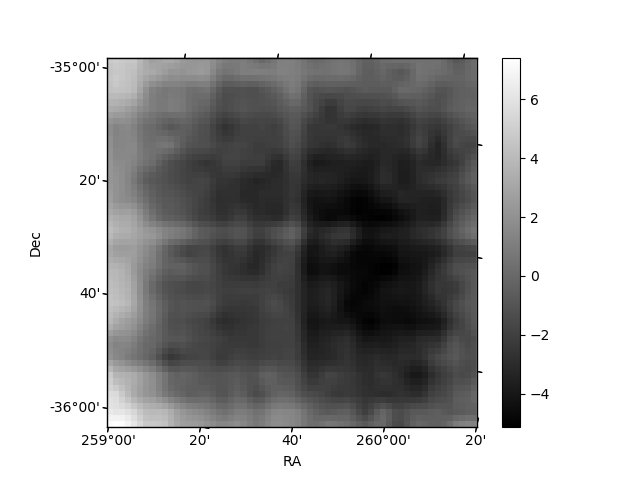
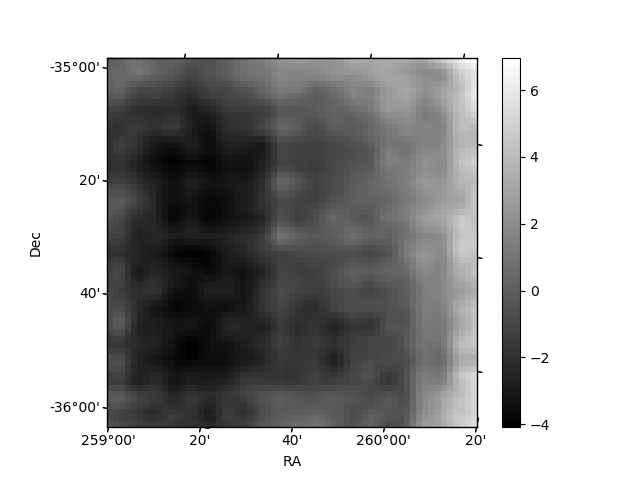
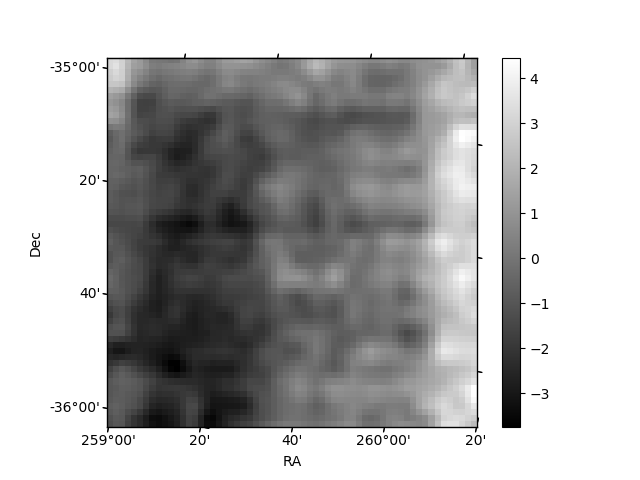
Histogram calculated using DETX and DETY for each event in the final _common_clean file
| Quadrant A | 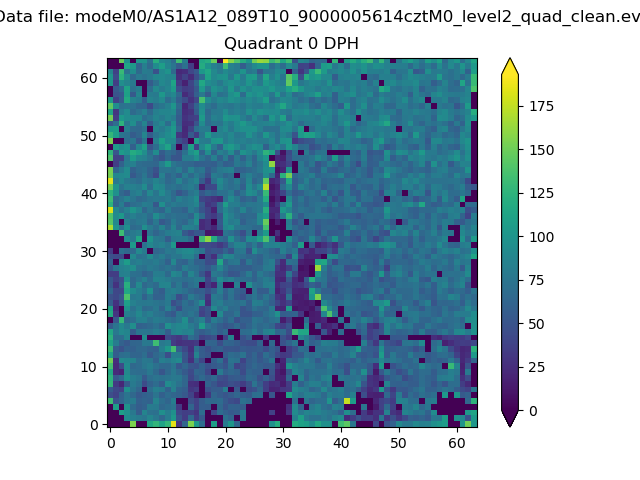 |
 |
Quadrant B |
|---|---|---|---|
| Quadrant D |  |
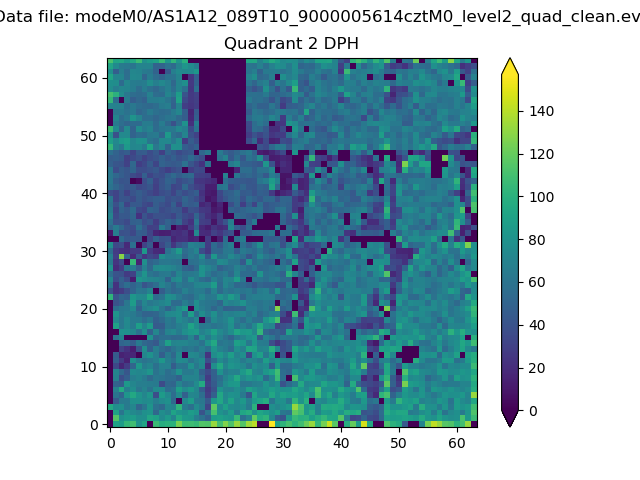 |
Quadrant C |
| Plot type | Count rate plots | Images |
|---|---|---|
| Comparison with Poisson distribution Blue bars denote a histogram of data divided into 1 sec bins. Red curve is a Poisson curve with rate = median count rate of data. |
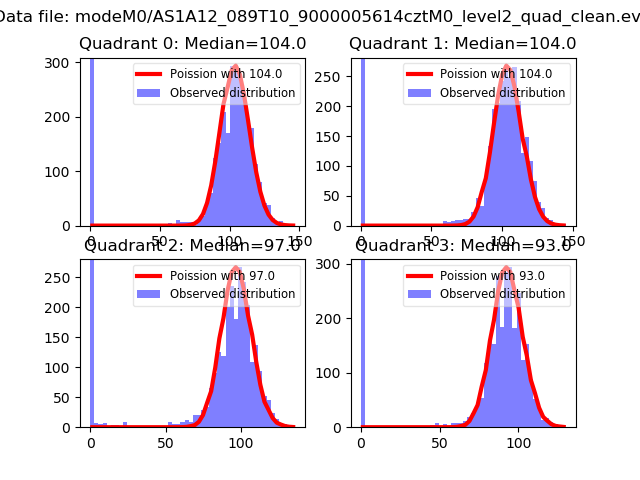 |
 |
| Quadrant-wise count rates Data is divided into 100 sec bins |
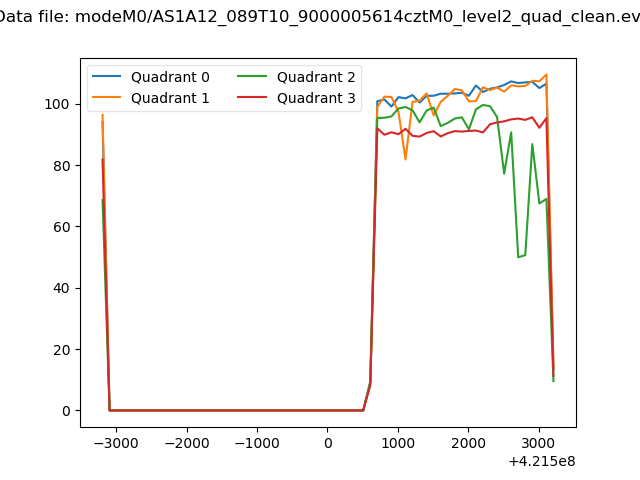 |
|
| Module-wise count rates for Quadrant A Data is divided into 100 sec bins |
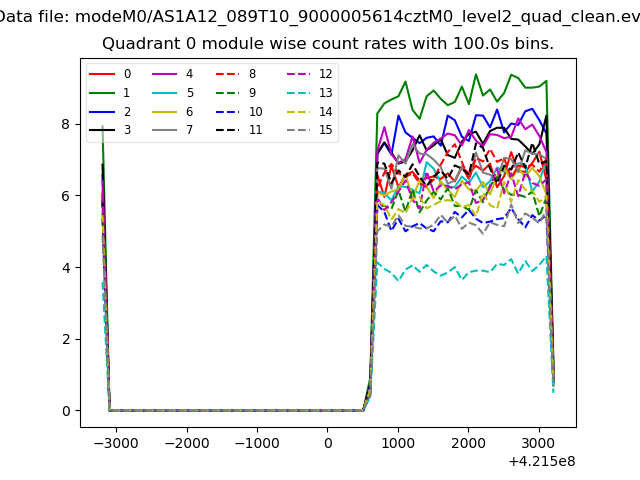 |
 |
| Module-wise count rates for Quadrant B Data is divided into 100 sec bins |
 |
 |
| Module-wise count rates for Quadrant C Data is divided into 100 sec bins |
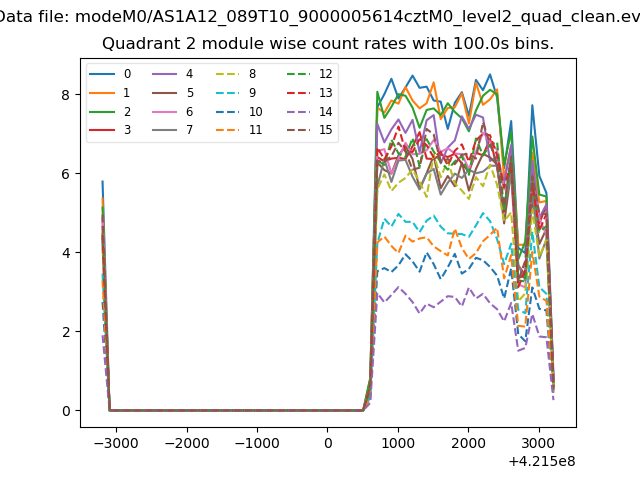 |
 |
| Module-wise count rates for Quadrant D Data is divided into 100 sec bins |
 |
 |
| Parameter | Plot |
|---|---|
| CZT HV Monitor |  |
| D_VDD |  |
| Temperature 1 | 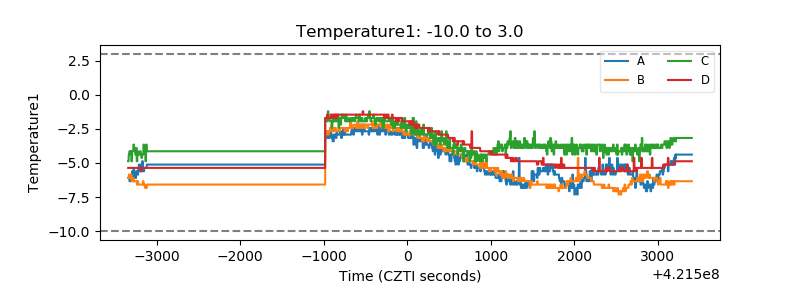 |
| Veto HV Monitor | 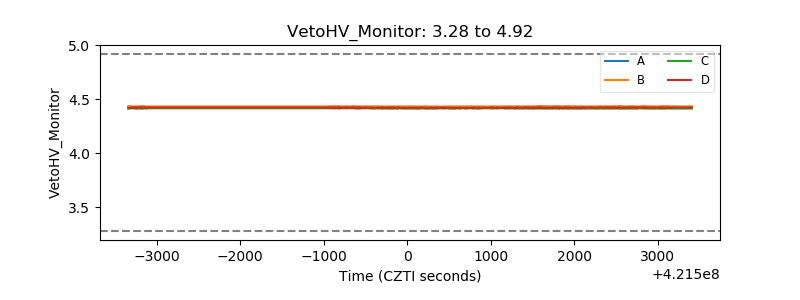 |
| Veto LLD |  |
| Alpha Counter |  |
| _CPM_Rate |  |
| CZT Counter | 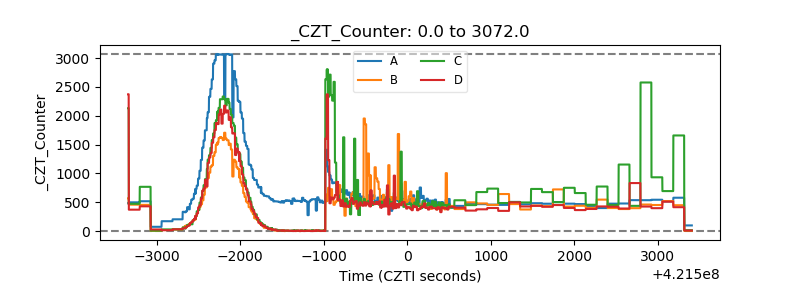 |
| +2.5 Volts monitor |  |
| +5 Volts monitor | 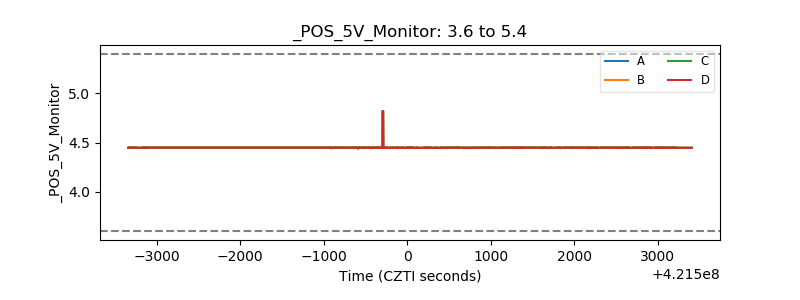 |
| _ROLL_ROT | 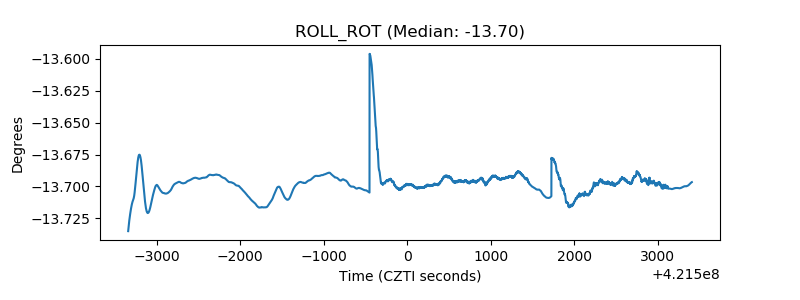 |
| _Roll_DEC | 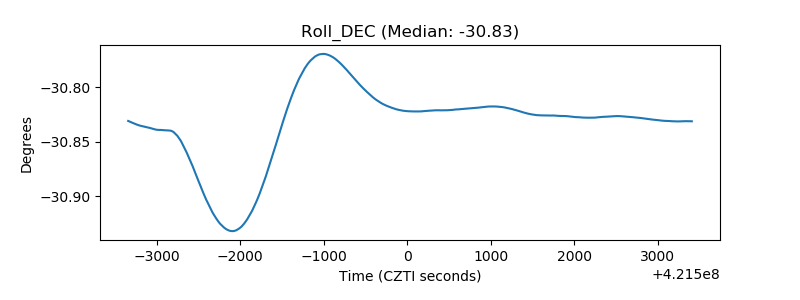 |
| _Roll_RA |  |
| Veto Counter |  |