| Param | Original file | Final file |
|---|---|---|
| Filename | modeM0/AS1A12_101T02_9000005622cztM0_level2.fits | modeM0/AS1A12_101T02_9000005622cztM0_level2_quad_clean.evt |
| Size (bytes) | 312,039,360 | 338,659,200 |
| Size | 297.6 MB | 323.0 MB |
| Events in quadrant A | 1,900,130 | 2,119,623 |
| Events in quadrant B | 1,796,006 | 2,061,834 |
| Events in quadrant C | 1,799,916 | 1,953,992 |
| Events in quadrant D | 1,590,152 | 1,757,761 |
| Mode M9 | |||
|---|---|---|---|
| Quadrant | BADHDUFLAG | Total packets | Discarded packets |
| A | 0 | 150 | 0 |
| B | 0 | 150 | 0 |
| C | 0 | 150 | 0 |
| D | 0 | 150 | 0 |
| Mode M0 | |||
|---|---|---|---|
| Quadrant | BADHDUFLAG | Total packets | Discarded packets |
| A | 0 | 74092 | 0 |
| B | 0 | 79228 | 0 |
| C | 0 | 80448 | 0 |
| D | 0 | 84557 | 0 |
| Mode SS | |||
|---|---|---|---|
| Quadrant | BADHDUFLAG | Total packets | Discarded packets |
| A | 0 | 704 | 0 |
| B | 0 | 704 | 0 |
| C | 0 | 704 | 0 |
| D | 0 | 704 | 0 |
| Quadrant | Total seconds | Saturated seconds | Saturation percentage |
|---|---|---|---|
| A | 34397 | 49 | 0.142454% |
| B | 34397 | 909 | 2.642672% |
| C | 34397 | 1250 | 3.634038% |
| D | 34397 | 1086 | 3.157252% |
Noise dominated data is calculated using 1-second bins in cleaned event files. If a bin has >2000 counts, and if more than 50% of those come from <1% of pixels, then it is considered to be noise-dominated and hence unusable.
| Quadrant | # 1 sec bins | Bins with >0 counts | Bins with >2000 counts | High rate bins dominated by noise | Noise dominated (total time) | Noise dominated (detector-on time) | Marked lightcurve |
|---|---|---|---|---|---|---|---|
| A | 49400 | 34397 | 0 | 0 | 0.00% | 0.00% |  |
| B | 49400 | 34375 | 0 | 0 | 0.00% | 0.00% |  |
| C | 49400 | 34323 | 0 | 0 | 0.00% | 0.00% | 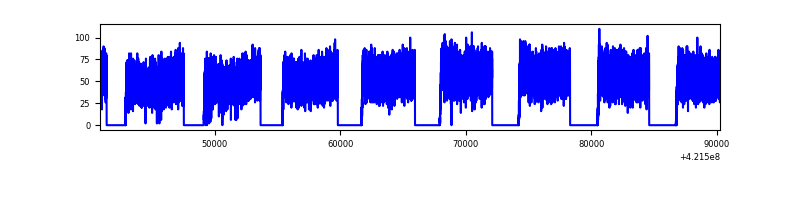 |
| D | 49400 | 34361 | 0 | 0 | 0.00% | 0.00% | 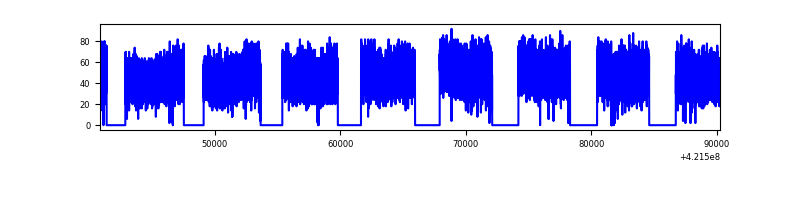 |
Top three noisy pixels from each quadrant. If the there are fewer than three noisy pixels in the level2.evt file, extra rows are filled as -1
| Pixel properties | Quadrant properties | ||||||
|---|---|---|---|---|---|---|---|
| Quadrant | DetID | PixID | Counts | Sigma | Mean | Median | Sigma |
| A | 7 | 110 | 1657 | 9.56 | 496 | 468 | 124.4 |
| A | 9 | 19 | 1538 | 8.6 | 496 | 468 | 124.4 |
| A | 0 | 29 | 1490 | 8.22 | 496 | 468 | 124.4 |
| B | 2 | 9 | 1592 | 12.1 | 474 | 454 | 94.1 |
| B | 3 | 80 | 1267 | 8.64 | 474 | 454 | 94.1 |
| B | 2 | 8 | 1264 | 8.61 | 474 | 454 | 94.1 |
| C | 3 | 203 | 1443 | 8.26 | 474 | 445 | 120.8 |
| C | 1 | 81 | 1439 | 8.23 | 474 | 445 | 120.8 |
| C | 3 | 202 | 1407 | 7.96 | 474 | 445 | 120.8 |
| D | 10 | 189 | 1241 | 6.73 | 455 | 416 | 122.6 |
| D | 4 | 160 | 1187 | 6.29 | 455 | 416 | 122.6 |
| D | 7 | 3 | 1176 | 6.2 | 455 | 416 | 122.6 |
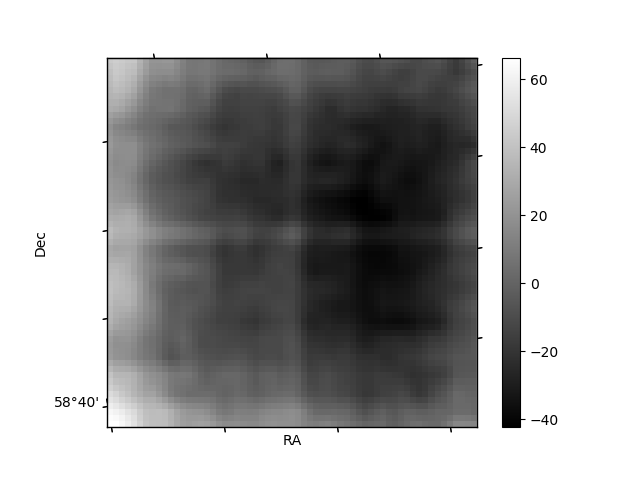
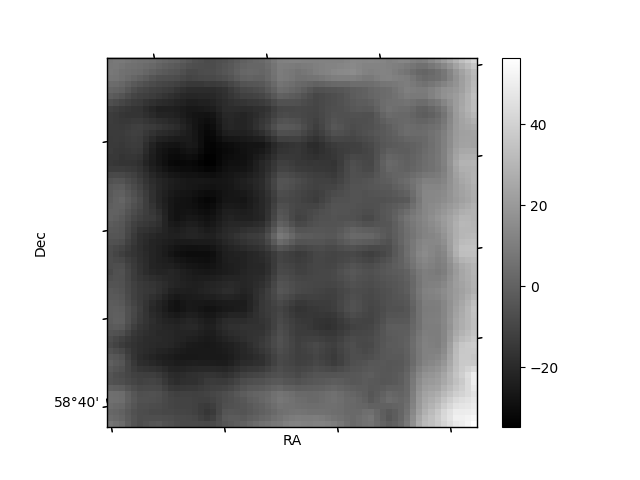
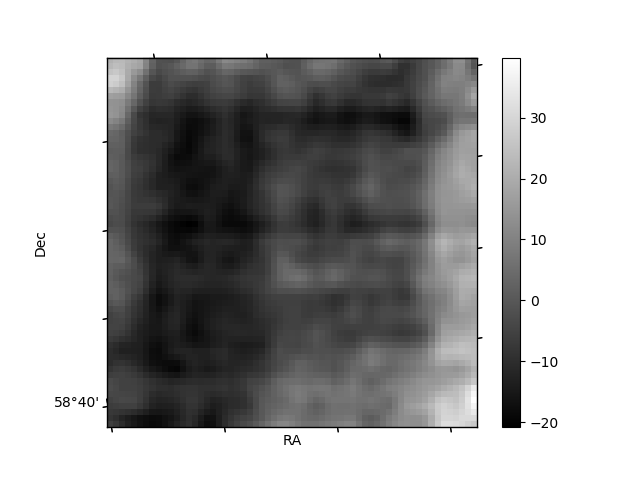
Histogram calculated using DETX and DETY for each event in the final _common_clean file
| Quadrant A | 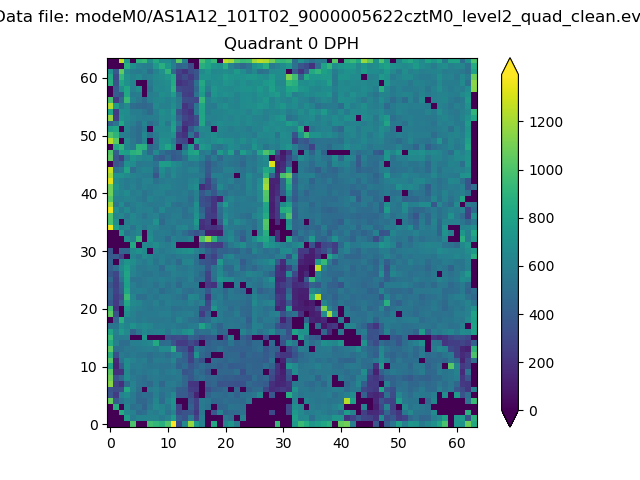 |
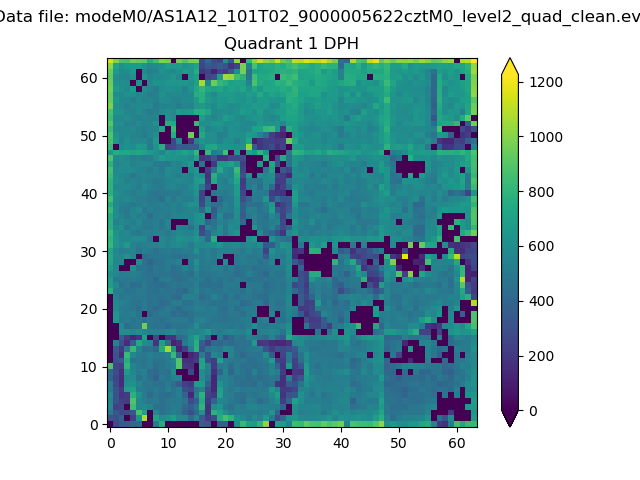 |
Quadrant B |
|---|---|---|---|
| Quadrant D | 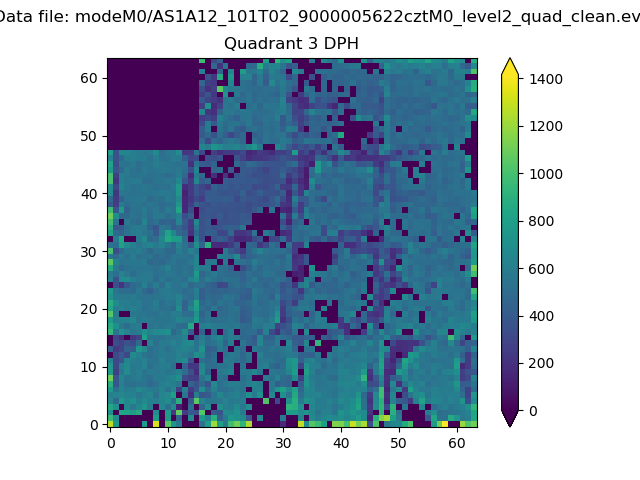 |
 |
Quadrant C |
| Plot type | Count rate plots | Images |
|---|---|---|
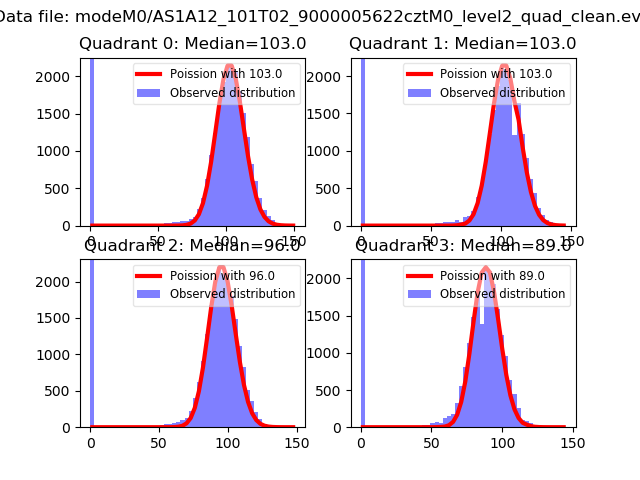
| Comparison with Poisson distribution Blue bars denote a histogram of data divided into 1 sec bins. Red curve is a Poisson curve with rate = median count rate of data. |
 |
 |
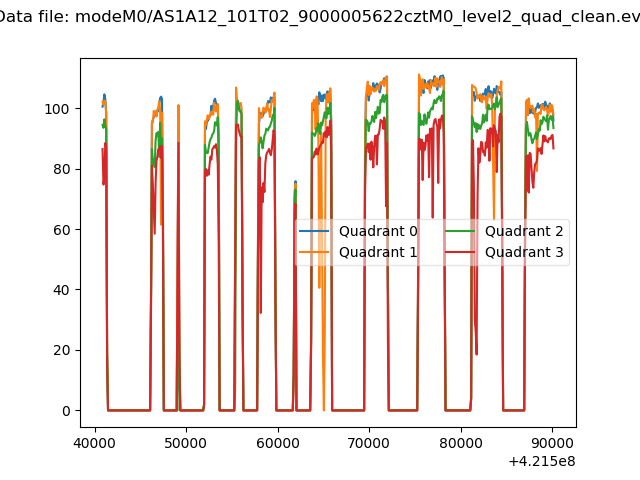
| Quadrant-wise count rates Data is divided into 100 sec bins |
 |
|
| Module-wise count rates for Quadrant A Data is divided into 100 sec bins |
 |
 |
| Module-wise count rates for Quadrant B Data is divided into 100 sec bins |
 |
 |
| Module-wise count rates for Quadrant C Data is divided into 100 sec bins |
 |
 |
| Module-wise count rates for Quadrant D Data is divided into 100 sec bins |
 |
 |
| Parameter | Plot |
|---|---|
| CZT HV Monitor |  |
| D_VDD |  |
| Temperature 1 | 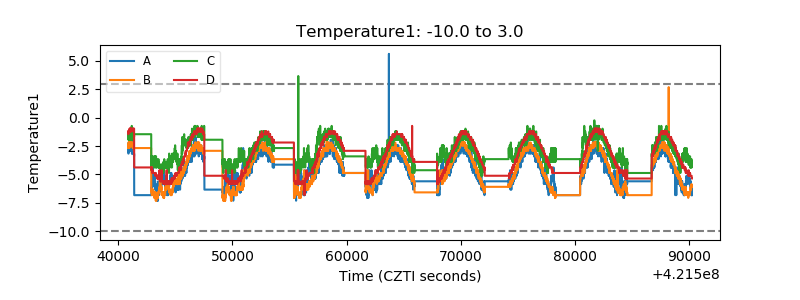 |
| Veto HV Monitor |  |
| Veto LLD |  |
| Alpha Counter |  |
| _CPM_Rate |  |
| CZT Counter |  |
| +2.5 Volts monitor | 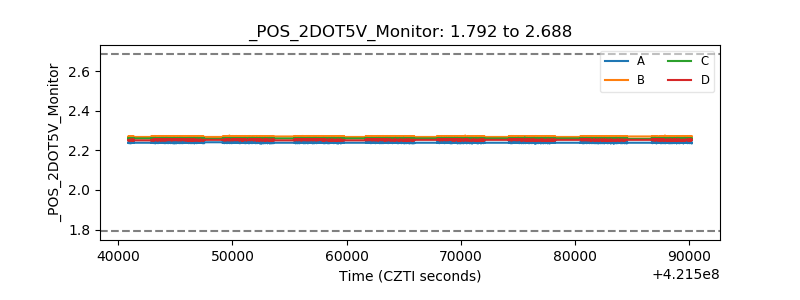 |
| +5 Volts monitor | 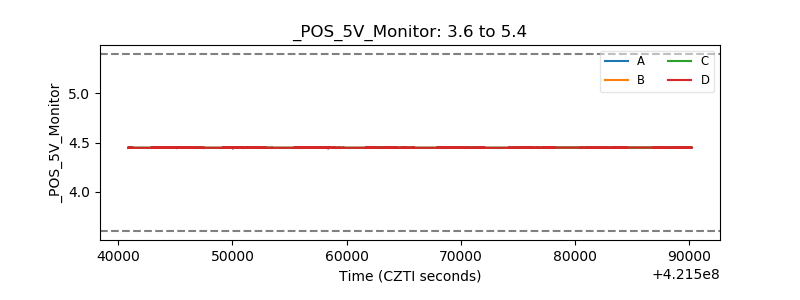 |
| _ROLL_ROT |  |
| _Roll_DEC |  |
| _Roll_RA |  |
| Veto Counter |  |