| Param | Original file | Final file |
|---|---|---|
| Filename | modeM0/AS1A12_101T03_9000005618cztM0_level2.fits | modeM0/AS1A12_101T03_9000005618cztM0_level2_quad_clean.evt |
| Size (bytes) | 95,457,600 | 115,522,560 |
| Size | 91.0 MB | 110.2 MB |
| Events in quadrant A | 571,588 | 736,411 |
| Events in quadrant B | 548,946 | 728,046 |
| Events in quadrant C | 501,364 | 593,460 |
| Events in quadrant D | 491,174 | 662,980 |
| Mode M0 | |||
|---|---|---|---|
| Quadrant | BADHDUFLAG | Total packets | Discarded packets |
| A | 0 | 23818 | 0 |
| B | 0 | 24525 | 0 |
| C | 0 | 34230 | 0 |
| D | 0 | 24999 | 0 |
| Mode M9 | |||
|---|---|---|---|
| Quadrant | BADHDUFLAG | Total packets | Discarded packets |
| A | 0 | 40 | 0 |
| B | 0 | 40 | 0 |
| C | 0 | 40 | 0 |
| D | 0 | 40 | 0 |
| Mode SS | |||
|---|---|---|---|
| Quadrant | BADHDUFLAG | Total packets | Discarded packets |
| A | 0 | 232 | 0 |
| B | 0 | 232 | 0 |
| C | 0 | 232 | 0 |
| D | 0 | 232 | 0 |
| Quadrant | Total seconds | Saturated seconds | Saturation percentage |
|---|---|---|---|
| A | 11225 | 16 | 0.142539% |
| B | 11225 | 141 | 1.256125% |
| C | 11225 | 1613 | 14.369710% |
| D | 11225 | 146 | 1.300668% |
Noise dominated data is calculated using 1-second bins in cleaned event files. If a bin has >2000 counts, and if more than 50% of those come from <1% of pixels, then it is considered to be noise-dominated and hence unusable.
| Quadrant | # 1 sec bins | Bins with >0 counts | Bins with >2000 counts | High rate bins dominated by noise | Noise dominated (total time) | Noise dominated (detector-on time) | Marked lightcurve |
|---|---|---|---|---|---|---|---|
| A | 15282 | 11225 | 0 | 0 | 0.00% | 0.00% | 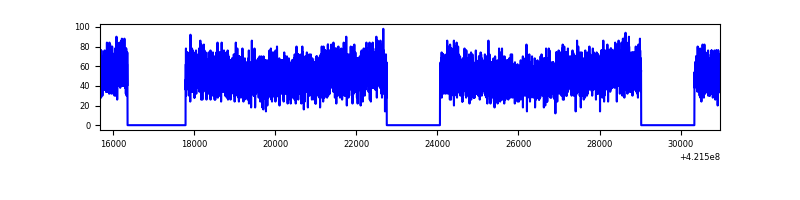 |
| B | 15282 | 11225 | 0 | 0 | 0.00% | 0.00% | 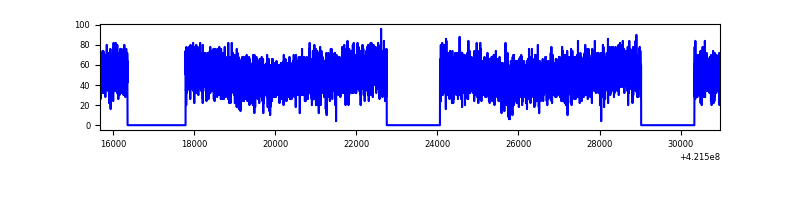 |
| C | 15282 | 10986 | 0 | 0 | 0.00% | 0.00% | 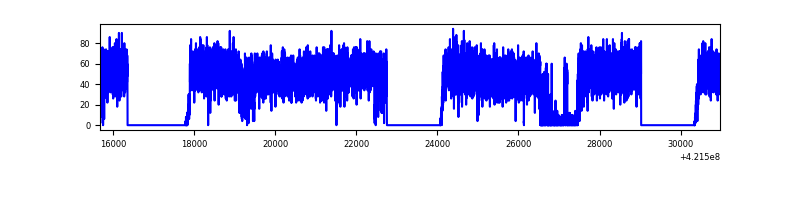 |
| D | 15282 | 11223 | 0 | 0 | 0.00% | 0.00% | 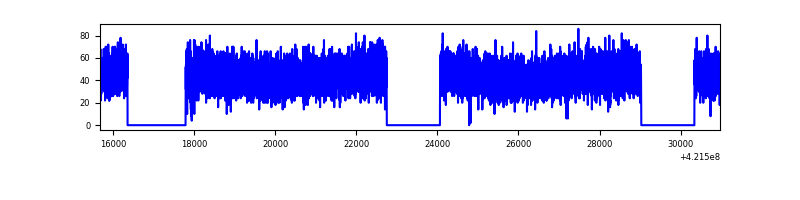 |
Top three noisy pixels from each quadrant. If the there are fewer than three noisy pixels in the level2.evt file, extra rows are filled as -1
| Pixel properties | Quadrant properties | ||||||
|---|---|---|---|---|---|---|---|
| Quadrant | DetID | PixID | Counts | Sigma | Mean | Median | Sigma |
| A | 0 | 29 | 487 | 8.7 | 149 | 140 | 39.9 |
| A | 9 | 19 | 486 | 8.68 | 149 | 140 | 39.9 |
| A | 14 | 95 | 465 | 8.15 | 149 | 140 | 39.9 |
| B | 2 | 9 | 452 | 10.14 | 144 | 137 | 31.1 |
| B | 3 | 17 | 397 | 8.37 | 144 | 137 | 31.1 |
| B | 5 | 232 | 375 | 7.66 | 144 | 137 | 31.1 |
| C | 1 | 80 | 402 | 7.85 | 132 | 124 | 35.4 |
| C | 1 | 81 | 400 | 7.79 | 132 | 124 | 35.4 |
| C | 3 | 203 | 386 | 7.4 | 132 | 124 | 35.4 |
| D | 6 | 67 | 390 | 6.59 | 140 | 127 | 39.9 |
| D | 6 | 231 | 377 | 6.27 | 140 | 127 | 39.9 |
| D | 7 | 3 | 362 | 5.89 | 140 | 127 | 39.9 |
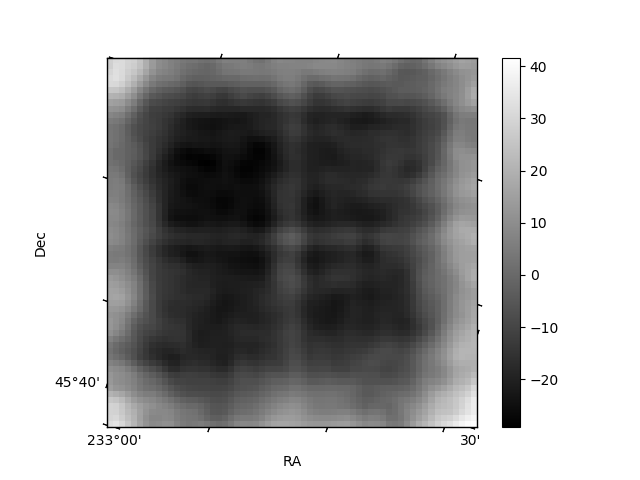
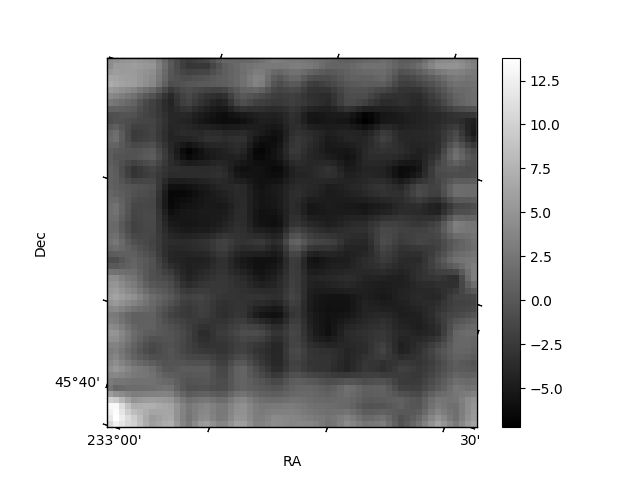
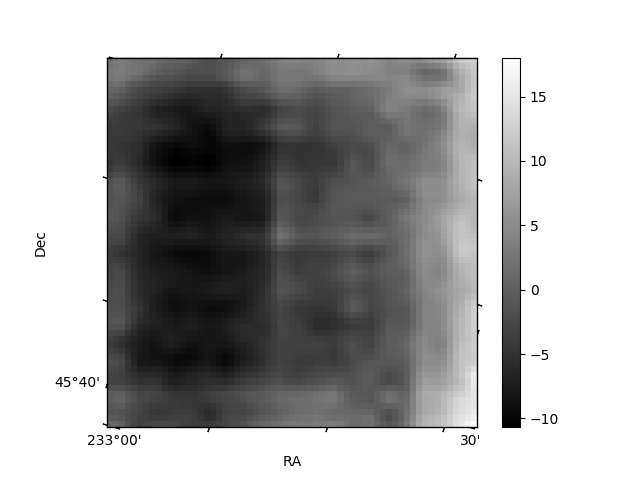
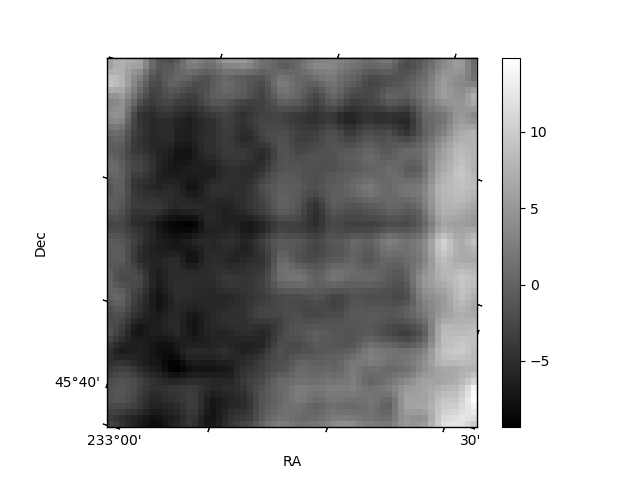
Histogram calculated using DETX and DETY for each event in the final _common_clean file
| Quadrant A | 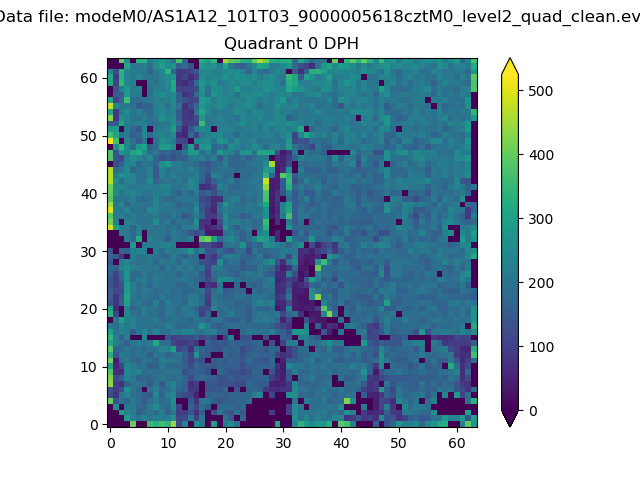 |
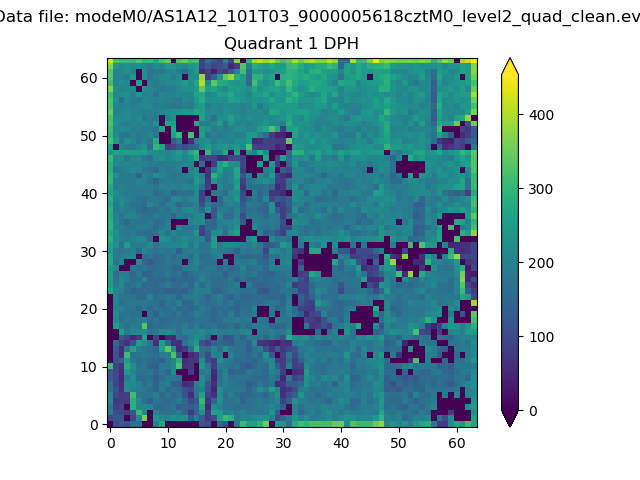 |
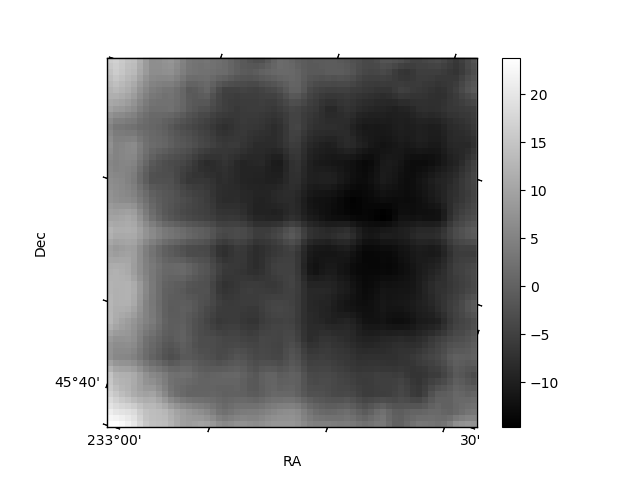
Quadrant B |
|---|---|---|---|
| Quadrant D | 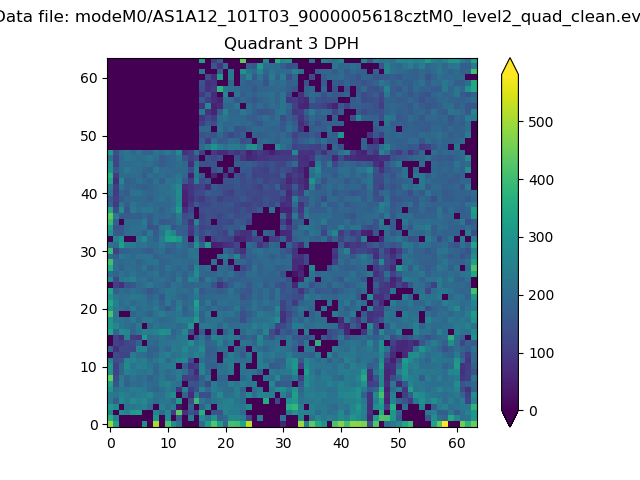 |
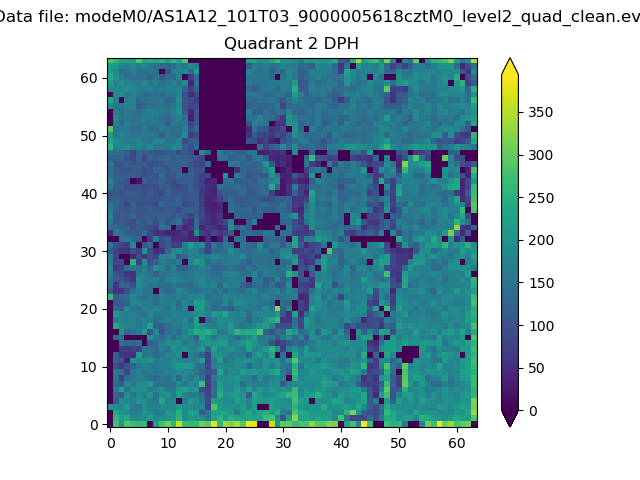 |
Quadrant C |
| Plot type | Count rate plots | Images |
|---|---|---|
| Comparison with Poisson distribution Blue bars denote a histogram of data divided into 1 sec bins. Red curve is a Poisson curve with rate = median count rate of data. |
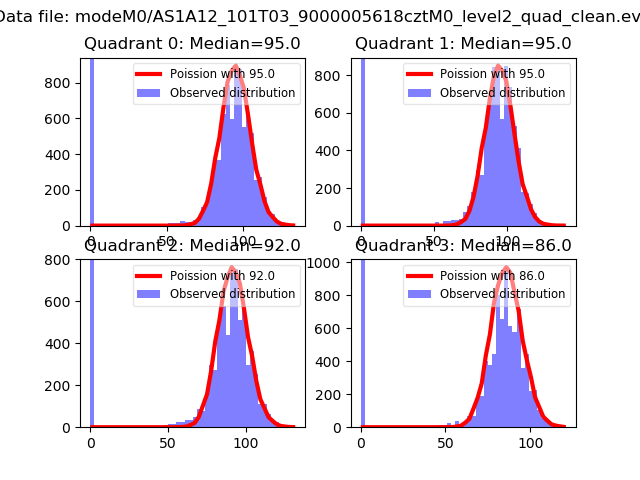 |
 |
| Quadrant-wise count rates Data is divided into 100 sec bins |
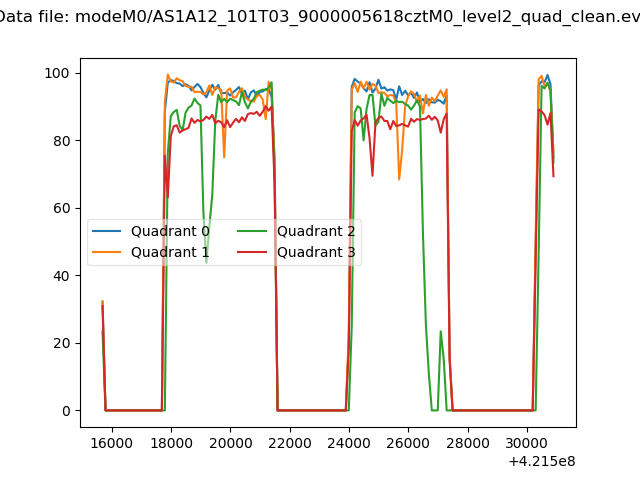 |
|
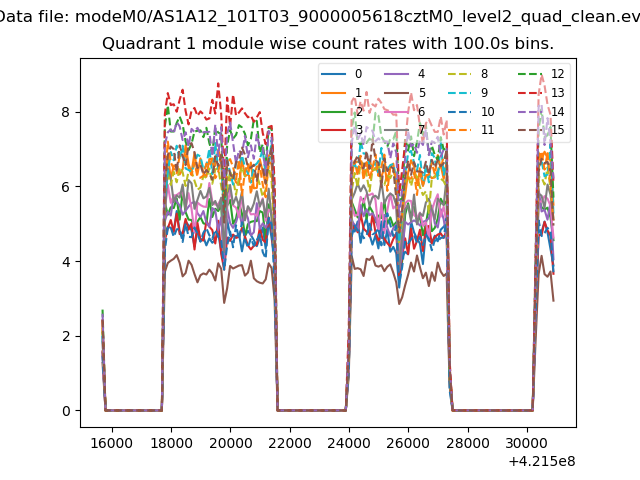
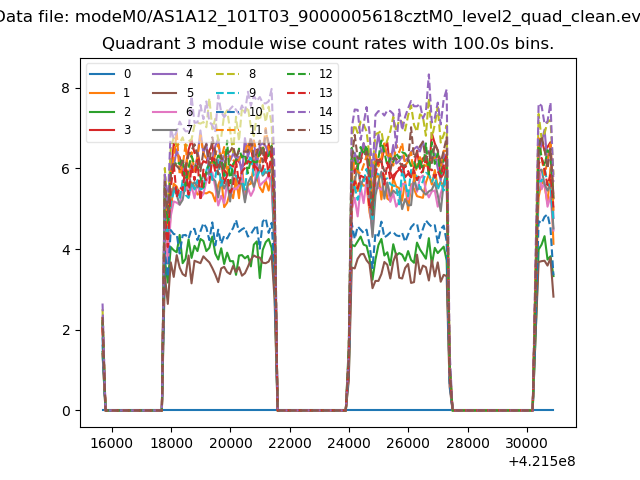
| Module-wise count rates for Quadrant A Data is divided into 100 sec bins |
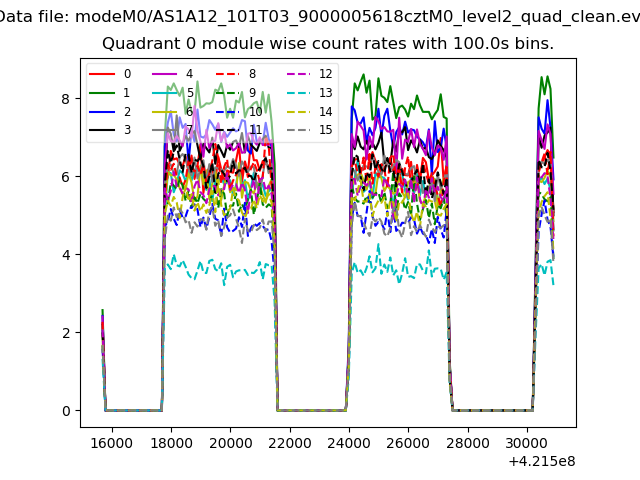 |
 |
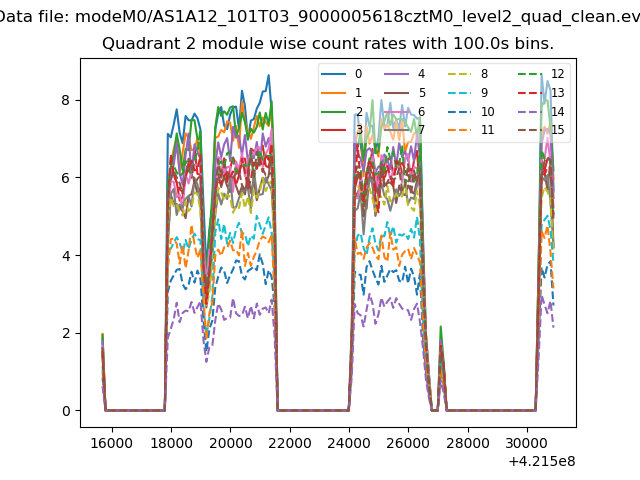
| Module-wise count rates for Quadrant B Data is divided into 100 sec bins |
 |
 |
| Module-wise count rates for Quadrant C Data is divided into 100 sec bins |
 |
 |
| Module-wise count rates for Quadrant D Data is divided into 100 sec bins |
 |
 |
| Parameter | Plot |
|---|---|
| CZT HV Monitor | 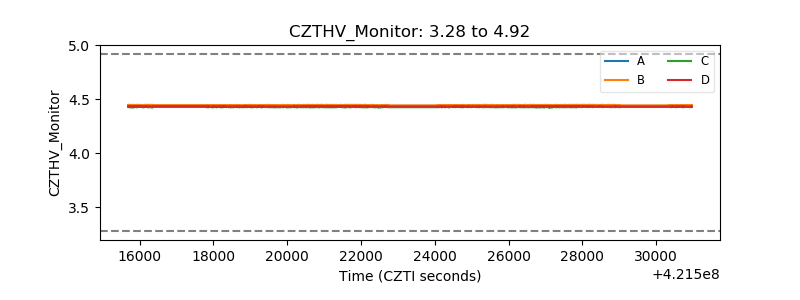 |
| D_VDD | 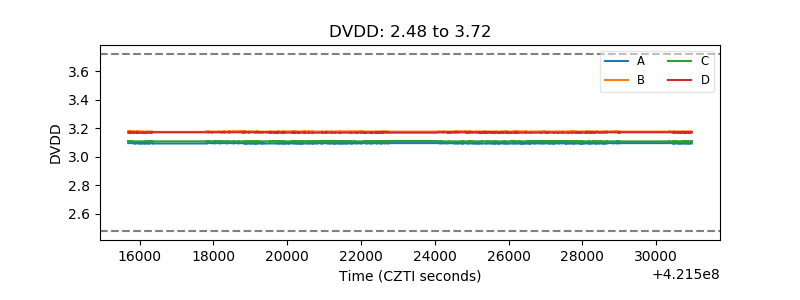 |
| Temperature 1 | 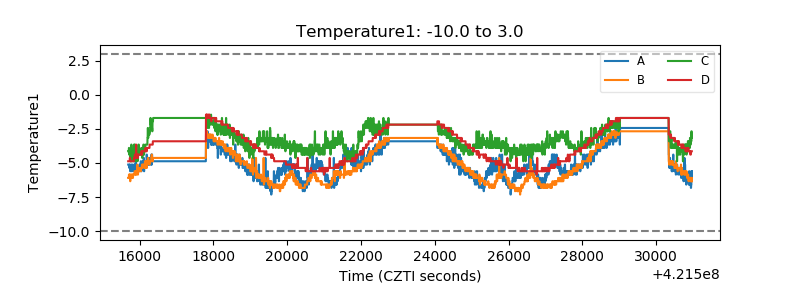 |
| Veto HV Monitor | 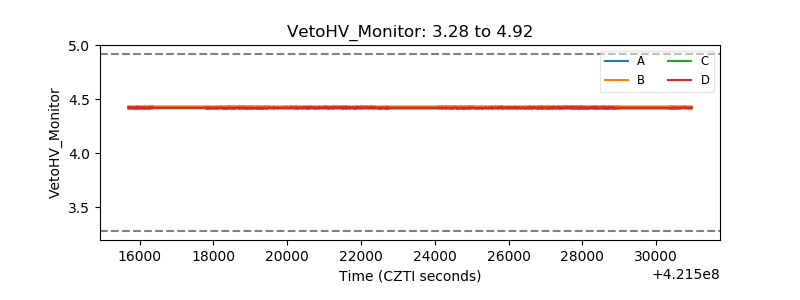 |
| Veto LLD | 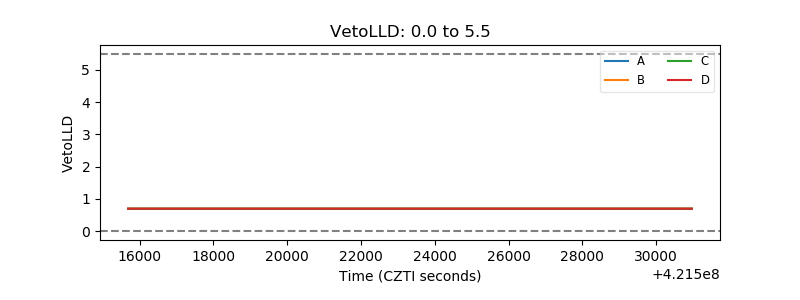 |
| Alpha Counter | 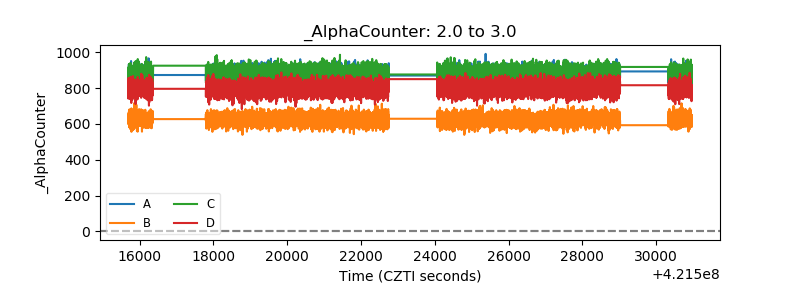 |
| _CPM_Rate | 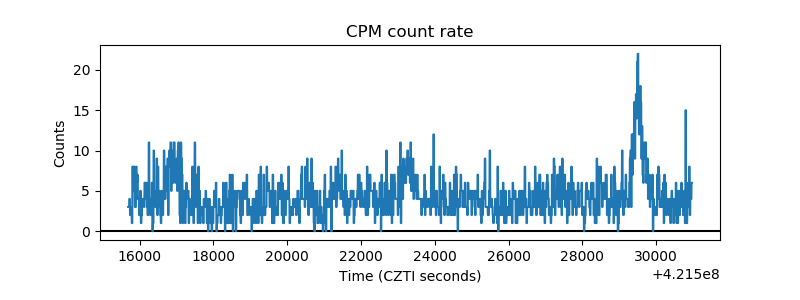 |
| CZT Counter | 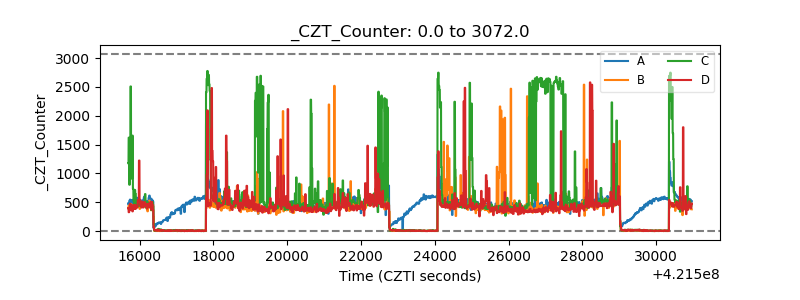 |
| +2.5 Volts monitor | 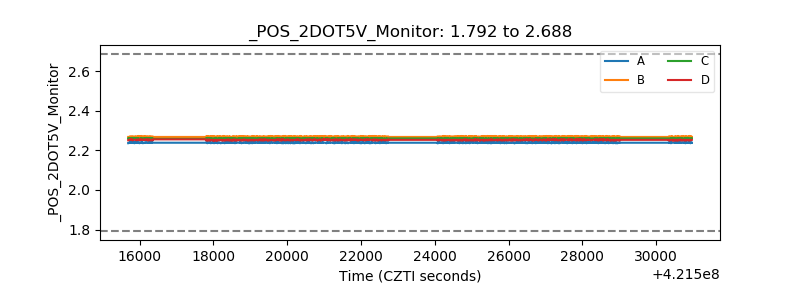 |
| +5 Volts monitor | 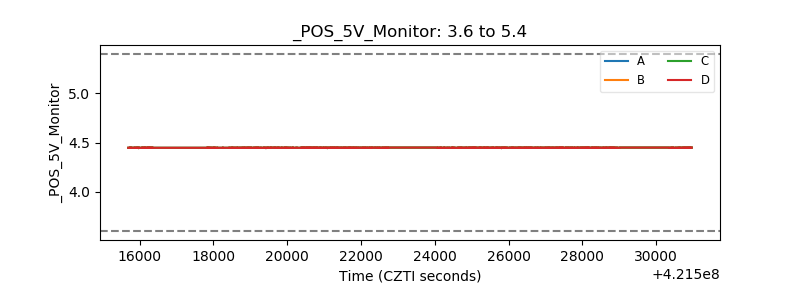 |
| _ROLL_ROT | 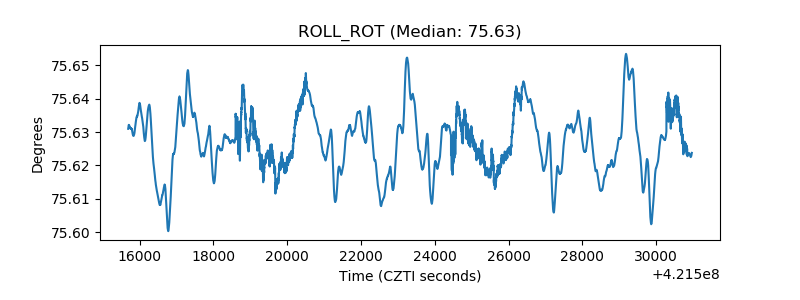 |
| _Roll_DEC | 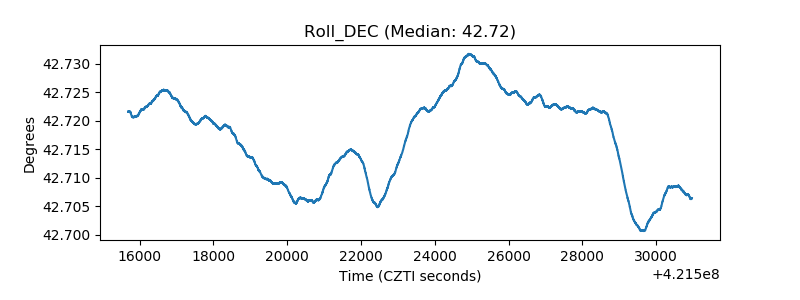 |
| _Roll_RA | 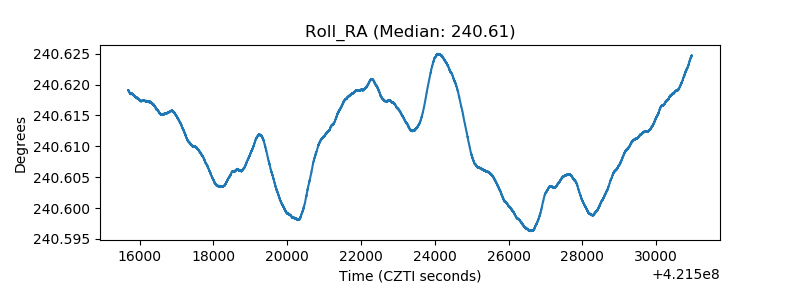 |
| Veto Counter | 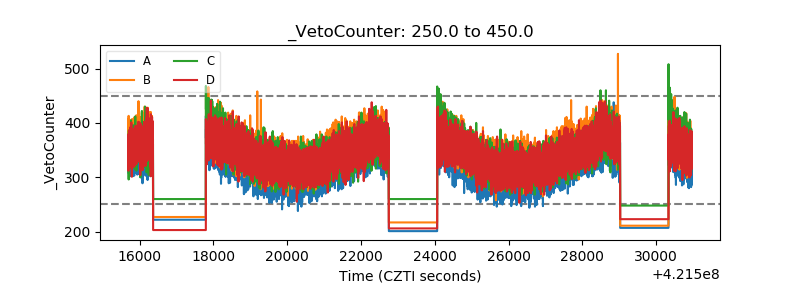 |