| Param | Original file | Final file |
|---|---|---|
| Filename | modeM0/AS1A12_089T13_9000005624cztM0_level2.fits | modeM0/AS1A12_089T13_9000005624cztM0_level2_quad_clean.evt |
| Size (bytes) | 41,541,120 | 45,699,840 |
| Size | 39.6 MB | 43.6 MB |
| Events in quadrant A | 246,758 | 276,666 |
| Events in quadrant B | 237,490 | 277,317 |
| Events in quadrant C | 235,528 | 264,028 |
| Events in quadrant D | 209,276 | 235,822 |
| Mode M9 | |||
|---|---|---|---|
| Quadrant | BADHDUFLAG | Total packets | Discarded packets |
| A | 0 | 16 | 0 |
| B | 0 | 16 | 0 |
| C | 0 | 16 | 0 |
| D | 0 | 16 | 0 |
| Mode M0 | |||
|---|---|---|---|
| Quadrant | BADHDUFLAG | Total packets | Discarded packets |
| A | 0 | 9888 | 0 |
| B | 0 | 9962 | 0 |
| C | 0 | 10259 | 0 |
| D | 0 | 11079 | 0 |
| Mode SS | |||
|---|---|---|---|
| Quadrant | BADHDUFLAG | Total packets | Discarded packets |
| A | 0 | 96 | 0 |
| B | 0 | 96 | 0 |
| C | 0 | 96 | 0 |
| D | 0 | 96 | 0 |
| Quadrant | Total seconds | Saturated seconds | Saturation percentage |
|---|---|---|---|
| A | 4686 | 4 | 0.085361% |
| B | 4686 | 43 | 0.917627% |
| C | 4686 | 114 | 2.432778% |
| D | 4686 | 123 | 2.624840% |
Noise dominated data is calculated using 1-second bins in cleaned event files. If a bin has >2000 counts, and if more than 50% of those come from <1% of pixels, then it is considered to be noise-dominated and hence unusable.
| Quadrant | # 1 sec bins | Bins with >0 counts | Bins with >2000 counts | High rate bins dominated by noise | Noise dominated (total time) | Noise dominated (detector-on time) | Marked lightcurve |
|---|---|---|---|---|---|---|---|
| A | 4685 | 4685 | 0 | 0 | 0.00% | 0.00% | 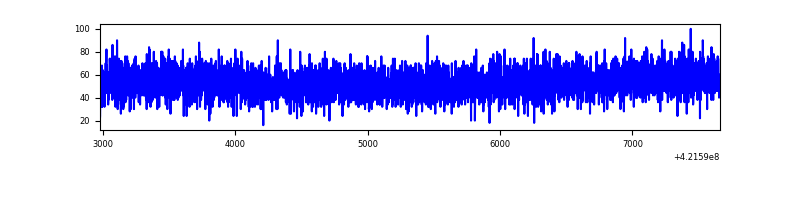 |
| B | 4685 | 4685 | 0 | 0 | 0.00% | 0.00% | 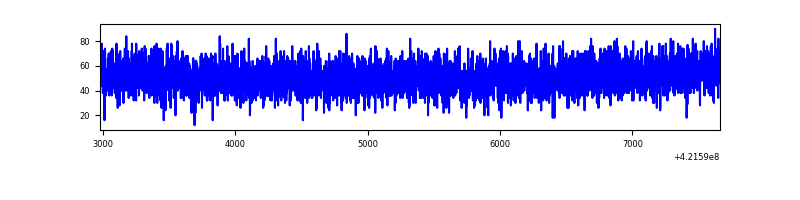 |
| C | 4682 | 4673 | 0 | 0 | 0.00% | 0.00% | 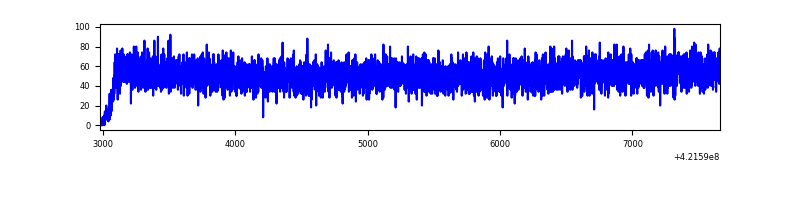 |
| D | 4685 | 4684 | 0 | 0 | 0.00% | 0.00% | 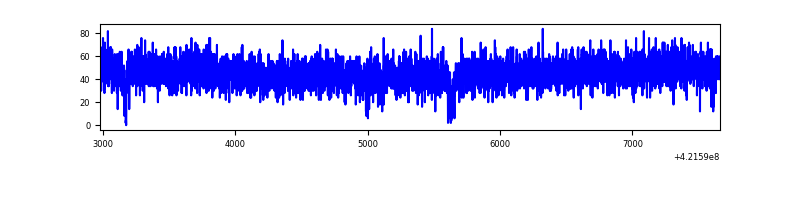 |
Top three noisy pixels from each quadrant. If the there are fewer than three noisy pixels in the level2.evt file, extra rows are filled as -1
| Pixel properties | Quadrant properties | ||||||
|---|---|---|---|---|---|---|---|
| Quadrant | DetID | PixID | Counts | Sigma | Mean | Median | Sigma |
| A | 0 | 29 | 213 | 8.45 | 64 | 60 | 18.1 |
| A | 7 | 110 | 211 | 8.34 | 64 | 60 | 18.1 |
| A | 9 | 19 | 208 | 8.17 | 64 | 60 | 18.1 |
| B | 2 | 9 | 218 | 10.8 | 62 | 60 | 14.6 |
| B | 3 | 17 | 176 | 7.93 | 62 | 60 | 14.6 |
| B | 5 | 128 | 171 | 7.59 | 62 | 60 | 14.6 |
| C | 3 | 203 | 203 | 8.12 | 62 | 58 | 17.9 |
| C | 3 | 202 | 200 | 7.95 | 62 | 58 | 17.9 |
| C | 1 | 80 | 185 | 7.11 | 62 | 58 | 17.9 |
| D | 15 | 46 | 159 | 5.94 | 59 | 54 | 17.7 |
| D | 6 | 79 | 158 | 5.89 | 59 | 54 | 17.7 |
| D | 10 | 189 | 157 | 5.83 | 59 | 54 | 17.7 |
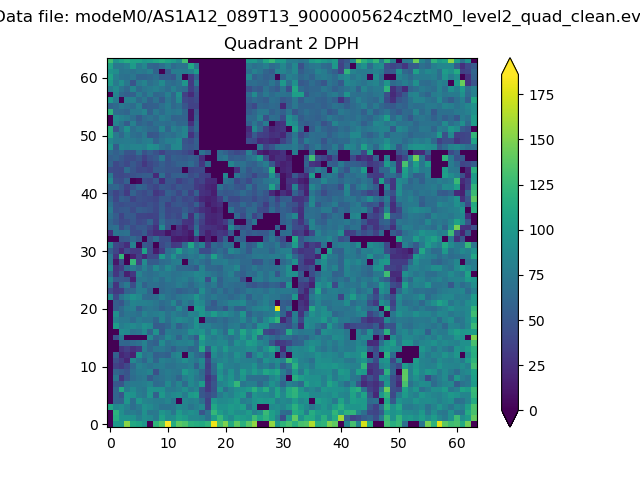
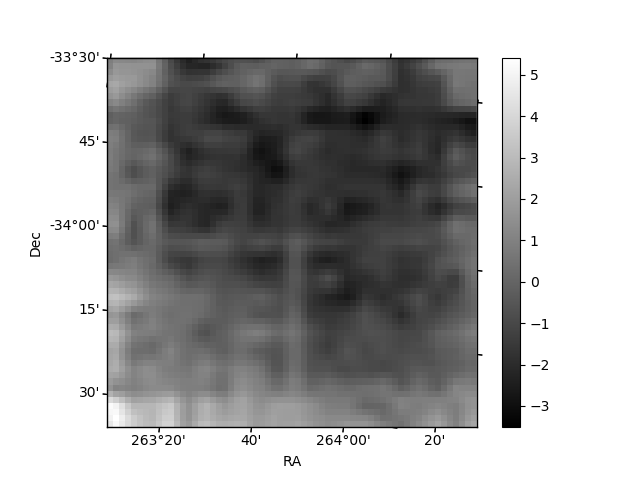
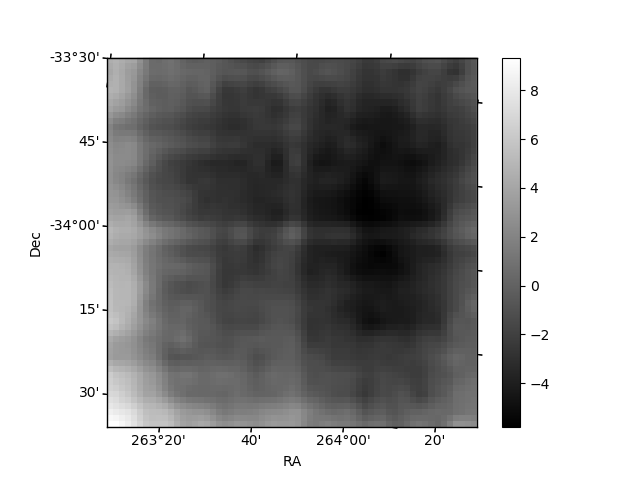
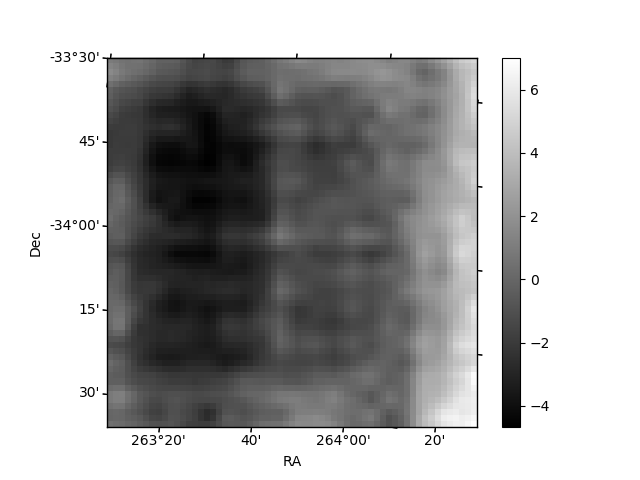
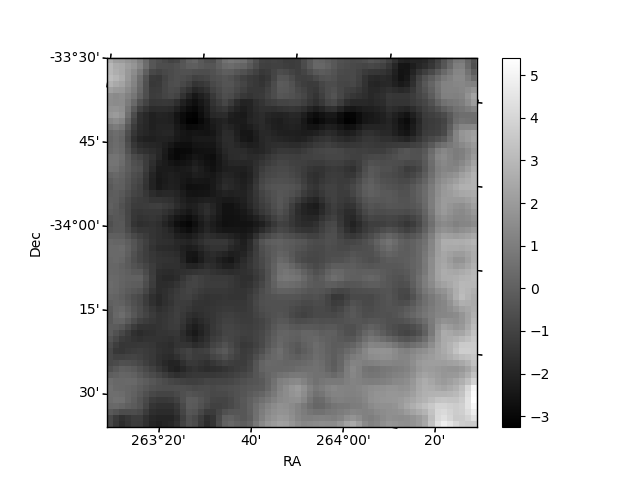
Histogram calculated using DETX and DETY for each event in the final _common_clean file
| Quadrant A | 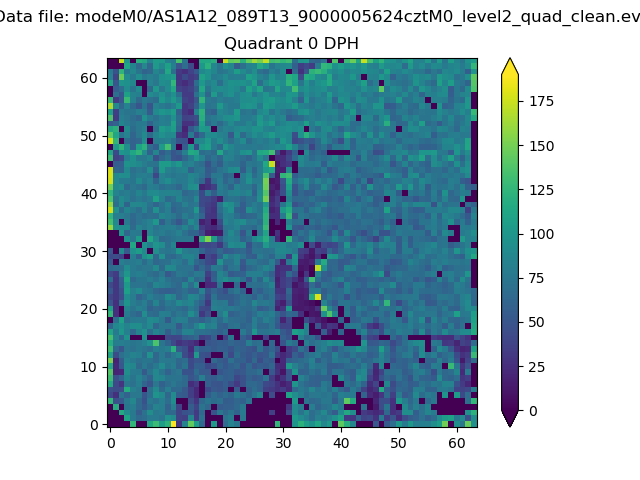 |
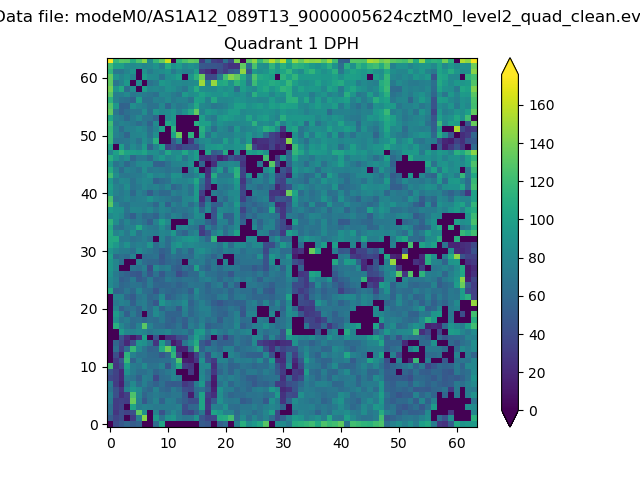 |
Quadrant B |
|---|---|---|---|
| Quadrant D | 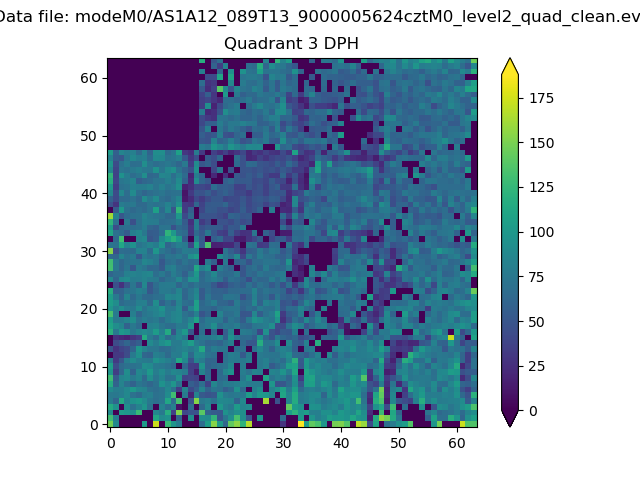 |
 |
Quadrant C |
| Plot type | Count rate plots | Images |
|---|---|---|
| Comparison with Poisson distribution Blue bars denote a histogram of data divided into 1 sec bins. Red curve is a Poisson curve with rate = median count rate of data. |
 |
 |
| Quadrant-wise count rates Data is divided into 100 sec bins |
 |
|
| Module-wise count rates for Quadrant A Data is divided into 100 sec bins |
 |
 |
| Module-wise count rates for Quadrant B Data is divided into 100 sec bins |
 |
 |
| Module-wise count rates for Quadrant C Data is divided into 100 sec bins |
 |
 |
| Module-wise count rates for Quadrant D Data is divided into 100 sec bins |
 |
 |
| Parameter | Plot |
|---|---|
| CZT HV Monitor |  |
| D_VDD | 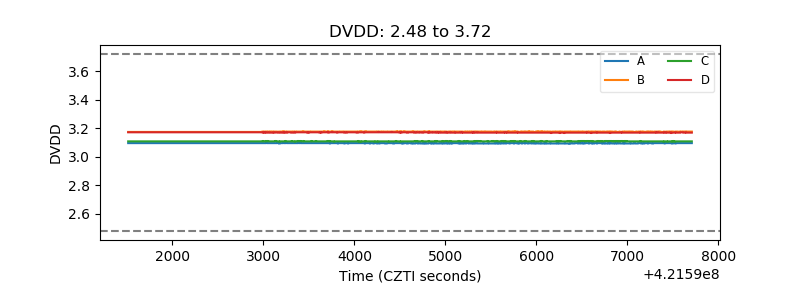 |
| Temperature 1 | 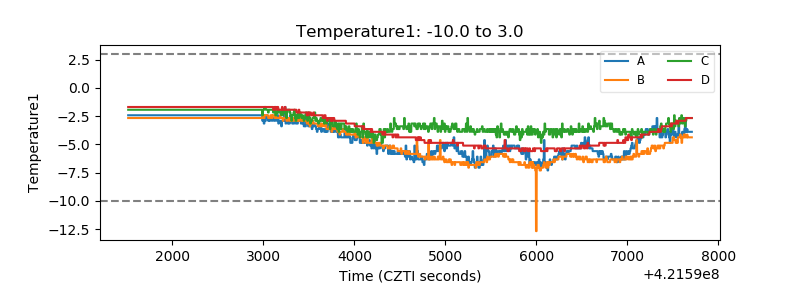 |
| Veto HV Monitor |  |
| Veto LLD |  |
| Alpha Counter | 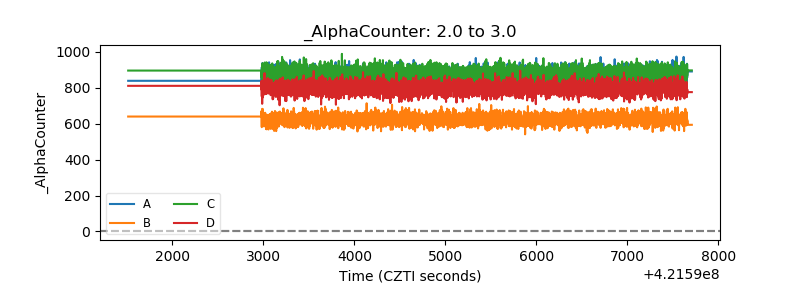 |
| _CPM_Rate |  |
| CZT Counter | 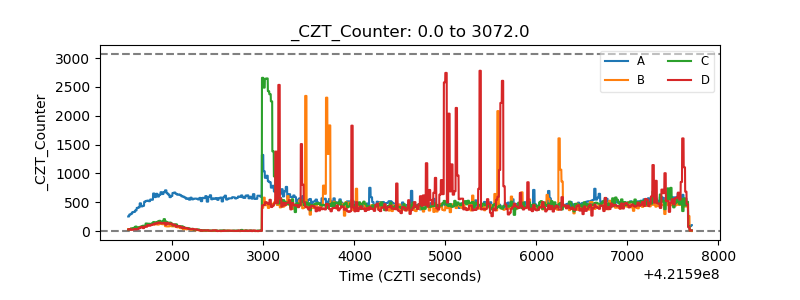 |
| +2.5 Volts monitor | 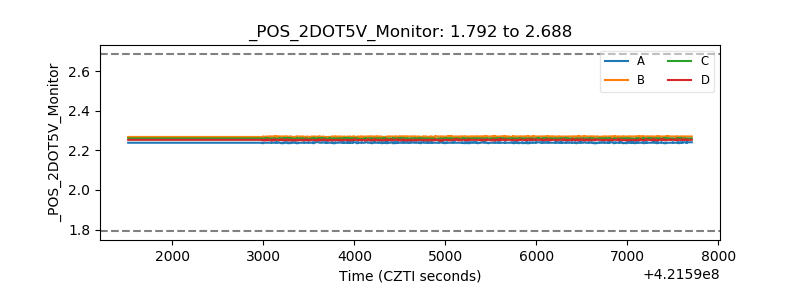 |
| +5 Volts monitor |  |
| _ROLL_ROT | 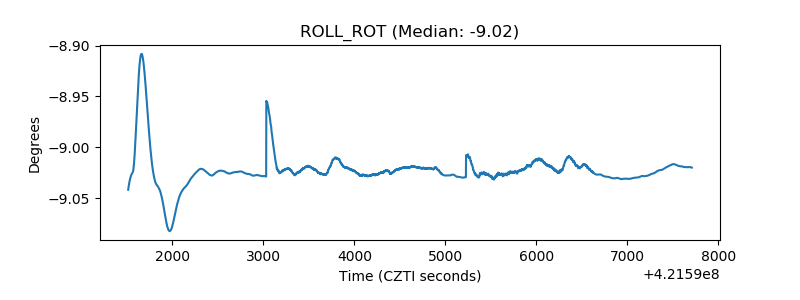 |
| _Roll_DEC | 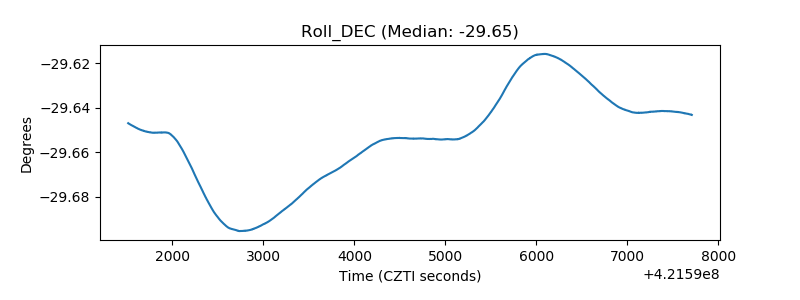 |
| _Roll_RA |  |
| Veto Counter |  |