| Param | Original file | Final file |
|---|---|---|
| Filename | modeM0/AS1C07_001T12_9000005632cztM0_level2.fits | modeM0/AS1C07_001T12_9000005632cztM0_level2_quad_clean.evt |
| Size (bytes) | 610,882,560 | 919,889,280 |
| Size | 582.6 MB | 877.3 MB |
| Events in quadrant A | 3,653,304 | 6,065,683 |
| Events in quadrant B | 3,453,804 | 5,940,658 |
| Events in quadrant C | 3,521,672 | 5,769,868 |
| Events in quadrant D | 3,065,720 | 5,282,464 |
| Mode M0 | |||
|---|---|---|---|
| Quadrant | BADHDUFLAG | Total packets | Discarded packets |
| A | 0 | 154662 | 0 |
| B | 0 | 172481 | 0 |
| C | 0 | 158640 | 0 |
| D | 0 | 173524 | 0 |
| Mode M9 | |||
|---|---|---|---|
| Quadrant | BADHDUFLAG | Total packets | Discarded packets |
| A | 0 | 272 | 0 |
| B | 0 | 272 | 0 |
| C | 0 | 272 | 0 |
| D | 0 | 272 | 0 |
| Mode SS | |||
|---|---|---|---|
| Quadrant | BADHDUFLAG | Total packets | Discarded packets |
| A | 0 | 1436 | 0 |
| B | 0 | 1436 | 0 |
| C | 0 | 1436 | 0 |
| D | 0 | 1436 | 0 |
| Quadrant | Total seconds | Saturated seconds | Saturation percentage |
|---|---|---|---|
| A | 70050 | 295 | 0.421128% |
| B | 70050 | 2042 | 2.915061% |
| C | 70050 | 1124 | 1.604568% |
| D | 70050 | 1922 | 2.743754% |
Noise dominated data is calculated using 1-second bins in cleaned event files. If a bin has >2000 counts, and if more than 50% of those come from <1% of pixels, then it is considered to be noise-dominated and hence unusable.
| Quadrant | # 1 sec bins | Bins with >0 counts | Bins with >2000 counts | High rate bins dominated by noise | Noise dominated (total time) | Noise dominated (detector-on time) | Marked lightcurve |
|---|---|---|---|---|---|---|---|
| A | 97329 | 70051 | 0 | 0 | 0.00% | 0.00% | 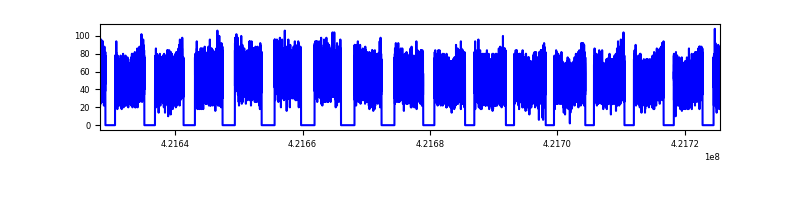 |
| B | 97329 | 70043 | 0 | 0 | 0.00% | 0.00% | 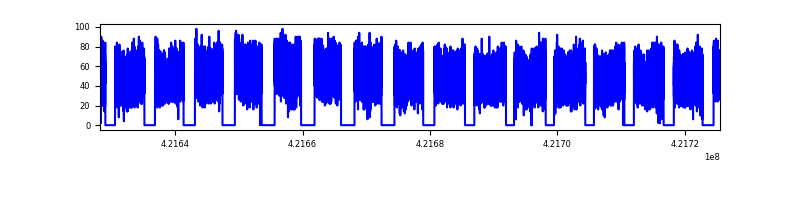 |
| C | 97329 | 70026 | 0 | 0 | 0.00% | 0.00% | 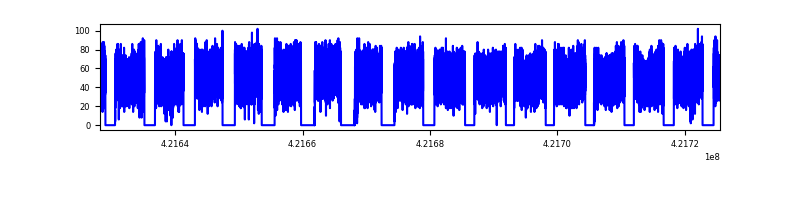 |
| D | 97329 | 70016 | 0 | 0 | 0.00% | 0.00% | 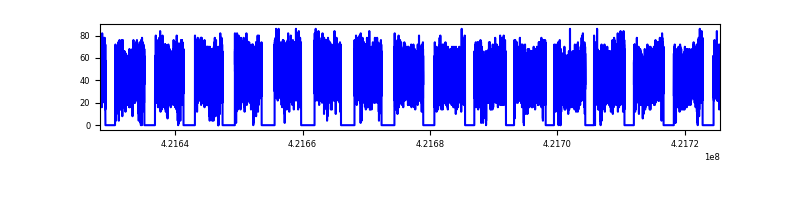 |
Top three noisy pixels from each quadrant. If the there are fewer than three noisy pixels in the level2.evt file, extra rows are filled as -1
| Pixel properties | Quadrant properties | ||||||
|---|---|---|---|---|---|---|---|
| Quadrant | DetID | PixID | Counts | Sigma | Mean | Median | Sigma |
| A | 7 | 110 | 3017 | 8.87 | 954 | 899 | 238.9 |
| A | 9 | 19 | 3015 | 8.86 | 954 | 899 | 238.9 |
| A | 0 | 29 | 2960 | 8.63 | 954 | 899 | 238.9 |
| B | 2 | 9 | 2994 | 11.94 | 914 | 874 | 177.5 |
| B | 3 | 80 | 2553 | 9.46 | 914 | 874 | 177.5 |
| B | 2 | 8 | 2393 | 8.56 | 914 | 874 | 177.5 |
| C | 1 | 81 | 2965 | 8.79 | 930 | 870 | 238.4 |
| C | 1 | 80 | 2891 | 8.48 | 930 | 870 | 238.4 |
| C | 3 | 202 | 2765 | 7.95 | 930 | 870 | 238.4 |
| D | 6 | 38 | 2293 | 6.34 | 877 | 799 | 235.5 |
| D | 10 | 189 | 2275 | 6.27 | 877 | 799 | 235.5 |
| D | 4 | 160 | 2263 | 6.22 | 877 | 799 | 235.5 |
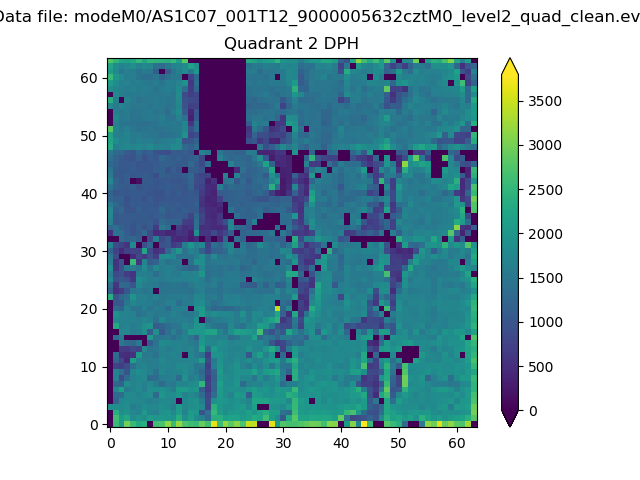
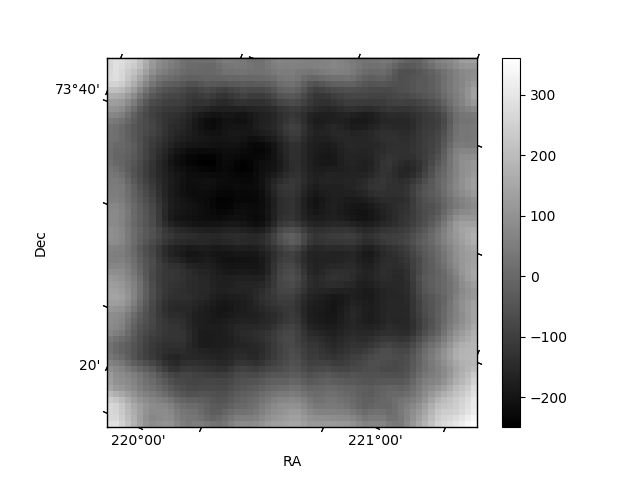
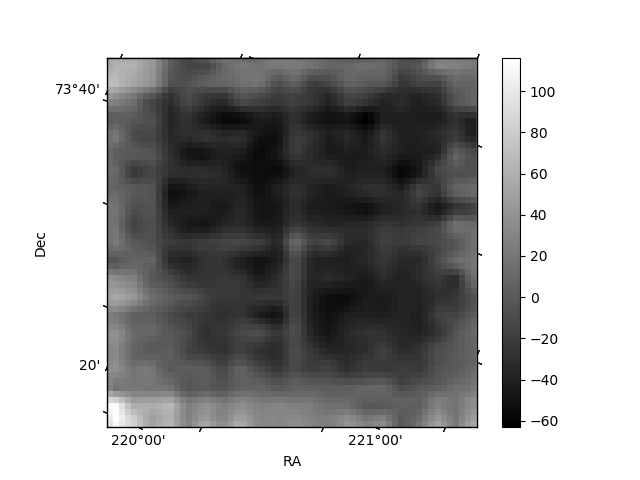
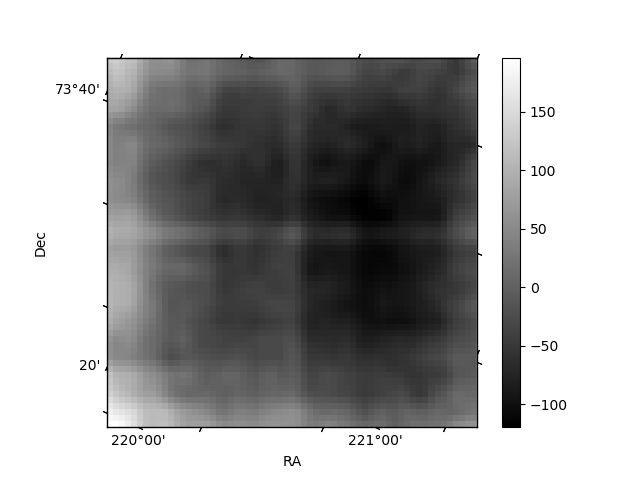
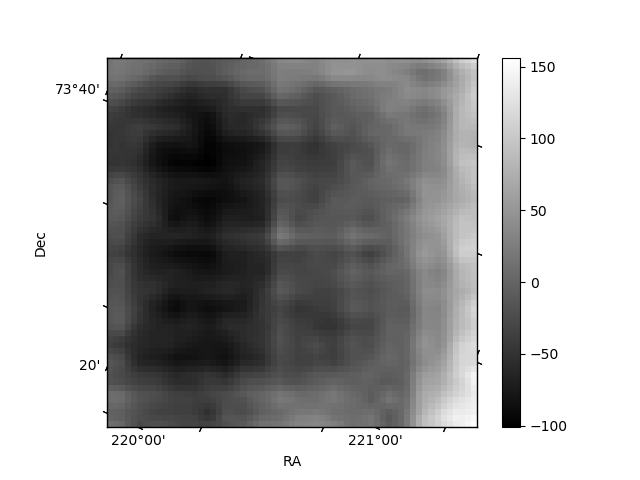
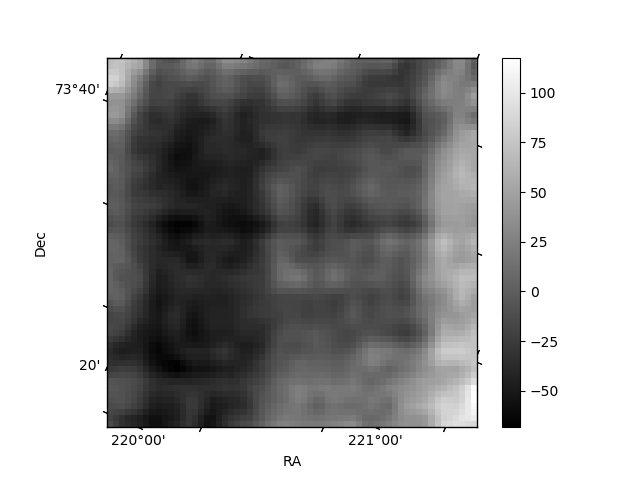
Histogram calculated using DETX and DETY for each event in the final _common_clean file
| Quadrant A | 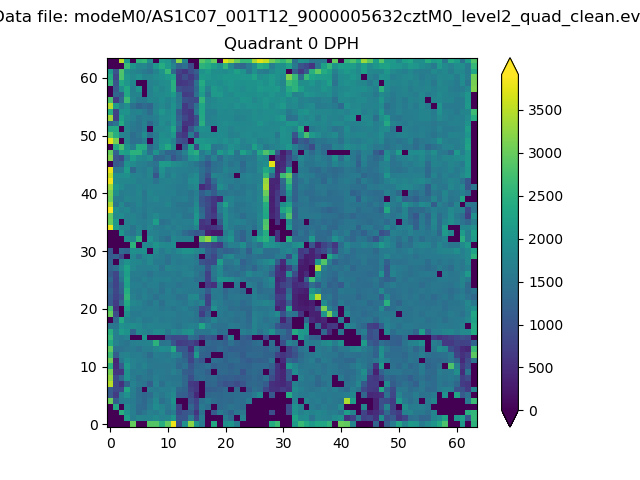 |
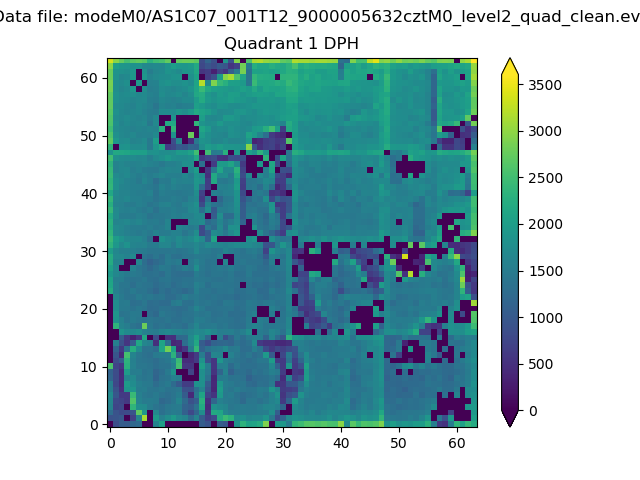 |
Quadrant B |
|---|---|---|---|
| Quadrant D | 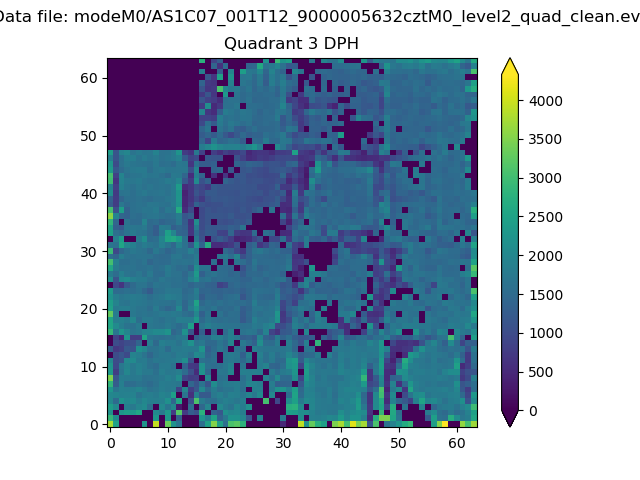 |
 |
Quadrant C |
| Plot type | Count rate plots | Images |
|---|---|---|
| Comparison with Poisson distribution Blue bars denote a histogram of data divided into 1 sec bins. Red curve is a Poisson curve with rate = median count rate of data. |
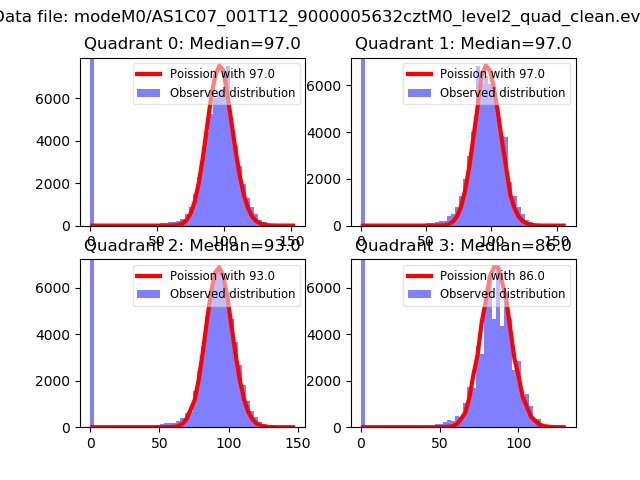 |
 |
| Quadrant-wise count rates Data is divided into 100 sec bins |
 |
|
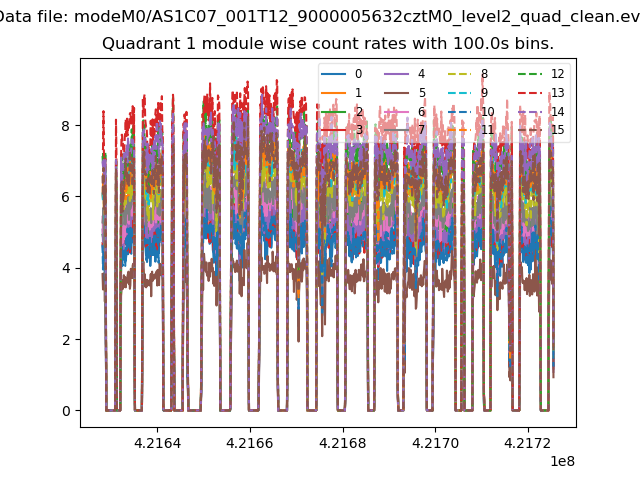
| Module-wise count rates for Quadrant A Data is divided into 100 sec bins |
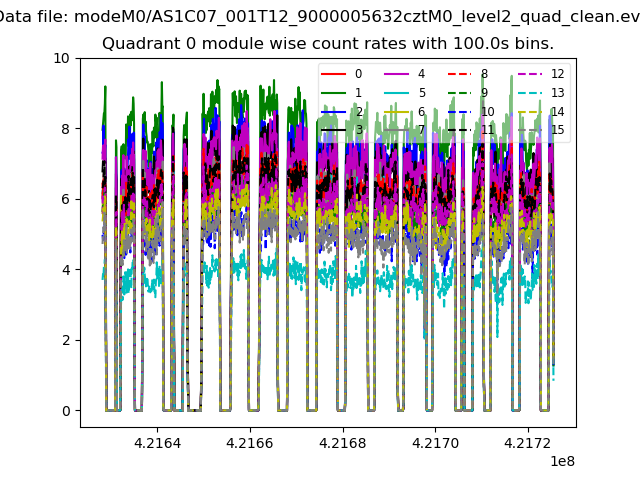 |
 |
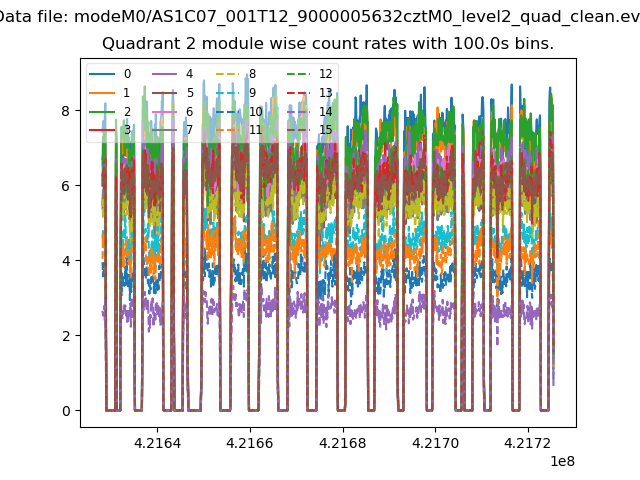
| Module-wise count rates for Quadrant B Data is divided into 100 sec bins |
 |
 |
| Module-wise count rates for Quadrant C Data is divided into 100 sec bins |
 |
 |
| Module-wise count rates for Quadrant D Data is divided into 100 sec bins |
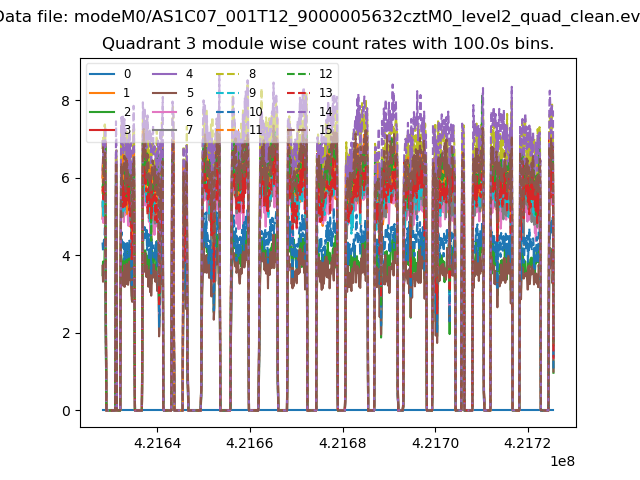 |
 |
| Parameter | Plot |
|---|---|
| CZT HV Monitor | 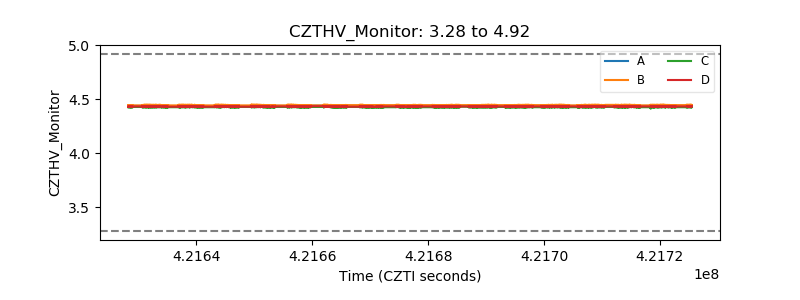 |
| D_VDD | 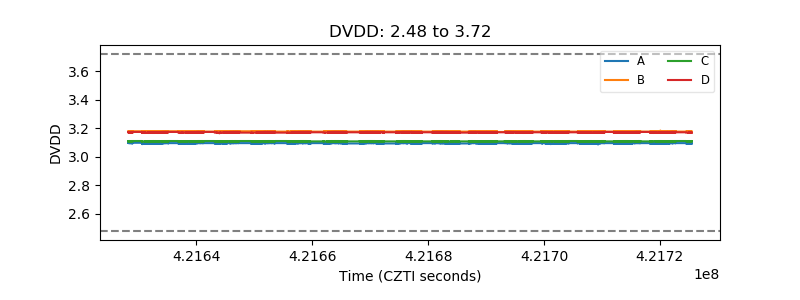 |
| Temperature 1 | 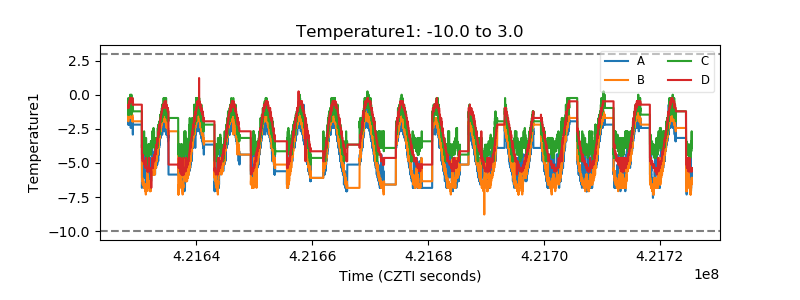 |
| Veto HV Monitor | 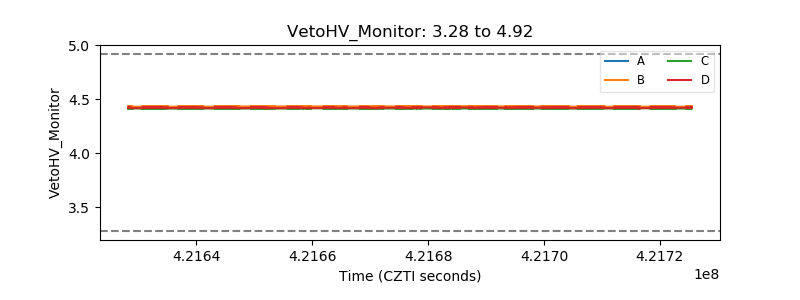 |
| Veto LLD | 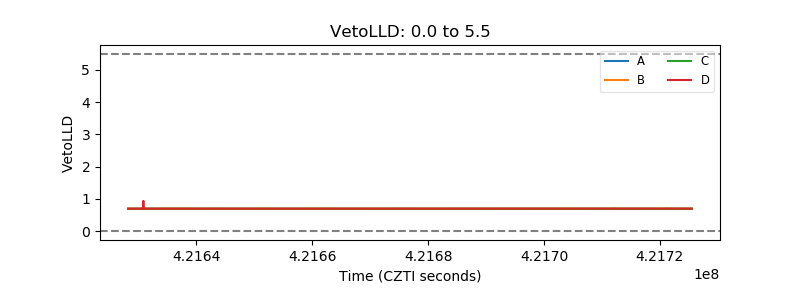 |
| Alpha Counter | 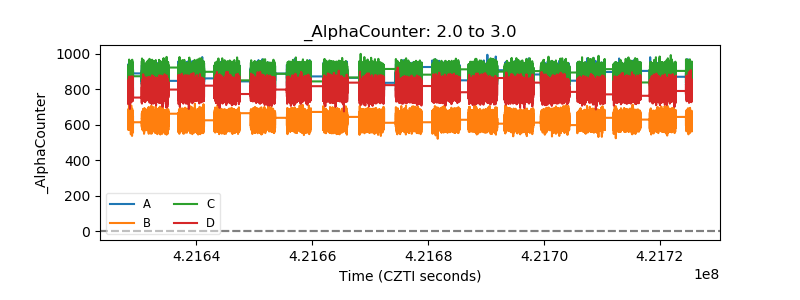 |
| _CPM_Rate | 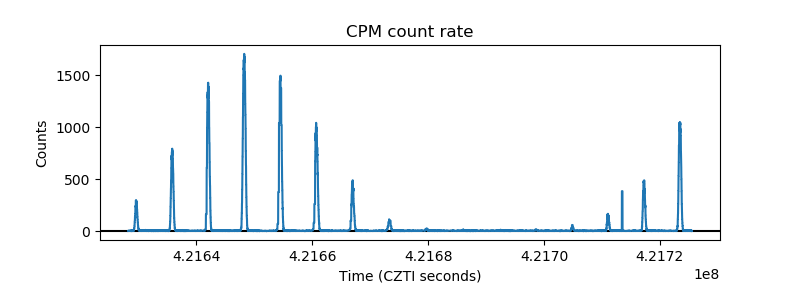 |
| CZT Counter | 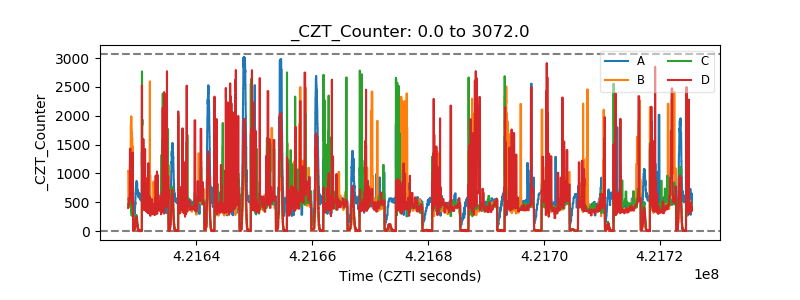 |
| +2.5 Volts monitor | 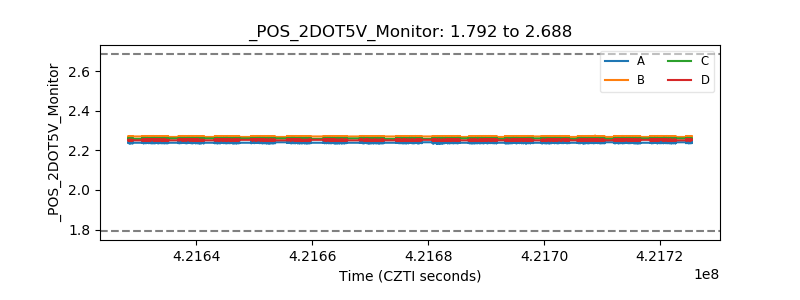 |
| +5 Volts monitor | 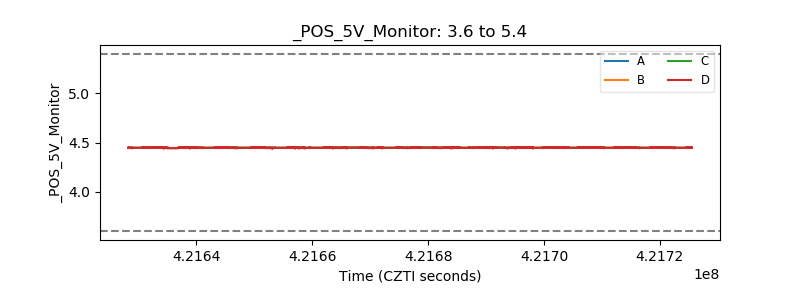 |
| _ROLL_ROT | 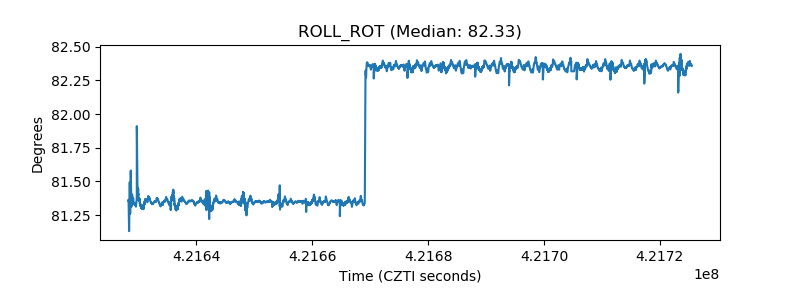 |
| _Roll_DEC | 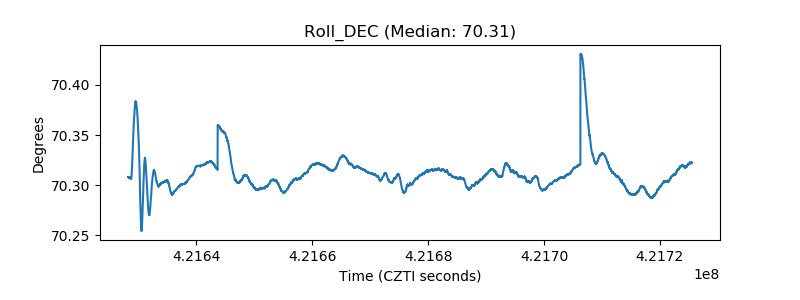 |
| _Roll_RA | 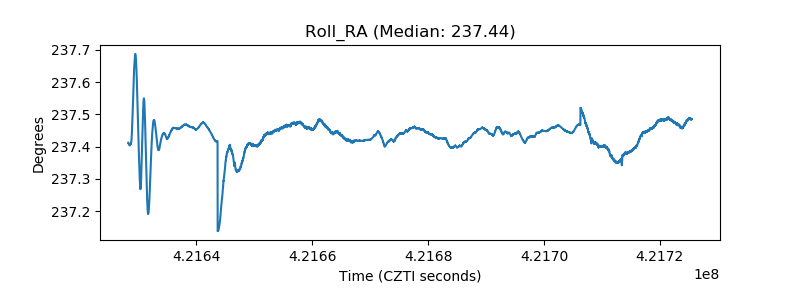 |
| Veto Counter | 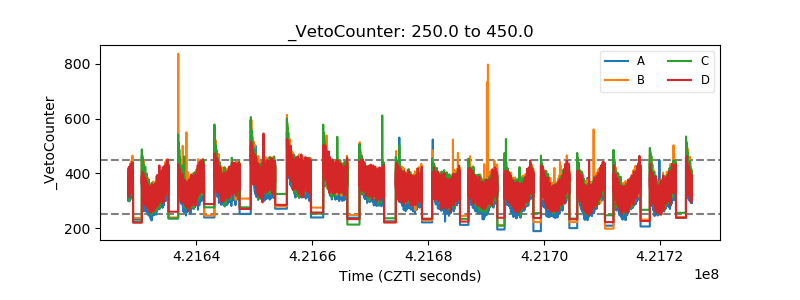 |