| Param | Original file | Final file |
|---|---|---|
| Filename | modeM0/AS1A12_044T17_9000005636cztM0_level2.fits | modeM0/AS1A12_044T17_9000005636cztM0_level2_quad_clean.evt |
| Size (bytes) | 256,008,960 | 331,079,040 |
| Size | 244.1 MB | 315.7 MB |
| Events in quadrant A | 1,551,454 | 2,173,829 |
| Events in quadrant B | 1,415,646 | 2,036,879 |
| Events in quadrant C | 1,466,370 | 1,954,506 |
| Events in quadrant D | 1,295,562 | 1,839,480 |
| Mode SS | |||
|---|---|---|---|
| Quadrant | BADHDUFLAG | Total packets | Discarded packets |
| A | 0 | 600 | 0 |
| B | 0 | 600 | 0 |
| C | 0 | 600 | 0 |
| D | 0 | 600 | 0 |
| Mode M0 | |||
|---|---|---|---|
| Quadrant | BADHDUFLAG | Total packets | Discarded packets |
| A | 0 | 65101 | 0 |
| B | 0 | 78577 | 0 |
| C | 0 | 86844 | 0 |
| D | 0 | 74907 | 0 |
| Mode M9 | |||
|---|---|---|---|
| Quadrant | BADHDUFLAG | Total packets | Discarded packets |
| A | 0 | 112 | 0 |
| B | 0 | 112 | 0 |
| C | 0 | 112 | 0 |
| D | 0 | 112 | 0 |
| Quadrant | Total seconds | Saturated seconds | Saturation percentage |
|---|---|---|---|
| A | 29421 | 140 | 0.475851% |
| B | 29421 | 1968 | 6.689100% |
| C | 29421 | 1603 | 5.448489% |
| D | 29421 | 1053 | 3.579076% |
Noise dominated data is calculated using 1-second bins in cleaned event files. If a bin has >2000 counts, and if more than 50% of those come from <1% of pixels, then it is considered to be noise-dominated and hence unusable.
| Quadrant | # 1 sec bins | Bins with >0 counts | Bins with >2000 counts | High rate bins dominated by noise | Noise dominated (total time) | Noise dominated (detector-on time) | Marked lightcurve |
|---|---|---|---|---|---|---|---|
| A | 39338 | 29419 | 0 | 0 | 0.00% | 0.00% | 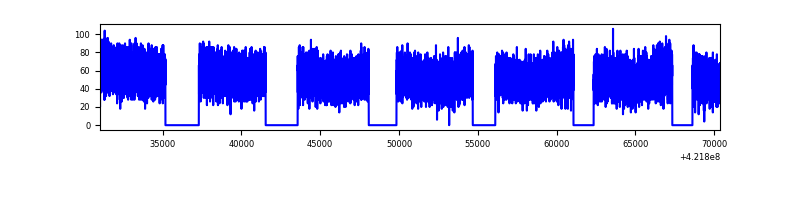 |
| B | 39338 | 29398 | 0 | 0 | 0.00% | 0.00% |  |
| C | 39338 | 29400 | 0 | 0 | 0.00% | 0.00% |  |
| D | 39338 | 29381 | 0 | 0 | 0.00% | 0.00% | 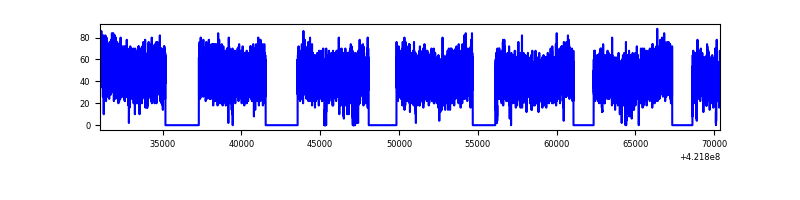 |
Top three noisy pixels from each quadrant. If the there are fewer than three noisy pixels in the level2.evt file, extra rows are filled as -1
| Pixel properties | Quadrant properties | ||||||
|---|---|---|---|---|---|---|---|
| Quadrant | DetID | PixID | Counts | Sigma | Mean | Median | Sigma |
| A | 7 | 110 | 1281 | 8.78 | 404 | 379 | 102.7 |
| A | 9 | 19 | 1274 | 8.72 | 404 | 379 | 102.7 |
| A | 0 | 29 | 1197 | 7.97 | 404 | 379 | 102.7 |
| B | 2 | 9 | 1255 | 11.86 | 375 | 358 | 75.7 |
| B | 3 | 80 | 1054 | 9.2 | 375 | 358 | 75.7 |
| B | 5 | 128 | 1010 | 8.62 | 375 | 358 | 75.7 |
| C | 1 | 81 | 1297 | 9.37 | 387 | 363 | 99.6 |
| C | 1 | 80 | 1198 | 8.38 | 387 | 363 | 99.6 |
| C | 3 | 202 | 1182 | 8.22 | 387 | 363 | 99.6 |
| D | 7 | 3 | 1016 | 6.71 | 371 | 338 | 101.0 |
| D | 10 | 113 | 961 | 6.17 | 371 | 338 | 101.0 |
| D | 12 | 6 | 940 | 5.96 | 371 | 338 | 101.0 |
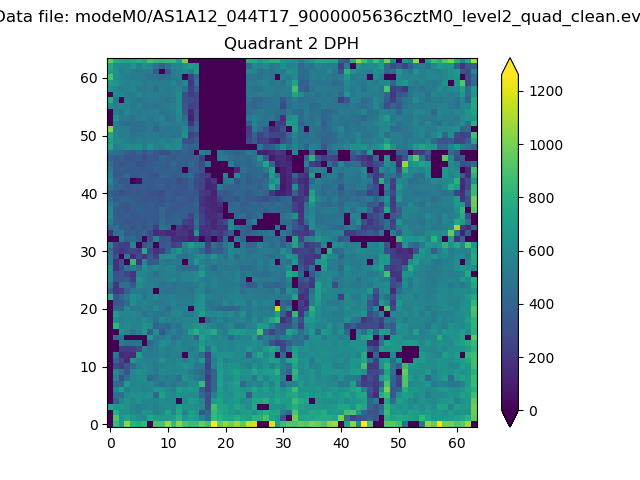
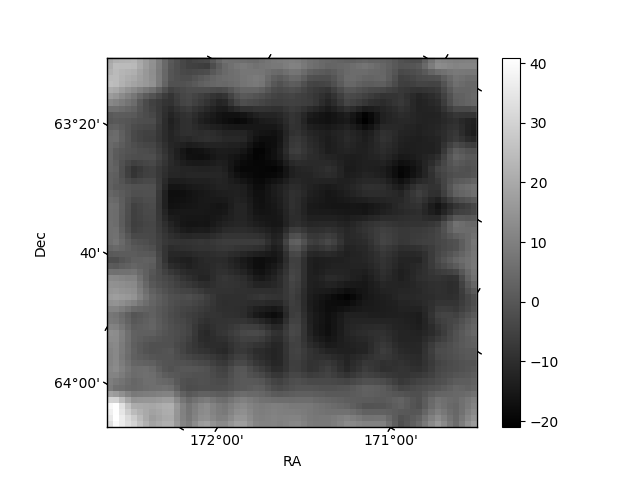
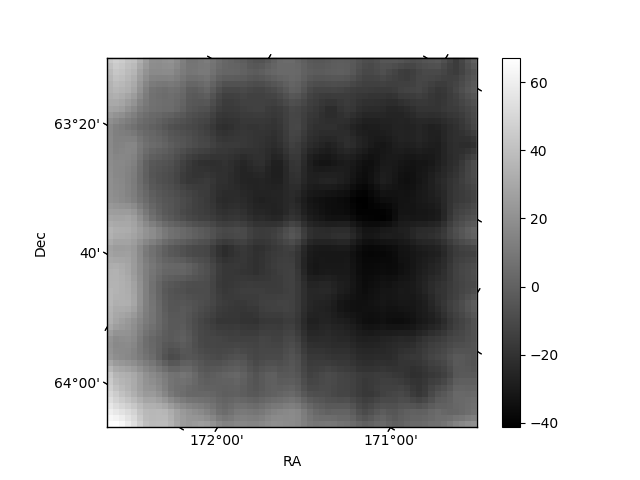
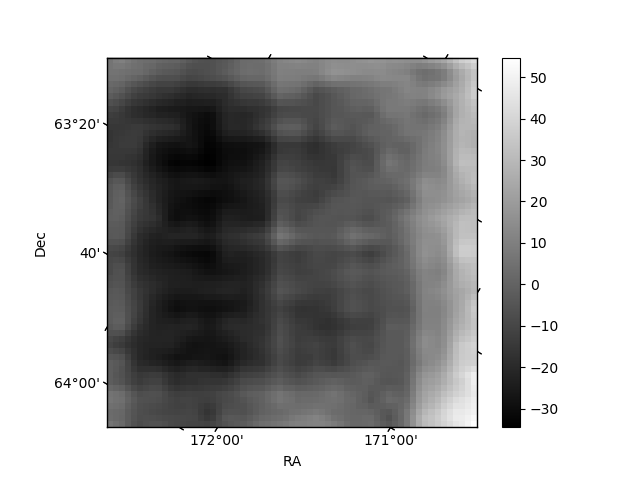
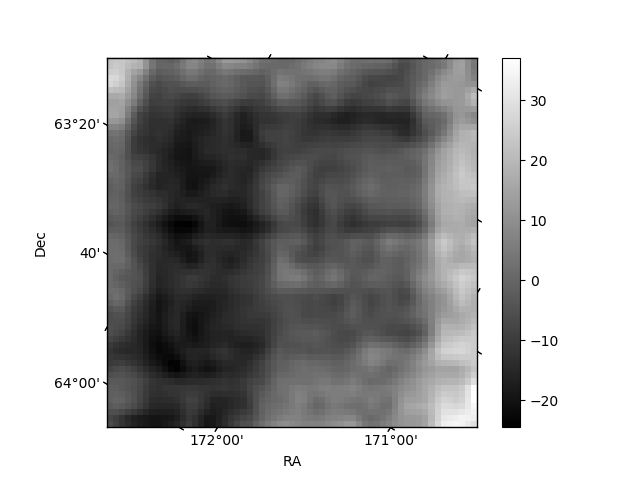
Histogram calculated using DETX and DETY for each event in the final _common_clean file
| Quadrant A | 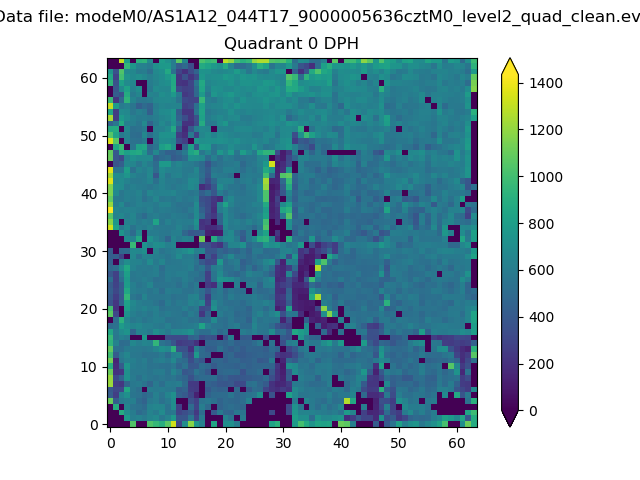 |
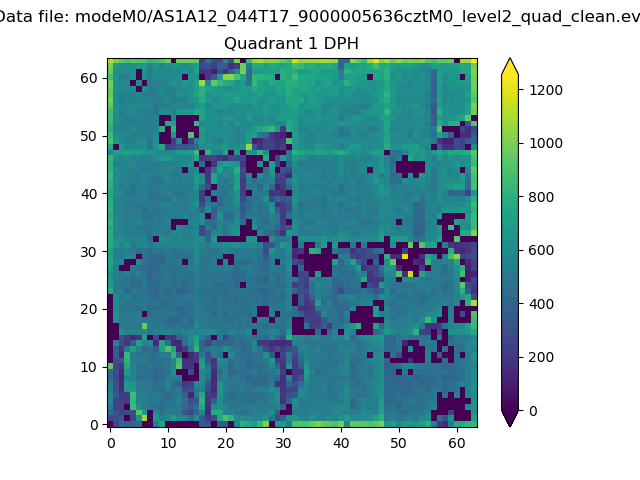 |
Quadrant B |
|---|---|---|---|
| Quadrant D | 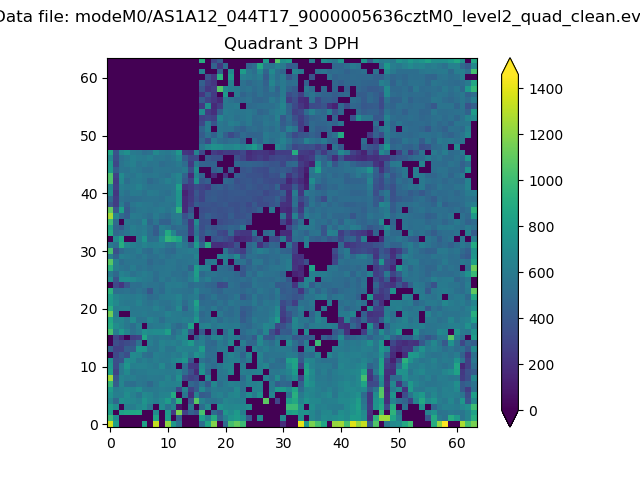 |
 |
Quadrant C |
| Plot type | Count rate plots | Images |
|---|---|---|
| Comparison with Poisson distribution Blue bars denote a histogram of data divided into 1 sec bins. Red curve is a Poisson curve with rate = median count rate of data. |
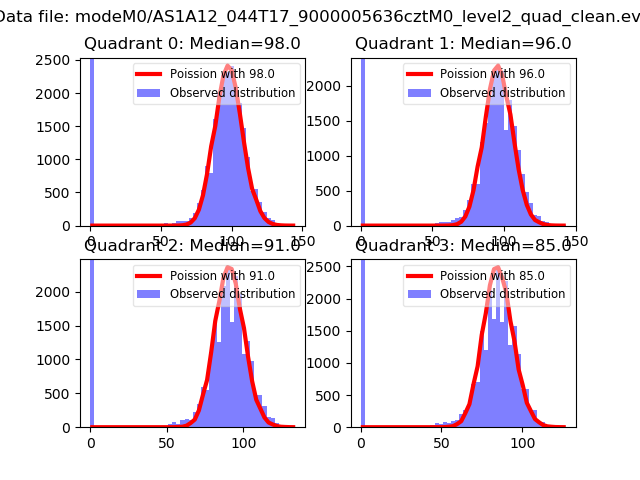 |
 |
| Quadrant-wise count rates Data is divided into 100 sec bins |
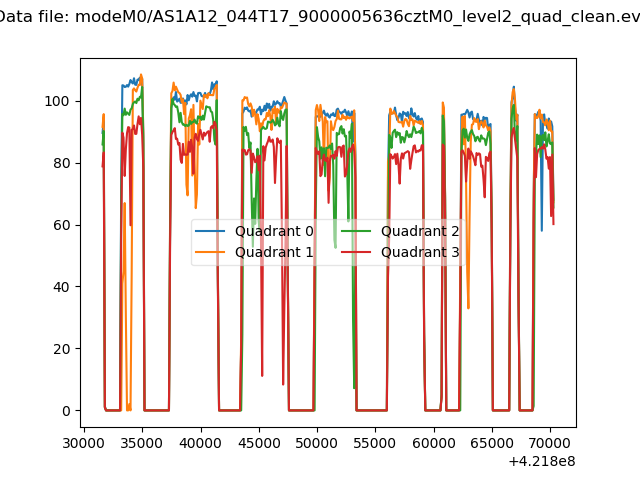 |
|
| Module-wise count rates for Quadrant A Data is divided into 100 sec bins |
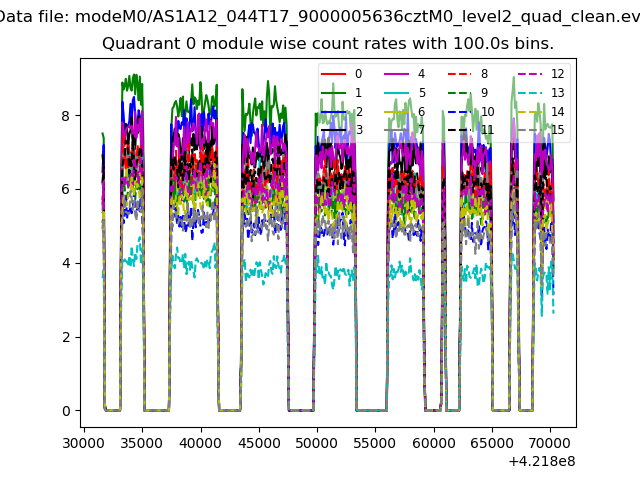 |
 |
| Module-wise count rates for Quadrant B Data is divided into 100 sec bins |
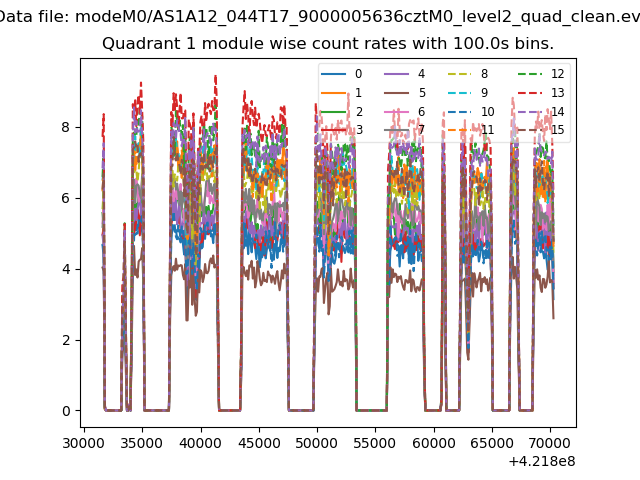 |
 |
| Module-wise count rates for Quadrant C Data is divided into 100 sec bins |
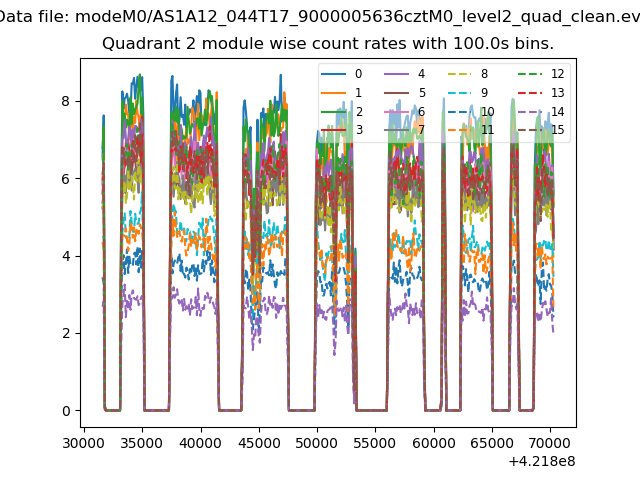 |
 |
| Module-wise count rates for Quadrant D Data is divided into 100 sec bins |
 |
 |
| Parameter | Plot |
|---|---|
| CZT HV Monitor | 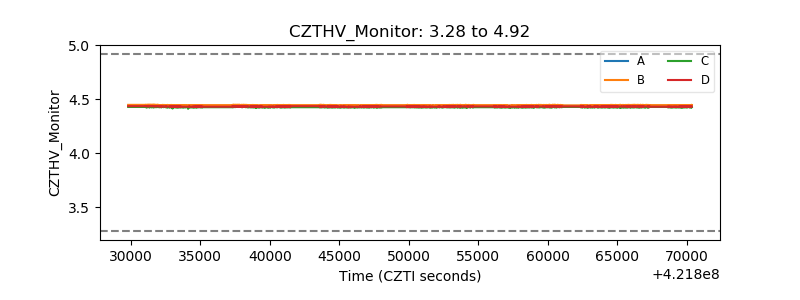 |
| D_VDD | 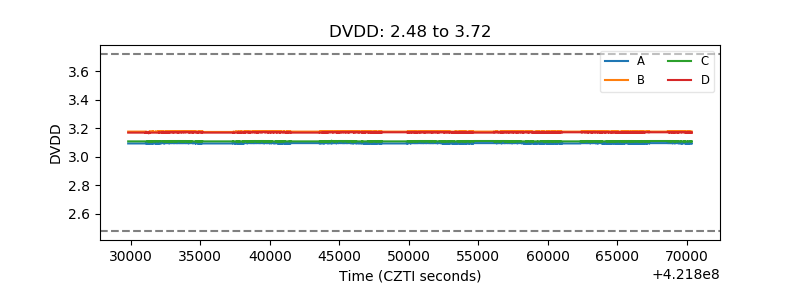 |
| Temperature 1 |  |
| Veto HV Monitor | 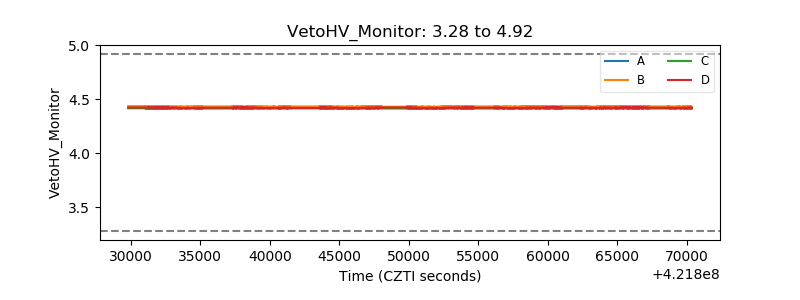 |
| Veto LLD | 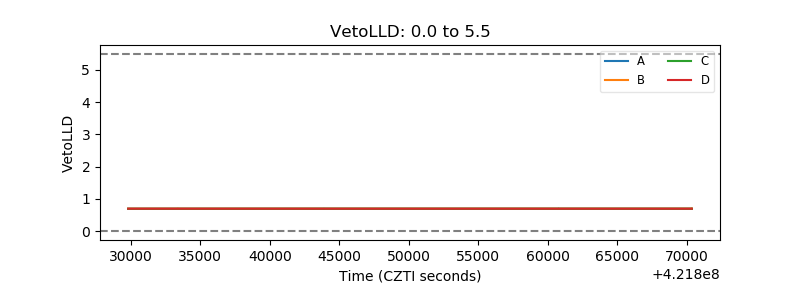 |
| Alpha Counter |  |
| _CPM_Rate | 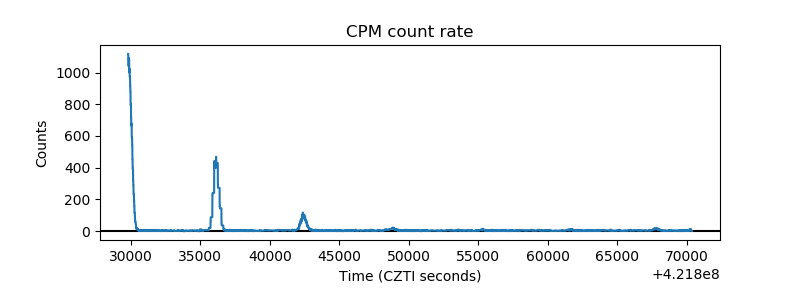 |
| CZT Counter |  |
| +2.5 Volts monitor | 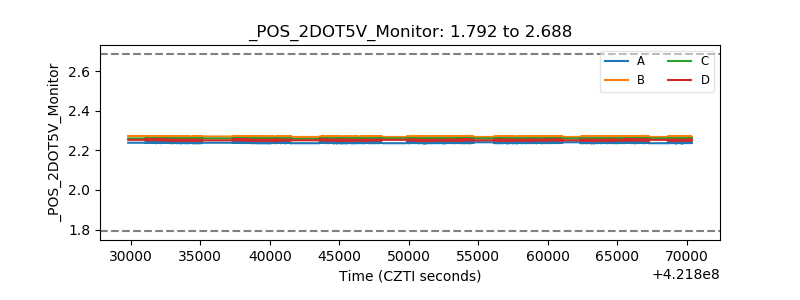 |
| +5 Volts monitor |  |
| _ROLL_ROT | 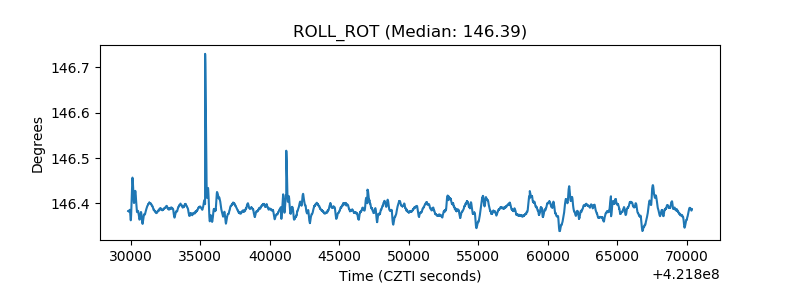 |
| _Roll_DEC | 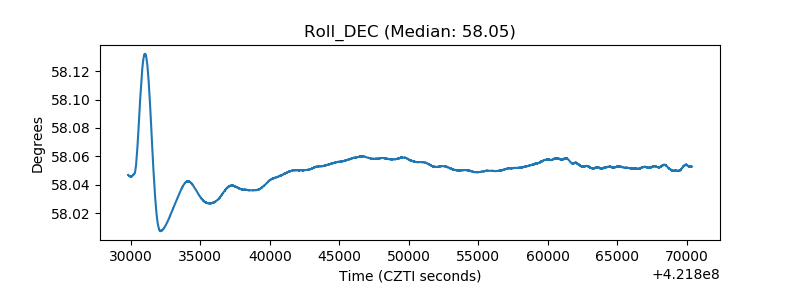 |
| _Roll_RA | 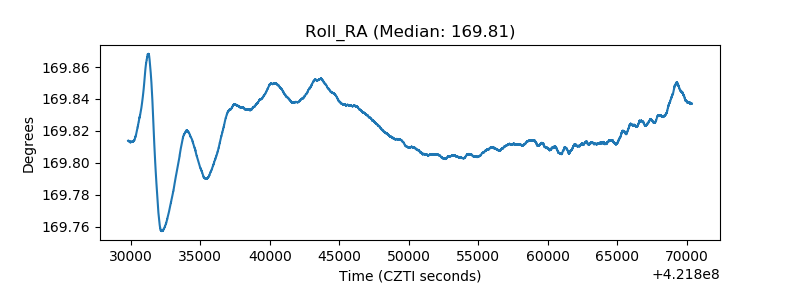 |
| Veto Counter | 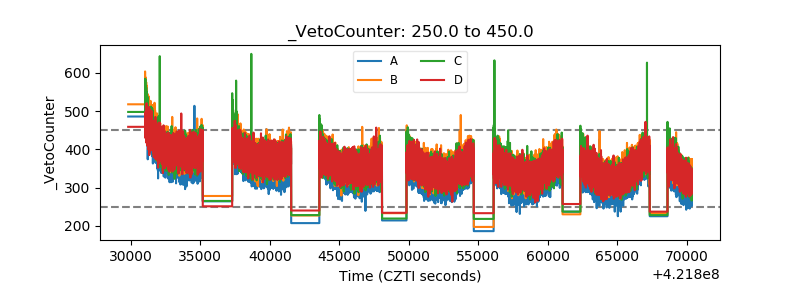 |