| Param | Original file | Final file |
|---|---|---|
| Filename | modeM0/AS1A12_052T04_9000005638cztM0_level2.fits | modeM0/AS1A12_052T04_9000005638cztM0_level2_quad_clean.evt |
| Size (bytes) | 1,185,428,160 | 1,354,829,760 |
| Size | 1.1 GB | 1.3 GB |
| Events in quadrant A | 7,162,666 | 8,522,441 |
| Events in quadrant B | 6,791,052 | 8,431,840 |
| Events in quadrant C | 6,901,958 | 7,840,624 |
| Events in quadrant D | 5,825,410 | 7,027,213 |
| Mode M9 | |||
|---|---|---|---|
| Quadrant | BADHDUFLAG | Total packets | Discarded packets |
| A | 0 | 508 | 0 |
| B | 0 | 508 | 0 |
| C | 0 | 508 | 0 |
| D | 0 | 508 | 0 |
| Mode SS | |||
|---|---|---|---|
| Quadrant | BADHDUFLAG | Total packets | Discarded packets |
| A | 0 | 2750 | 0 |
| B | 0 | 2750 | 0 |
| C | 0 | 2750 | 0 |
| D | 0 | 2750 | 0 |
| Mode M0 | |||
|---|---|---|---|
| Quadrant | BADHDUFLAG | Total packets | Discarded packets |
| A | 0 | 293032 | 0 |
| B | 0 | 293509 | 0 |
| C | 0 | 318460 | 0 |
| D | 0 | 396801 | 0 |
| Quadrant | Total seconds | Saturated seconds | Saturation percentage |
|---|---|---|---|
| A | 134444 | 550 | 0.409092% |
| B | 134444 | 2165 | 1.610336% |
| C | 134444 | 4691 | 3.489185% |
| D | 134444 | 11817 | 8.789533% |
Noise dominated data is calculated using 1-second bins in cleaned event files. If a bin has >2000 counts, and if more than 50% of those come from <1% of pixels, then it is considered to be noise-dominated and hence unusable.
| Quadrant | # 1 sec bins | Bins with >0 counts | Bins with >2000 counts | High rate bins dominated by noise | Noise dominated (total time) | Noise dominated (detector-on time) | Marked lightcurve |
|---|---|---|---|---|---|---|---|
| A | 185295 | 134437 | 0 | 0 | 0.00% | 0.00% |  |
| B | 185294 | 133850 | 0 | 0 | 0.00% | 0.00% |  |
| C | 185295 | 133930 | 0 | 0 | 0.00% | 0.00% | 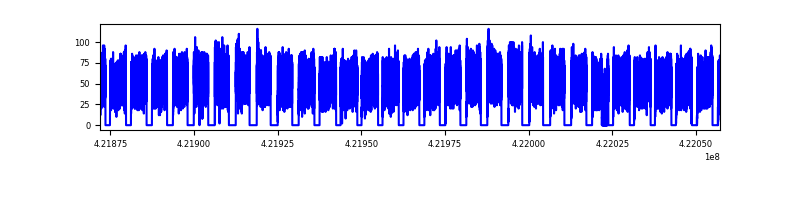 |
| D | 185295 | 133431 | 0 | 0 | 0.00% | 0.00% |  |
Top three noisy pixels from each quadrant. If the there are fewer than three noisy pixels in the level2.evt file, extra rows are filled as -1
| Pixel properties | Quadrant properties | ||||||
|---|---|---|---|---|---|---|---|
| Quadrant | DetID | PixID | Counts | Sigma | Mean | Median | Sigma |
| A | 9 | 19 | 5996 | 9.02 | 1869 | 1746 | 471.2 |
| A | 7 | 110 | 5724 | 8.44 | 1869 | 1746 | 471.2 |
| A | 0 | 29 | 5710 | 8.41 | 1869 | 1746 | 471.2 |
| B | 2 | 9 | 6006 | 12.19 | 1796 | 1709 | 352.4 |
| B | 3 | 80 | 4922 | 9.12 | 1796 | 1709 | 352.4 |
| B | 3 | 17 | 4853 | 8.92 | 1796 | 1709 | 352.4 |
| C | 1 | 81 | 5599 | 8.43 | 1821 | 1704 | 462.2 |
| C | 3 | 202 | 5502 | 8.22 | 1821 | 1704 | 462.2 |
| C | 1 | 80 | 5443 | 8.09 | 1821 | 1704 | 462.2 |
| D | 7 | 3 | 4336 | 6.34 | 1666 | 1516 | 445.0 |
| D | 10 | 189 | 4241 | 6.12 | 1666 | 1516 | 445.0 |
| D | 10 | 113 | 4184 | 6.0 | 1666 | 1516 | 445.0 |
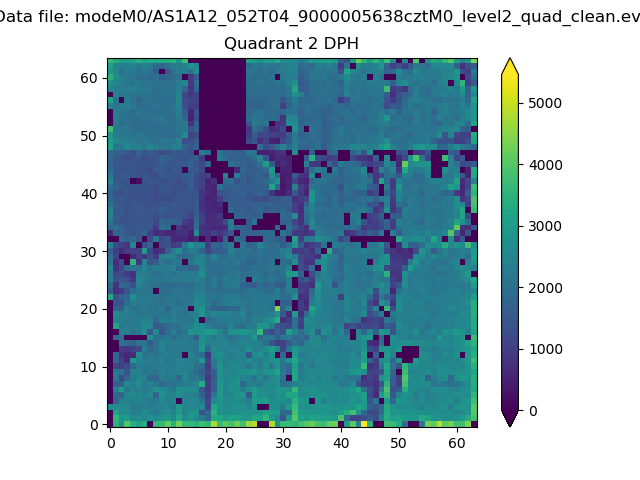
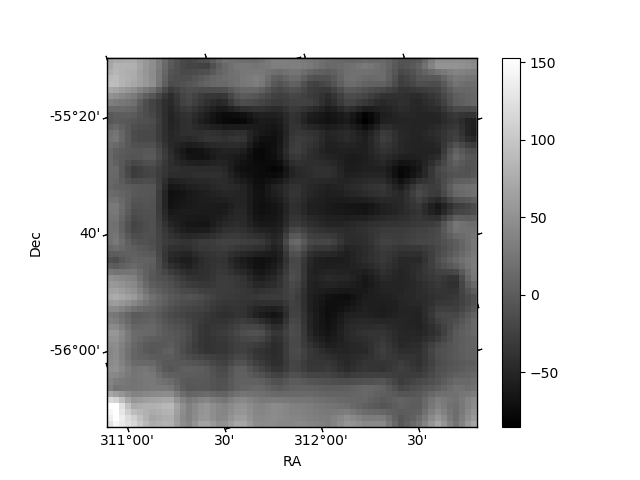
Histogram calculated using DETX and DETY for each event in the final _common_clean file
| Quadrant A |  |
 |
Quadrant B |
|---|---|---|---|
| Quadrant D | 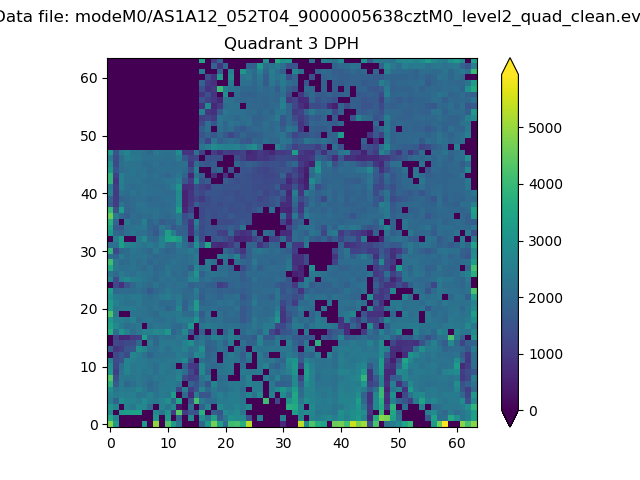 |
 |
Quadrant C |
| Plot type | Count rate plots | Images |
|---|---|---|
| Comparison with Poisson distribution Blue bars denote a histogram of data divided into 1 sec bins. Red curve is a Poisson curve with rate = median count rate of data. |
 |
 |
| Quadrant-wise count rates Data is divided into 100 sec bins |
 |
|
| Module-wise count rates for Quadrant A Data is divided into 100 sec bins |
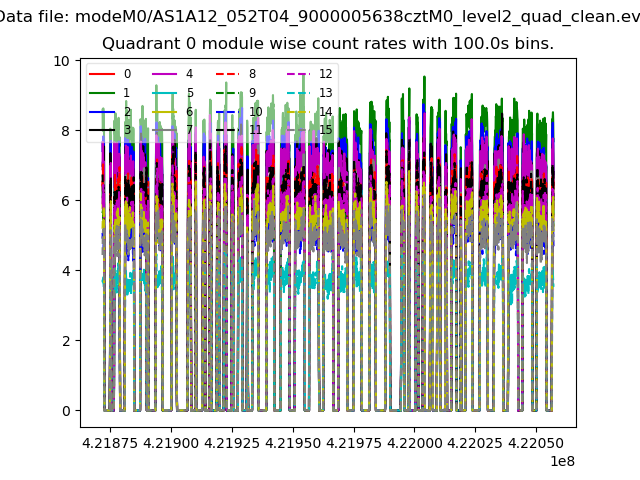 |
 |
| Module-wise count rates for Quadrant B Data is divided into 100 sec bins |
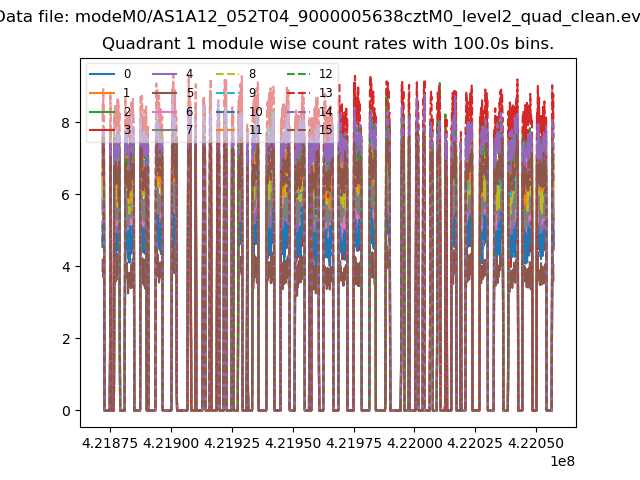 |
 |
| Module-wise count rates for Quadrant C Data is divided into 100 sec bins |
 |
 |
| Module-wise count rates for Quadrant D Data is divided into 100 sec bins |
 |
 |
| Parameter | Plot |
|---|---|
| CZT HV Monitor |  |
| D_VDD |  |
| Temperature 1 |  |
| Veto HV Monitor | 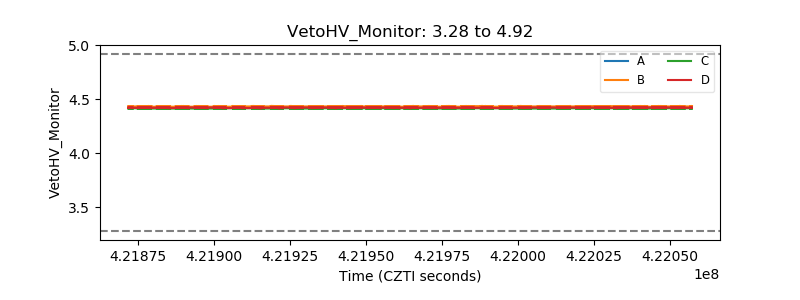 |
| Veto LLD |  |
| Alpha Counter |  |
| _CPM_Rate |  |
| CZT Counter |  |
| +2.5 Volts monitor | 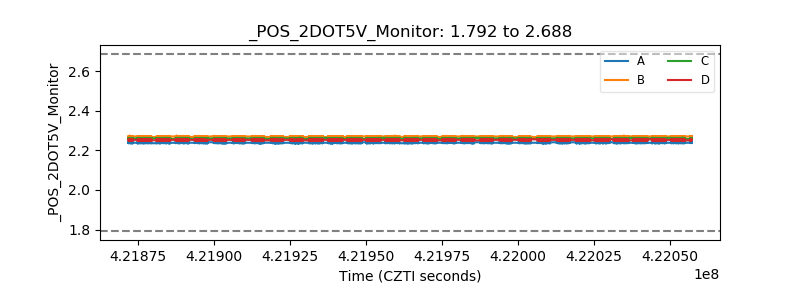 |
| +5 Volts monitor | 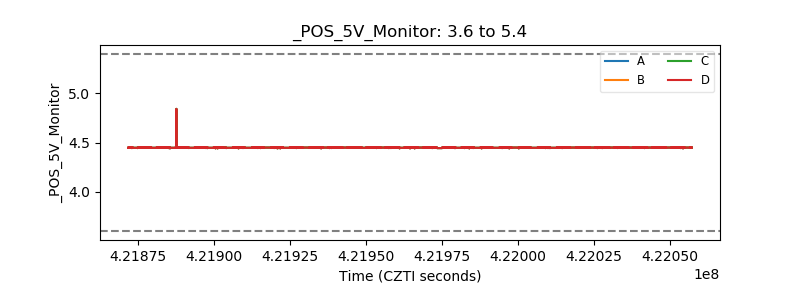 |
| _ROLL_ROT |  |
| _Roll_DEC | 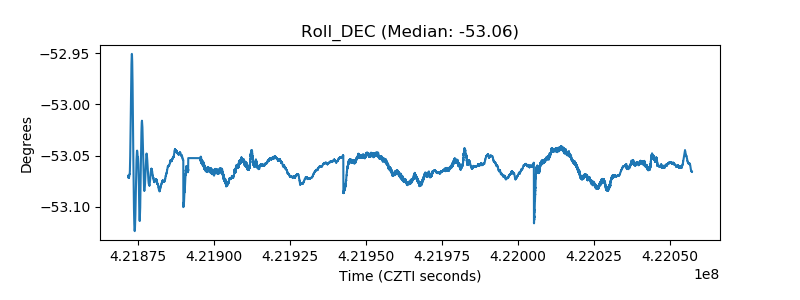 |
| _Roll_RA |  |
| Veto Counter |  |