| Param | Original file | Final file |
|---|---|---|
| Filename | modeM0/AS1A12_011T42_9000005640cztM0_level2.fits | modeM0/AS1A12_011T42_9000005640cztM0_level2_quad_clean.evt |
| Size (bytes) | 400,368,960 | 416,292,480 |
| Size | 381.8 MB | 397.0 MB |
| Events in quadrant A | 2,439,478 | 2,544,065 |
| Events in quadrant B | 2,340,744 | 2,561,291 |
| Events in quadrant C | 2,331,808 | 2,383,062 |
| Events in quadrant D | 2,003,532 | 2,110,420 |
| Mode SS | |||
|---|---|---|---|
| Quadrant | BADHDUFLAG | Total packets | Discarded packets |
| A | 0 | 896 | 0 |
| B | 0 | 896 | 0 |
| C | 0 | 896 | 0 |
| D | 0 | 896 | 0 |
| Mode M9 | |||
|---|---|---|---|
| Quadrant | BADHDUFLAG | Total packets | Discarded packets |
| A | 0 | 179 | 0 |
| B | 0 | 179 | 0 |
| C | 0 | 179 | 0 |
| D | 0 | 179 | 0 |
| Mode M0 | |||
|---|---|---|---|
| Quadrant | BADHDUFLAG | Total packets | Discarded packets |
| A | 0 | 93704 | 0 |
| B | 0 | 89237 | 0 |
| C | 0 | 96030 | 0 |
| D | 0 | 118758 | 0 |
| Quadrant | Total seconds | Saturated seconds | Saturation percentage |
|---|---|---|---|
| A | 43832 | 80 | 0.182515% |
| B | 43832 | 55 | 0.125479% |
| C | 43832 | 1006 | 2.295127% |
| D | 43832 | 2321 | 5.295218% |
Noise dominated data is calculated using 1-second bins in cleaned event files. If a bin has >2000 counts, and if more than 50% of those come from <1% of pixels, then it is considered to be noise-dominated and hence unusable.
| Quadrant | # 1 sec bins | Bins with >0 counts | Bins with >2000 counts | High rate bins dominated by noise | Noise dominated (total time) | Noise dominated (detector-on time) | Marked lightcurve |
|---|---|---|---|---|---|---|---|
| A | 61793 | 43831 | 0 | 0 | 0.00% | 0.00% | 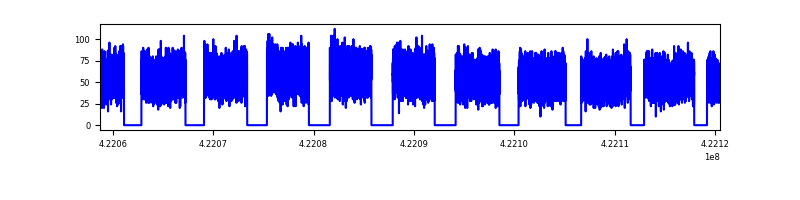 |
| B | 61793 | 43832 | 0 | 0 | 0.00% | 0.00% |  |
| C | 61793 | 43755 | 0 | 0 | 0.00% | 0.00% |  |
| D | 61793 | 43807 | 0 | 0 | 0.00% | 0.00% |  |
Top three noisy pixels from each quadrant. If the there are fewer than three noisy pixels in the level2.evt file, extra rows are filled as -1
| Pixel properties | Quadrant properties | ||||||
|---|---|---|---|---|---|---|---|
| Quadrant | DetID | PixID | Counts | Sigma | Mean | Median | Sigma |
| A | 7 | 110 | 1972 | 8.54 | 635 | 595 | 161.2 |
| A | 9 | 19 | 1913 | 8.17 | 635 | 595 | 161.2 |
| A | 0 | 29 | 1864 | 7.87 | 635 | 595 | 161.2 |
| B | 2 | 9 | 2035 | 11.83 | 618 | 588 | 122.3 |
| B | 3 | 80 | 1646 | 8.65 | 618 | 588 | 122.3 |
| B | 2 | 8 | 1632 | 8.53 | 618 | 588 | 122.3 |
| C | 1 | 81 | 1859 | 8.01 | 616 | 576 | 160.2 |
| C | 1 | 80 | 1776 | 7.49 | 616 | 576 | 160.2 |
| C | 3 | 203 | 1748 | 7.31 | 616 | 576 | 160.2 |
| D | 7 | 3 | 1454 | 6.02 | 573 | 521 | 155.0 |
| D | 4 | 160 | 1431 | 5.87 | 573 | 521 | 155.0 |
| D | 10 | 113 | 1423 | 5.82 | 573 | 521 | 155.0 |
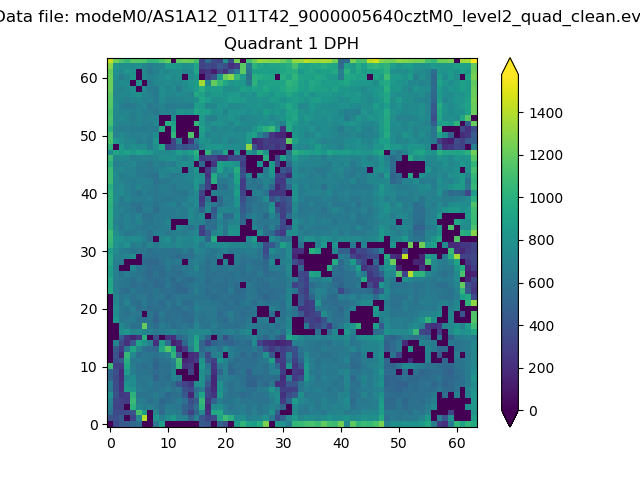
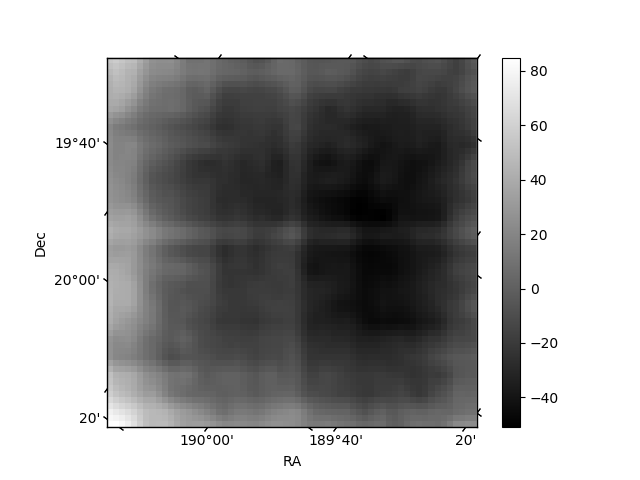
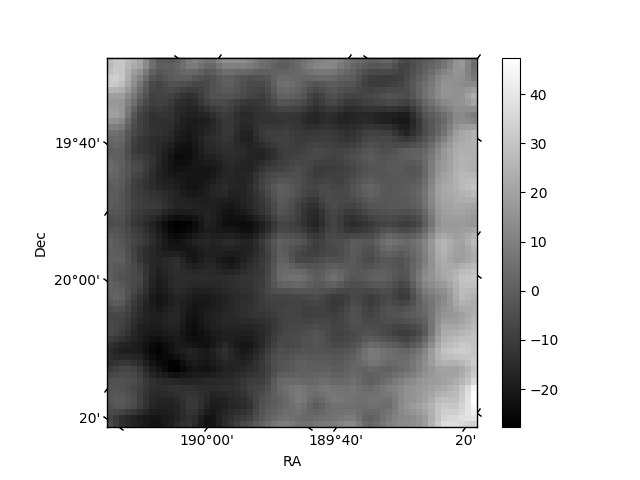
Histogram calculated using DETX and DETY for each event in the final _common_clean file
| Quadrant A |  |
 |
Quadrant B |
|---|---|---|---|
| Quadrant D | 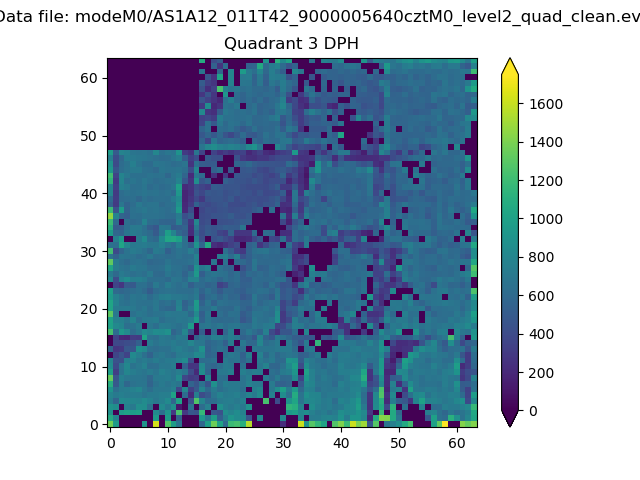 |
 |
Quadrant C |
| Plot type | Count rate plots | Images |
|---|---|---|
| Comparison with Poisson distribution Blue bars denote a histogram of data divided into 1 sec bins. Red curve is a Poisson curve with rate = median count rate of data. |
 |
 |
| Quadrant-wise count rates Data is divided into 100 sec bins |
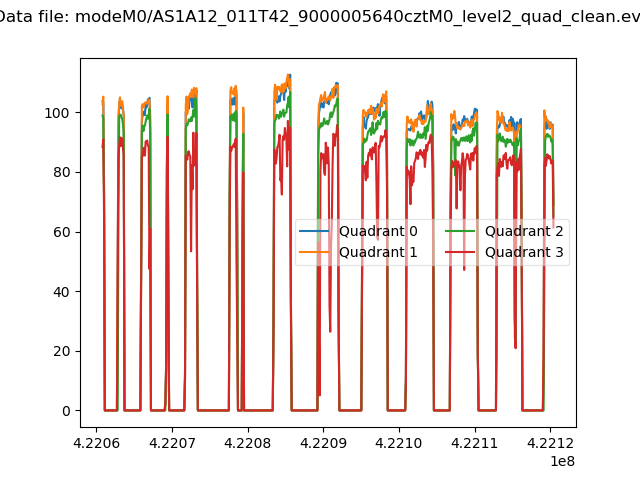 |
|
| Module-wise count rates for Quadrant A Data is divided into 100 sec bins |
 |
 |
| Module-wise count rates for Quadrant B Data is divided into 100 sec bins |
 |
 |
| Module-wise count rates for Quadrant C Data is divided into 100 sec bins |
 |
 |
| Module-wise count rates for Quadrant D Data is divided into 100 sec bins |
 |
 |
| Parameter | Plot |
|---|---|
| CZT HV Monitor |  |
| D_VDD | 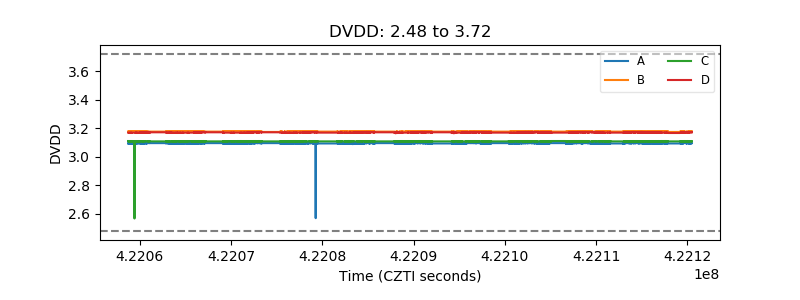 |
| Temperature 1 | 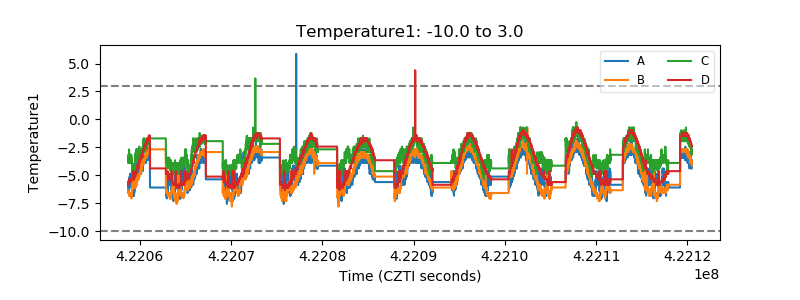 |
| Veto HV Monitor |  |
| Veto LLD | 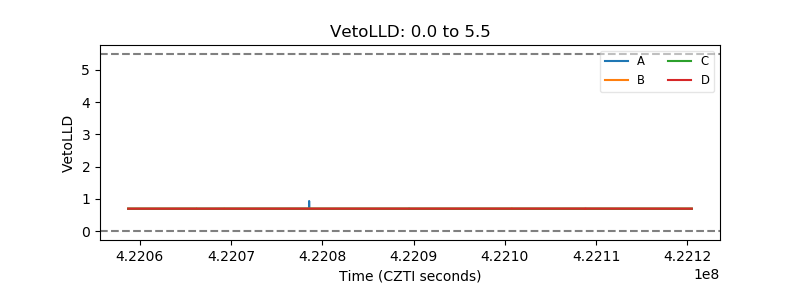 |
| Alpha Counter |  |
| _CPM_Rate |  |
| CZT Counter |  |
| +2.5 Volts monitor |  |
| +5 Volts monitor |  |
| _ROLL_ROT |  |
| _Roll_DEC |  |
| _Roll_RA |  |
| Veto Counter |  |