| Param | Original file | Final file |
|---|---|---|
| Filename | modeM0/AS1A12_025T08_9000005644cztM0_level2.fits | modeM0/AS1A12_025T08_9000005644cztM0_level2_quad_clean.evt |
| Size (bytes) | 90,426,240 | 80,582,400 |
| Size | 86.2 MB | 76.8 MB |
| Events in quadrant A | 538,640 | 471,351 |
| Events in quadrant B | 517,064 | 469,642 |
| Events in quadrant C | 522,832 | 423,554 |
| Events in quadrant D | 436,122 | 351,250 |
| Mode SS | |||
|---|---|---|---|
| Quadrant | BADHDUFLAG | Total packets | Discarded packets |
| A | 0 | 212 | 0 |
| B | 0 | 212 | 0 |
| C | 0 | 212 | 0 |
| D | 0 | 212 | 0 |
| Mode M9 | |||
|---|---|---|---|
| Quadrant | BADHDUFLAG | Total packets | Discarded packets |
| A | 0 | 29 | 0 |
| B | 0 | 29 | 0 |
| C | 0 | 29 | 0 |
| D | 0 | 29 | 0 |
| Mode M0 | |||
|---|---|---|---|
| Quadrant | BADHDUFLAG | Total packets | Discarded packets |
| A | 0 | 23509 | 0 |
| B | 0 | 21934 | 0 |
| C | 0 | 22608 | 0 |
| D | 0 | 33836 | 0 |
| Quadrant | Total seconds | Saturated seconds | Saturation percentage |
|---|---|---|---|
| A | 10451 | 45 | 0.430581% |
| B | 10451 | 27 | 0.258348% |
| C | 10451 | 206 | 1.971103% |
| D | 10451 | 1248 | 11.941441% |
Noise dominated data is calculated using 1-second bins in cleaned event files. If a bin has >2000 counts, and if more than 50% of those come from <1% of pixels, then it is considered to be noise-dominated and hence unusable.
| Quadrant | # 1 sec bins | Bins with >0 counts | Bins with >2000 counts | High rate bins dominated by noise | Noise dominated (total time) | Noise dominated (detector-on time) | Marked lightcurve |
|---|---|---|---|---|---|---|---|
| A | 13315 | 10450 | 0 | 0 | 0.00% | 0.00% | 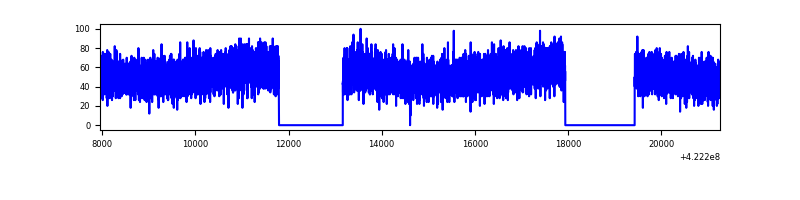 |
| B | 13315 | 10451 | 0 | 0 | 0.00% | 0.00% | 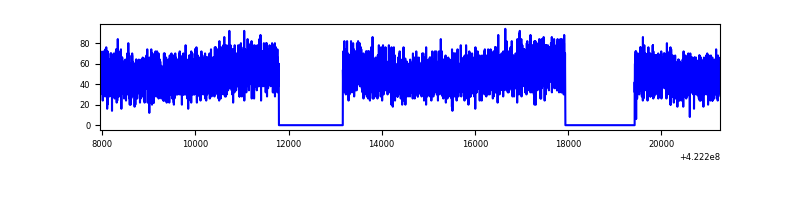 |
| C | 13315 | 10427 | 0 | 0 | 0.00% | 0.00% | 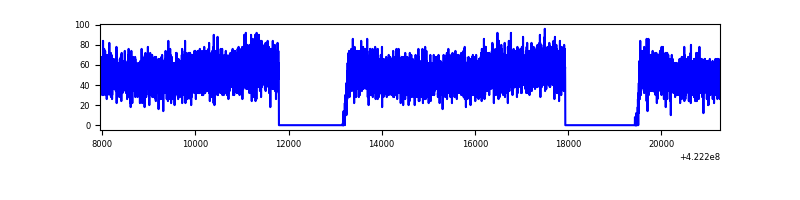 |
| D | 13315 | 10443 | 0 | 0 | 0.00% | 0.00% | 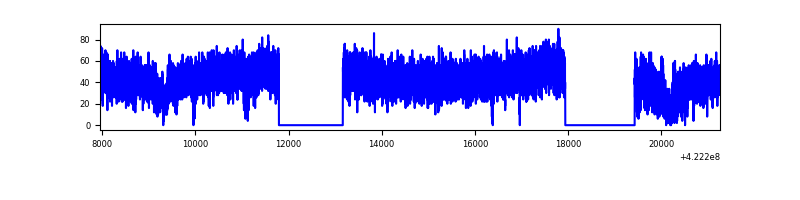 |
Top three noisy pixels from each quadrant. If the there are fewer than three noisy pixels in the level2.evt file, extra rows are filled as -1
| Pixel properties | Quadrant properties | ||||||
|---|---|---|---|---|---|---|---|
| Quadrant | DetID | PixID | Counts | Sigma | Mean | Median | Sigma |
| A | 9 | 19 | 478 | 9.08 | 140 | 131 | 38.2 |
| A | 0 | 29 | 429 | 7.8 | 140 | 131 | 38.2 |
| A | 7 | 110 | 415 | 7.43 | 140 | 131 | 38.2 |
| B | 2 | 9 | 420 | 9.83 | 136 | 129 | 29.6 |
| B | 3 | 80 | 373 | 8.24 | 136 | 129 | 29.6 |
| B | 5 | 128 | 361 | 7.83 | 136 | 129 | 29.6 |
| C | 1 | 80 | 483 | 9.4 | 138 | 129 | 37.6 |
| C | 1 | 81 | 472 | 9.11 | 138 | 129 | 37.6 |
| C | 3 | 203 | 394 | 7.04 | 138 | 129 | 37.6 |
| D | 7 | 3 | 345 | 6.53 | 124 | 113 | 35.5 |
| D | 6 | 67 | 340 | 6.39 | 124 | 113 | 35.5 |
| D | 13 | 238 | 327 | 6.02 | 124 | 113 | 35.5 |
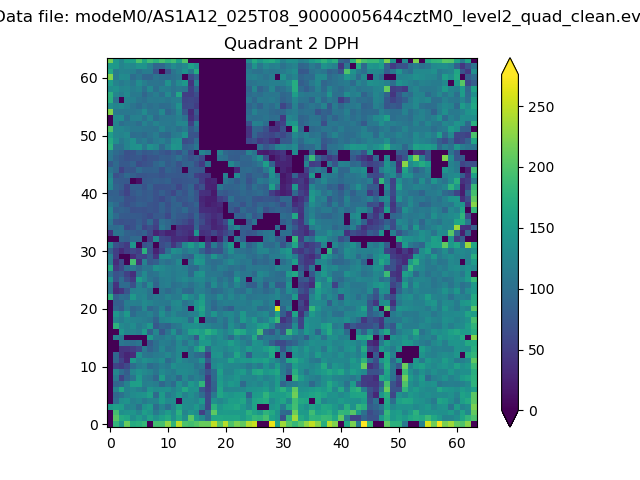
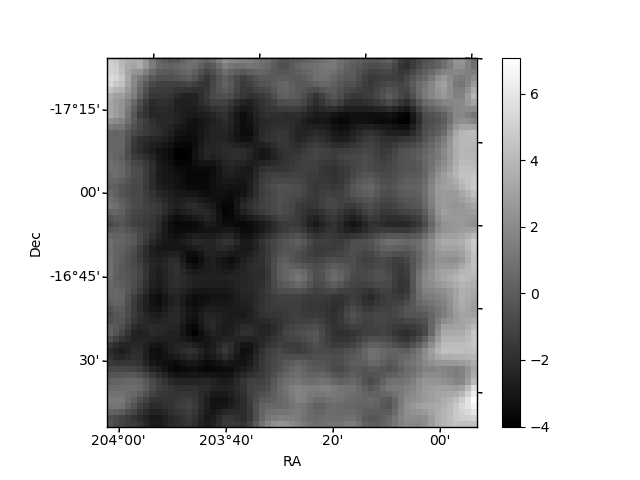
Histogram calculated using DETX and DETY for each event in the final _common_clean file
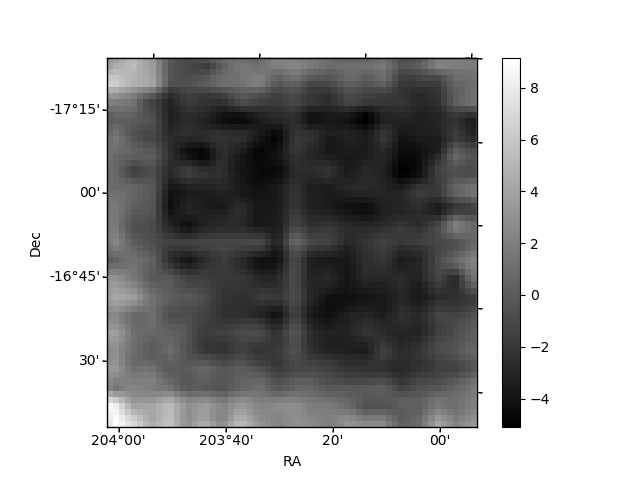
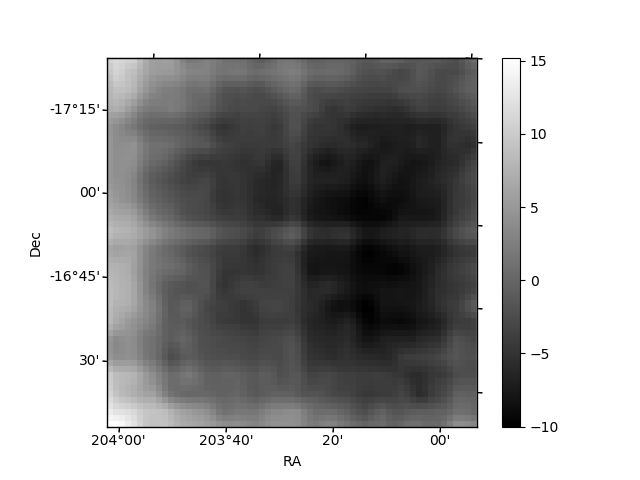
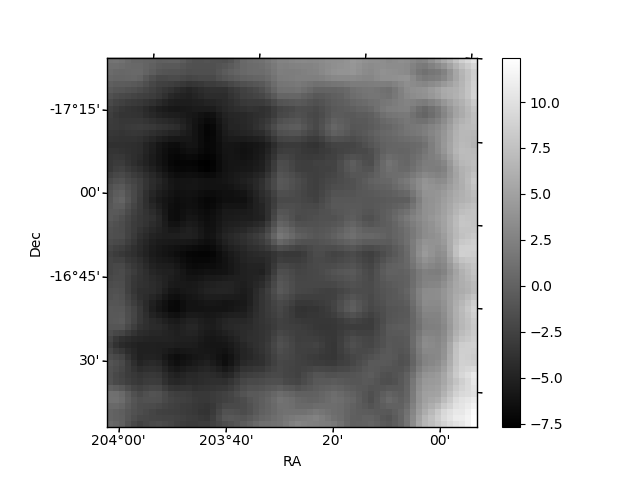
| Quadrant A | 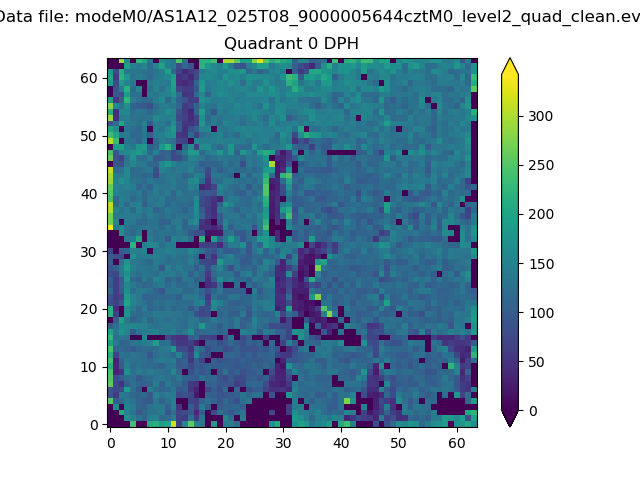 |
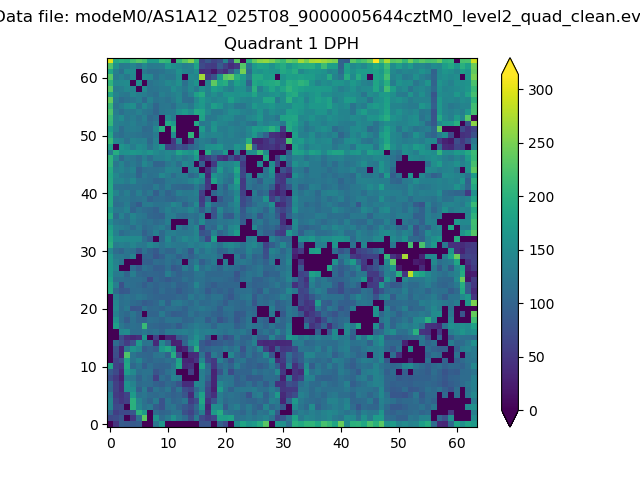 |
Quadrant B |
|---|---|---|---|
| Quadrant D | 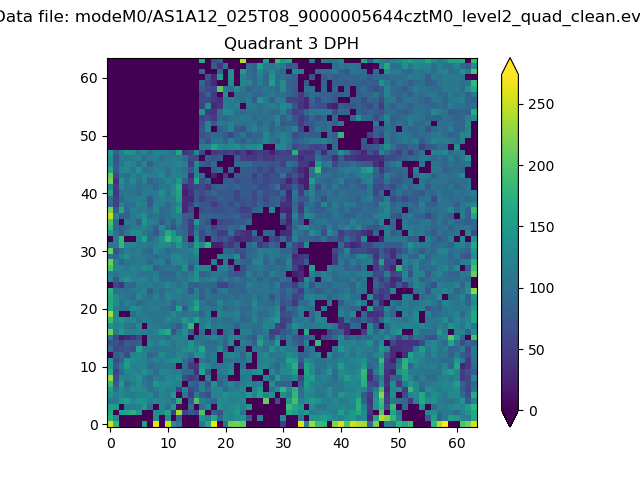 |
 |
Quadrant C |
| Plot type | Count rate plots | Images |
|---|---|---|
| Comparison with Poisson distribution Blue bars denote a histogram of data divided into 1 sec bins. Red curve is a Poisson curve with rate = median count rate of data. |
 |
 |
| Quadrant-wise count rates Data is divided into 100 sec bins |
 |
|
| Module-wise count rates for Quadrant A Data is divided into 100 sec bins |
 |
 |
| Module-wise count rates for Quadrant B Data is divided into 100 sec bins |
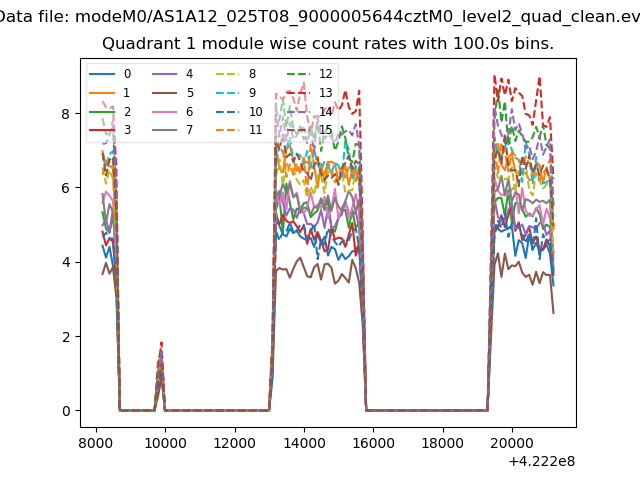 |
 |
| Module-wise count rates for Quadrant C Data is divided into 100 sec bins |
 |
 |
| Module-wise count rates for Quadrant D Data is divided into 100 sec bins |
 |
 |
| Parameter | Plot |
|---|---|
| CZT HV Monitor |  |
| D_VDD | 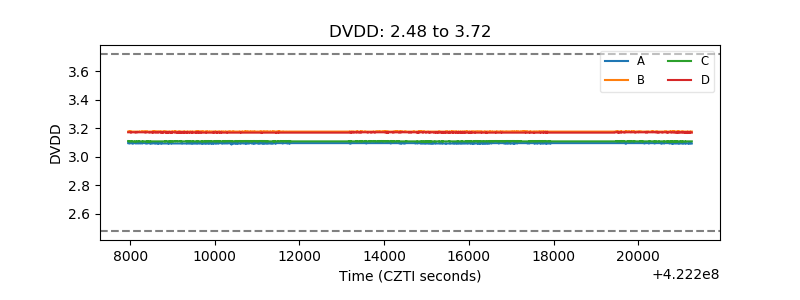 |
| Temperature 1 |  |
| Veto HV Monitor |  |
| Veto LLD | 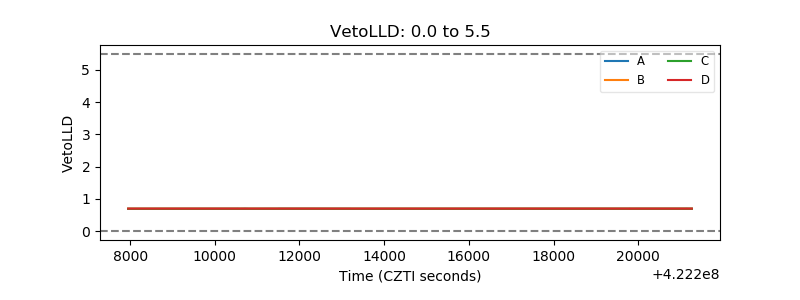 |
| Alpha Counter | 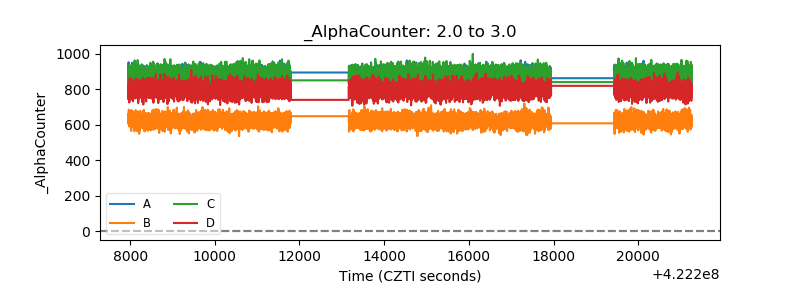 |
| _CPM_Rate | 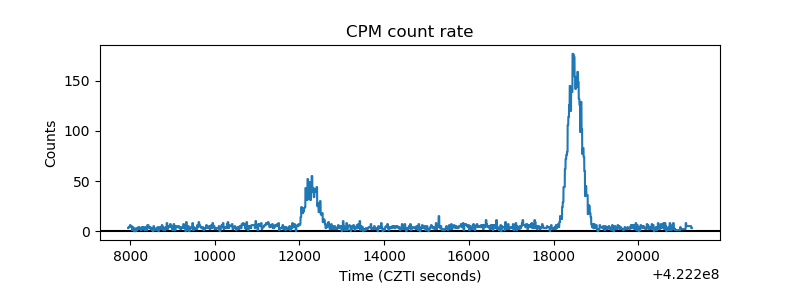 |
| CZT Counter | 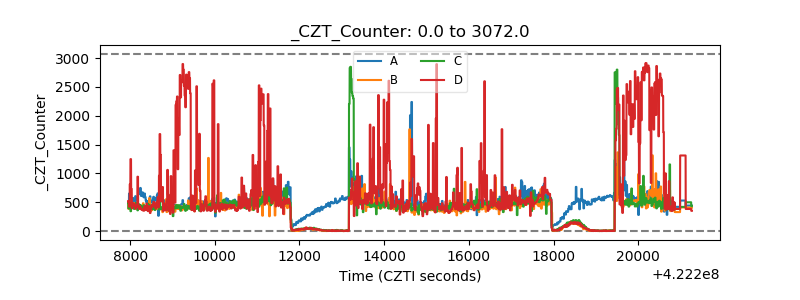 |
| +2.5 Volts monitor | 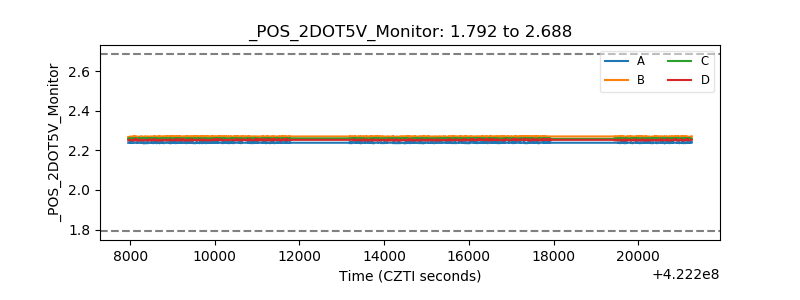 |
| +5 Volts monitor | 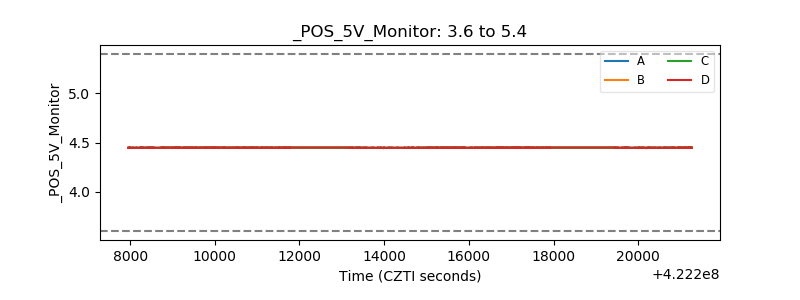 |
| _ROLL_ROT | 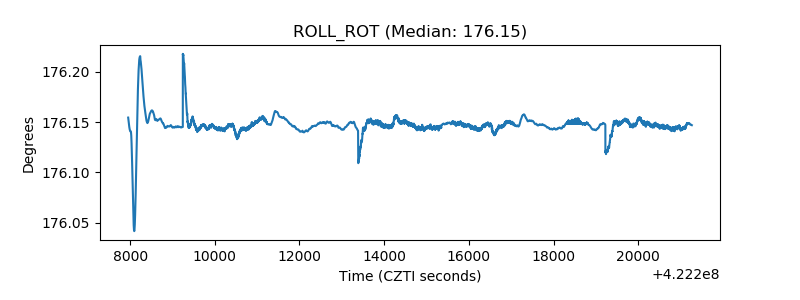 |
| _Roll_DEC | 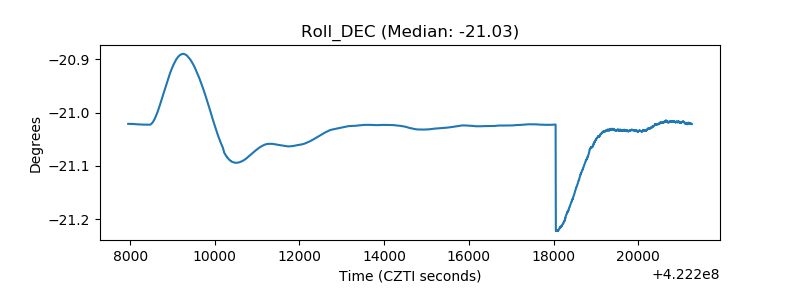 |
| _Roll_RA | 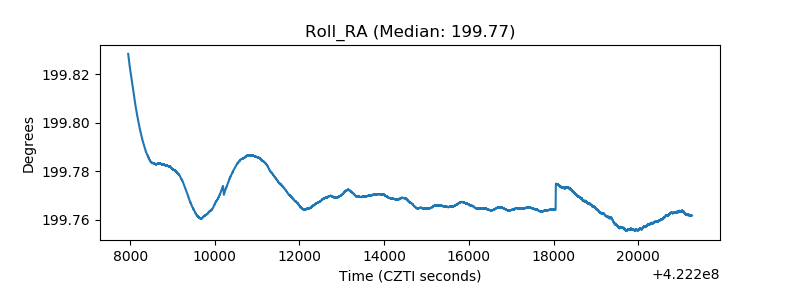 |
| Veto Counter | 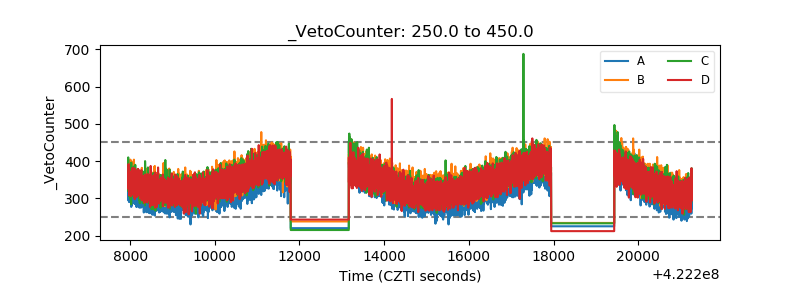 |