| Param | Original file | Final file |
|---|---|---|
| Filename | modeM0/AS1A12_025T14_9000005646cztM0_level2.fits | modeM0/AS1A12_025T14_9000005646cztM0_level2_quad_clean.evt |
| Size (bytes) | 252,541,440 | 192,476,160 |
| Size | 240.8 MB | 183.6 MB |
| Events in quadrant A | 1,542,666 | 1,042,828 |
| Events in quadrant B | 1,481,928 | 1,052,477 |
| Events in quadrant C | 1,458,998 | 980,873 |
| Events in quadrant D | 1,282,528 | 869,706 |
| Mode SS | |||
|---|---|---|---|
| Quadrant | BADHDUFLAG | Total packets | Discarded packets |
| A | 0 | 558 | 0 |
| B | 0 | 558 | 0 |
| C | 0 | 558 | 0 |
| D | 0 | 558 | 0 |
| Mode M0 | |||
|---|---|---|---|
| Quadrant | BADHDUFLAG | Total packets | Discarded packets |
| A | 0 | 58914 | 0 |
| B | 0 | 61921 | 0 |
| C | 0 | 62413 | 0 |
| D | 0 | 67963 | 0 |
| Mode M9 | |||
|---|---|---|---|
| Quadrant | BADHDUFLAG | Total packets | Discarded packets |
| A | 0 | 114 | 0 |
| B | 0 | 114 | 0 |
| C | 0 | 114 | 0 |
| D | 0 | 114 | 0 |
| Quadrant | Total seconds | Saturated seconds | Saturation percentage |
|---|---|---|---|
| A | 27373 | 42 | 0.153436% |
| B | 27373 | 177 | 0.646623% |
| C | 27373 | 862 | 3.149089% |
| D | 27373 | 827 | 3.021225% |
Noise dominated data is calculated using 1-second bins in cleaned event files. If a bin has >2000 counts, and if more than 50% of those come from <1% of pixels, then it is considered to be noise-dominated and hence unusable.
| Quadrant | # 1 sec bins | Bins with >0 counts | Bins with >2000 counts | High rate bins dominated by noise | Noise dominated (total time) | Noise dominated (detector-on time) | Marked lightcurve |
|---|---|---|---|---|---|---|---|
| A | 38789 | 27373 | 0 | 0 | 0.00% | 0.00% |  |
| B | 38789 | 27372 | 0 | 0 | 0.00% | 0.00% |  |
| C | 38789 | 27202 | 0 | 0 | 0.00% | 0.00% |  |
| D | 38789 | 27349 | 0 | 0 | 0.00% | 0.00% | 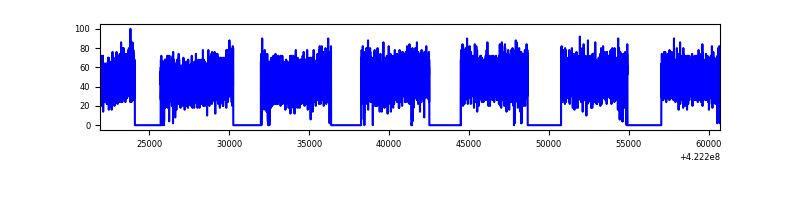 |
Top three noisy pixels from each quadrant. If the there are fewer than three noisy pixels in the level2.evt file, extra rows are filled as -1
| Pixel properties | Quadrant properties | ||||||
|---|---|---|---|---|---|---|---|
| Quadrant | DetID | PixID | Counts | Sigma | Mean | Median | Sigma |
| A | 9 | 19 | 1283 | 8.85 | 402 | 377 | 102.4 |
| A | 0 | 29 | 1273 | 8.75 | 402 | 377 | 102.4 |
| A | 7 | 110 | 1271 | 8.73 | 402 | 377 | 102.4 |
| B | 2 | 9 | 1272 | 11.26 | 391 | 372 | 79.9 |
| B | 3 | 80 | 1039 | 8.35 | 391 | 372 | 79.9 |
| B | 3 | 17 | 1015 | 8.05 | 391 | 372 | 79.9 |
| C | 1 | 81 | 1162 | 7.78 | 386 | 361 | 102.9 |
| C | 1 | 80 | 1117 | 7.34 | 386 | 361 | 102.9 |
| C | 9 | 233 | 1001 | 6.22 | 386 | 361 | 102.9 |
| D | 7 | 3 | 990 | 6.55 | 367 | 334 | 100.1 |
| D | 10 | 189 | 912 | 5.78 | 367 | 334 | 100.1 |
| D | 6 | 62 | 908 | 5.74 | 367 | 334 | 100.1 |
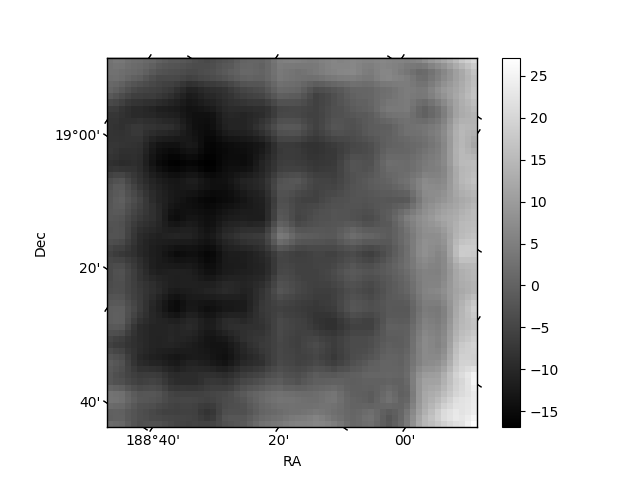
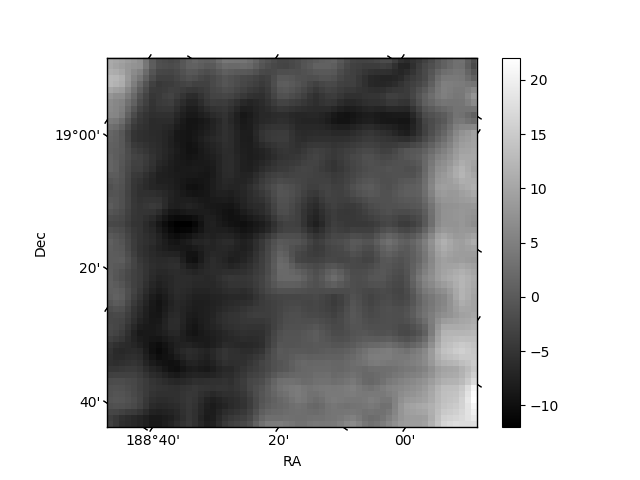
Histogram calculated using DETX and DETY for each event in the final _common_clean file
| Quadrant A |  |
 |
Quadrant B |
|---|---|---|---|
| Quadrant D | 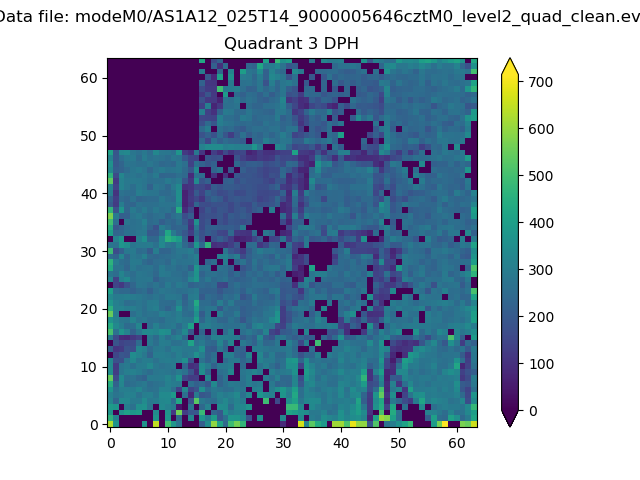 |
 |
Quadrant C |
| Plot type | Count rate plots | Images |
|---|---|---|
| Comparison with Poisson distribution Blue bars denote a histogram of data divided into 1 sec bins. Red curve is a Poisson curve with rate = median count rate of data. |
 |
 |
| Quadrant-wise count rates Data is divided into 100 sec bins |
 |
|
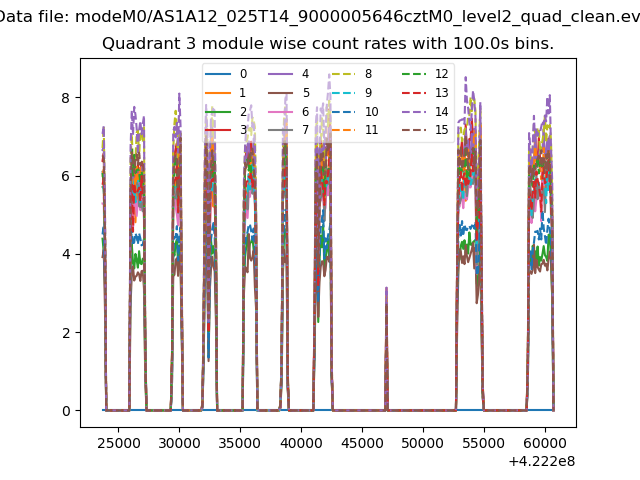
| Module-wise count rates for Quadrant A Data is divided into 100 sec bins |
 |
 |
| Module-wise count rates for Quadrant B Data is divided into 100 sec bins |
 |
 |
| Module-wise count rates for Quadrant C Data is divided into 100 sec bins |
 |
 |
| Module-wise count rates for Quadrant D Data is divided into 100 sec bins |
 |
 |
| Parameter | Plot |
|---|---|
| CZT HV Monitor |  |
| D_VDD | 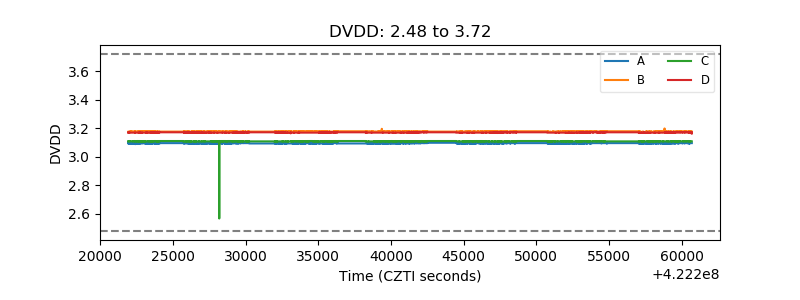 |
| Temperature 1 |  |
| Veto HV Monitor |  |
| Veto LLD |  |
| Alpha Counter |  |
| _CPM_Rate | 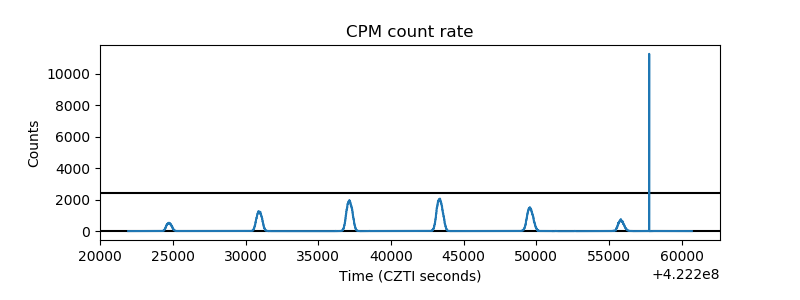 |
| CZT Counter | 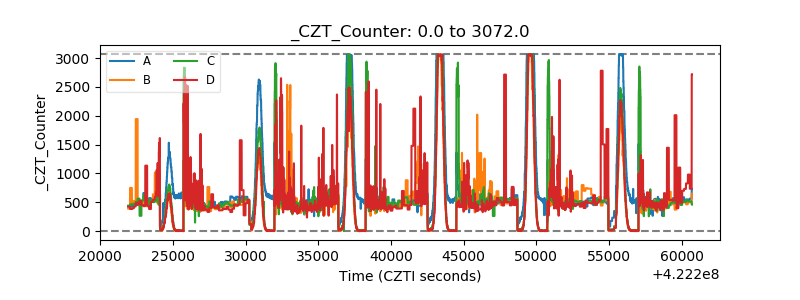 |
| +2.5 Volts monitor |  |
| +5 Volts monitor |  |
| _ROLL_ROT |  |
| _Roll_DEC |  |
| _Roll_RA |  |
| Veto Counter |  |