| Param | Original file | Final file |
|---|---|---|
| Filename | modeM0/AS1A12_037T03_9000005654cztM0_level2.fits | modeM0/AS1A12_037T03_9000005654cztM0_level2_quad_clean.evt |
| Size (bytes) | 66,885,120 | 79,329,600 |
| Size | 63.8 MB | 75.7 MB |
| Events in quadrant A | 401,424 | 524,930 |
| Events in quadrant B | 350,904 | 390,640 |
| Events in quadrant C | 386,192 | 487,989 |
| Events in quadrant D | 344,278 | 456,011 |
| Mode M9 | |||
|---|---|---|---|
| Quadrant | BADHDUFLAG | Total packets | Discarded packets |
| A | 0 | 28 | 0 |
| B | 0 | 28 | 0 |
| C | 0 | 28 | 0 |
| D | 0 | 28 | 0 |
| Mode M0 | |||
|---|---|---|---|
| Quadrant | BADHDUFLAG | Total packets | Discarded packets |
| A | 0 | 17135 | 0 |
| B | 0 | 31865 | 0 |
| C | 0 | 17842 | 0 |
| D | 0 | 18028 | 0 |
| Mode SS | |||
|---|---|---|---|
| Quadrant | BADHDUFLAG | Total packets | Discarded packets |
| A | 0 | 160 | 0 |
| B | 0 | 160 | 0 |
| C | 0 | 160 | 0 |
| D | 0 | 160 | 0 |
| Quadrant | Total seconds | Saturated seconds | Saturation percentage |
|---|---|---|---|
| A | 7796 | 43 | 0.551565% |
| B | 7796 | 1798 | 23.063109% |
| C | 7796 | 267 | 3.424833% |
| D | 7796 | 129 | 1.654695% |
Noise dominated data is calculated using 1-second bins in cleaned event files. If a bin has >2000 counts, and if more than 50% of those come from <1% of pixels, then it is considered to be noise-dominated and hence unusable.
| Quadrant | # 1 sec bins | Bins with >0 counts | Bins with >2000 counts | High rate bins dominated by noise | Noise dominated (total time) | Noise dominated (detector-on time) | Marked lightcurve |
|---|---|---|---|---|---|---|---|
| A | 10541 | 7796 | 0 | 0 | 0.00% | 0.00% | 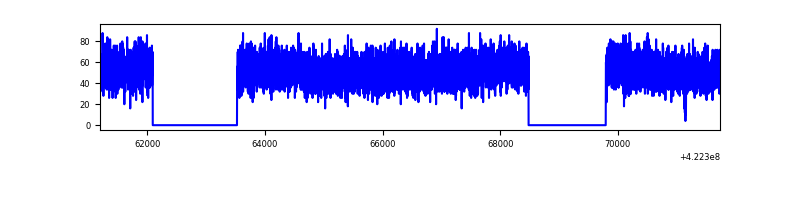 |
| B | 10541 | 7794 | 0 | 0 | 0.00% | 0.00% | 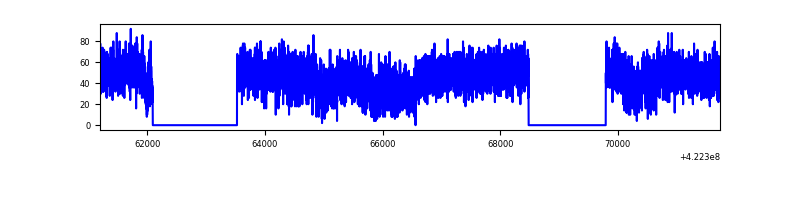 |
| C | 10541 | 7759 | 0 | 0 | 0.00% | 0.00% | 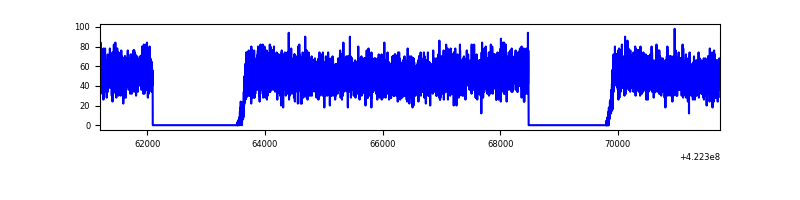 |
| D | 10541 | 7795 | 0 | 0 | 0.00% | 0.00% | 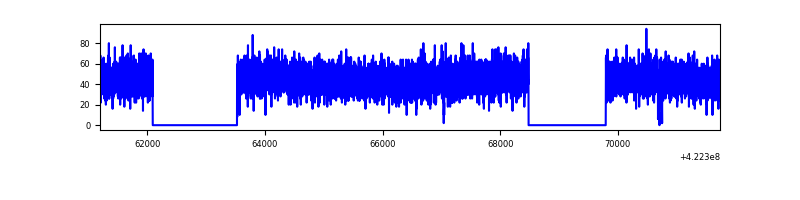 |
Top three noisy pixels from each quadrant. If the there are fewer than three noisy pixels in the level2.evt file, extra rows are filled as -1
| Pixel properties | Quadrant properties | ||||||
|---|---|---|---|---|---|---|---|
| Quadrant | DetID | PixID | Counts | Sigma | Mean | Median | Sigma |
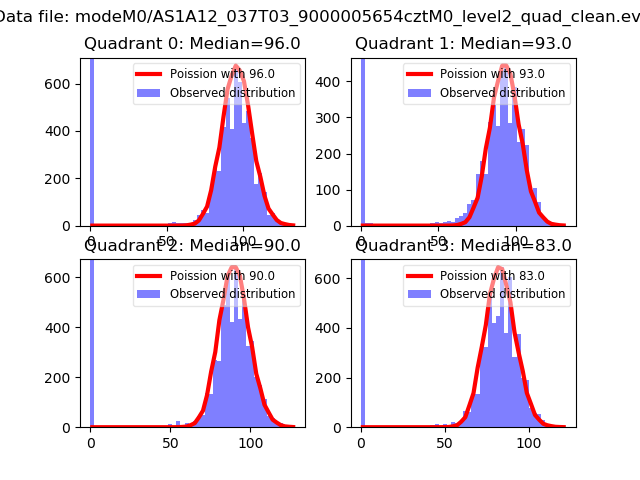
| A | 9 | 19 | 354 | 9.0 | 104 | 98 | 28.4 |
| A | 7 | 110 | 334 | 8.3 | 104 | 98 | 28.4 |
| A | 14 | 95 | 333 | 8.26 | 104 | 98 | 28.4 |
| B | 2 | 9 | 311 | 10.78 | 92 | 88 | 20.7 |
| B | 3 | 17 | 273 | 8.94 | 92 | 88 | 20.7 |
| B | 2 | 8 | 256 | 8.12 | 92 | 88 | 20.7 |
| C | 1 | 80 | 303 | 7.54 | 101 | 95 | 27.6 |
| C | 1 | 81 | 301 | 7.47 | 101 | 95 | 27.6 |
| C | 3 | 202 | 284 | 6.85 | 101 | 95 | 27.6 |
| D | 10 | 189 | 267 | 6.26 | 98 | 89 | 28.4 |
| D | 6 | 38 | 265 | 6.19 | 98 | 89 | 28.4 |
| D | 6 | 62 | 260 | 6.01 | 98 | 89 | 28.4 |
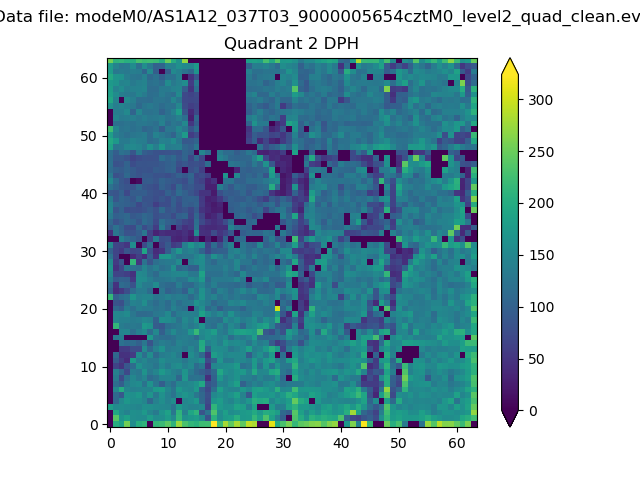
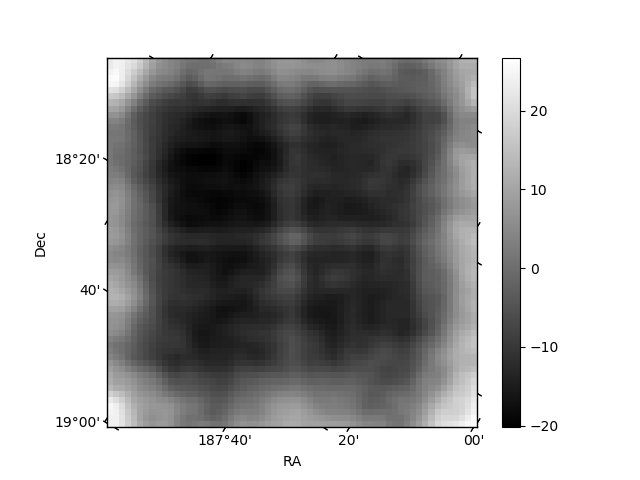
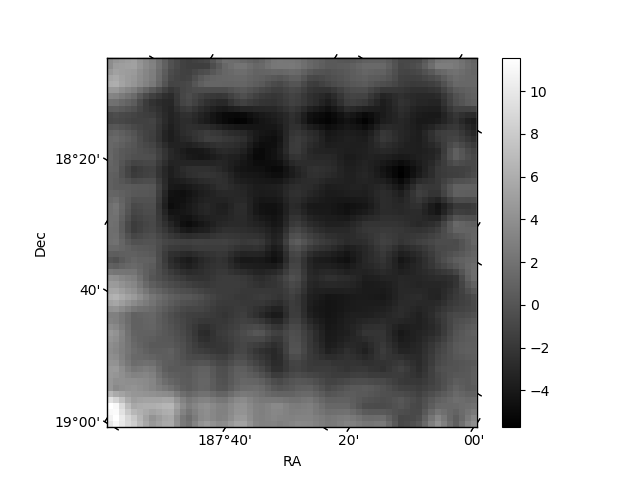
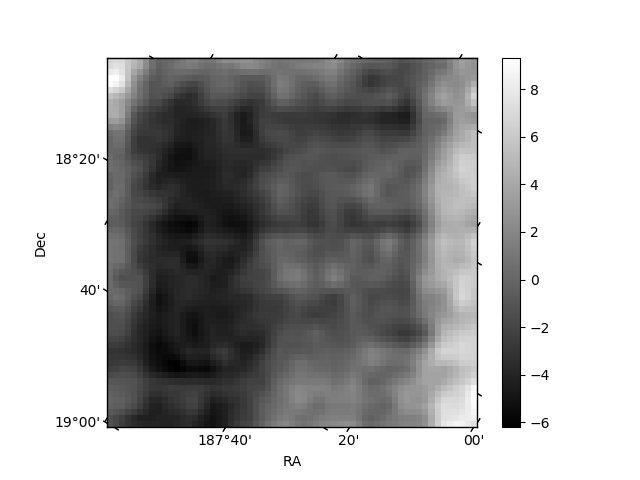
Histogram calculated using DETX and DETY for each event in the final _common_clean file
| Quadrant A | 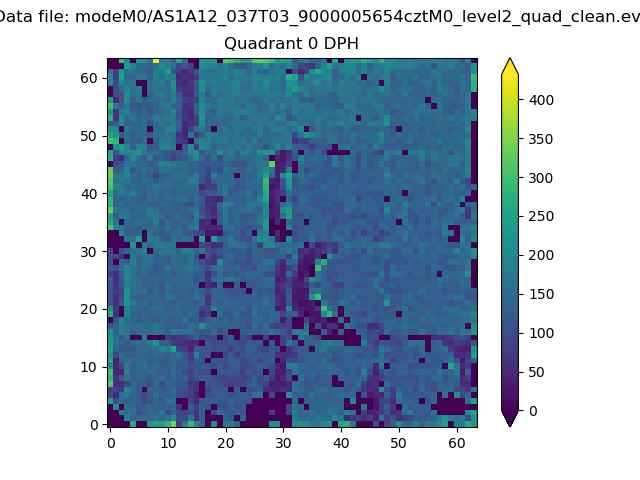 |
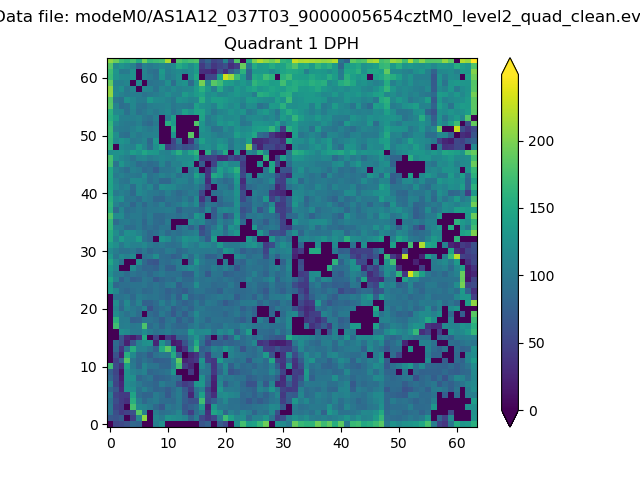 |
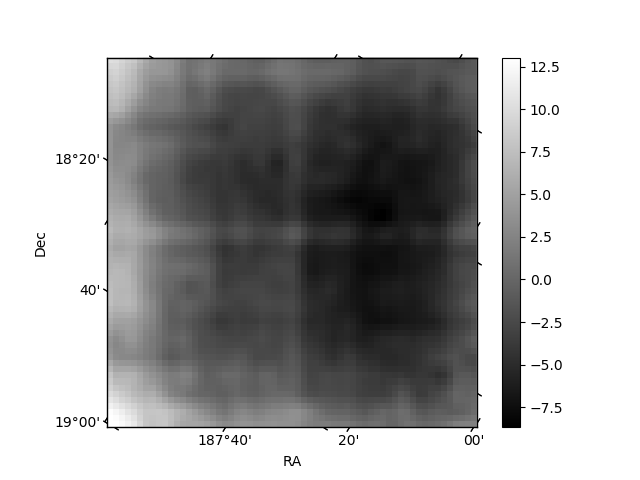
Quadrant B |
|---|---|---|---|
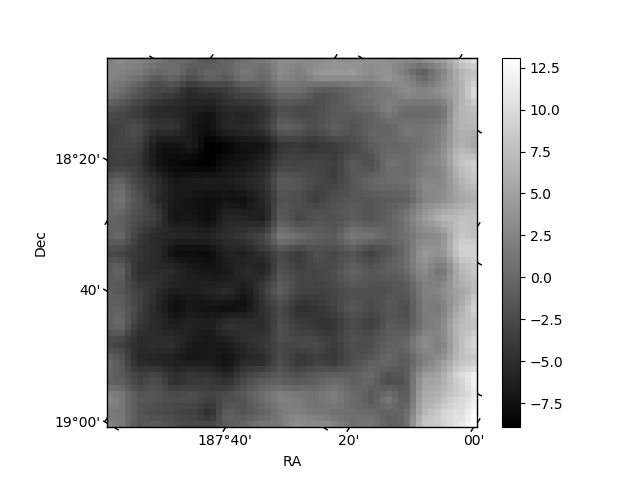
| Quadrant D | 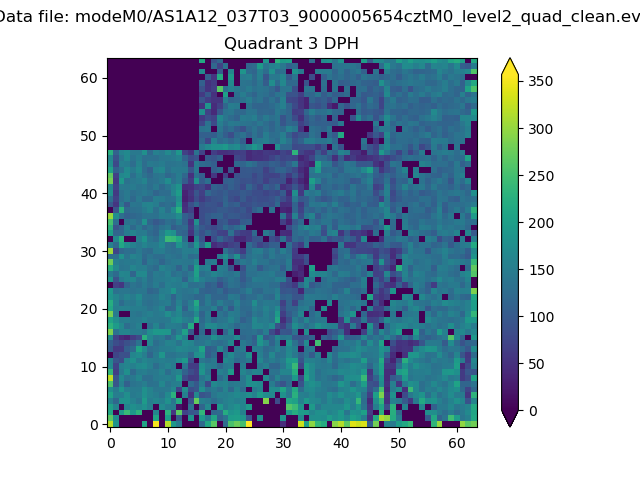 |
 |
Quadrant C |
| Plot type | Count rate plots | Images |
|---|---|---|
| Comparison with Poisson distribution Blue bars denote a histogram of data divided into 1 sec bins. Red curve is a Poisson curve with rate = median count rate of data. |
 |
 |
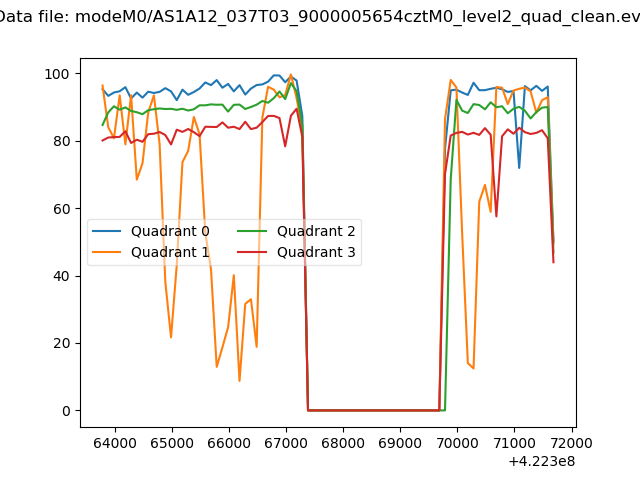
| Quadrant-wise count rates Data is divided into 100 sec bins |
 |
|
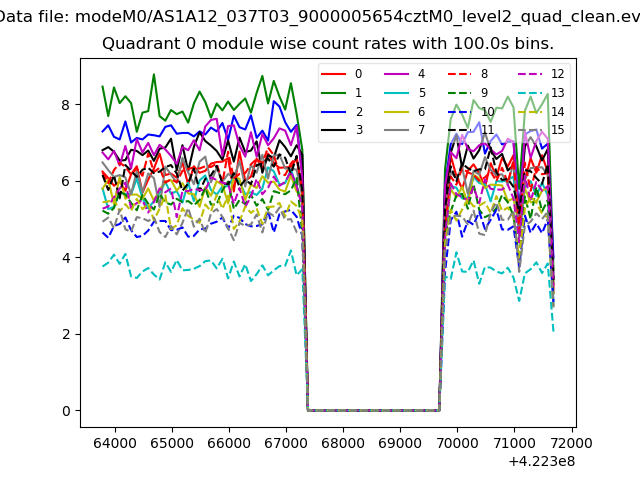
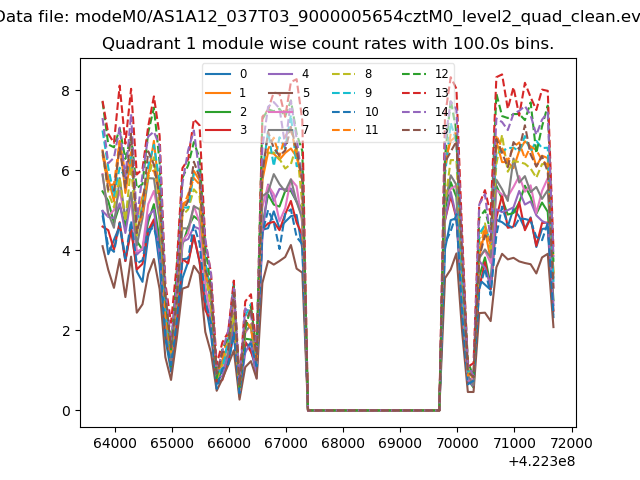
| Module-wise count rates for Quadrant A Data is divided into 100 sec bins |
 |
 |
| Module-wise count rates for Quadrant B Data is divided into 100 sec bins |
 |
 |
| Module-wise count rates for Quadrant C Data is divided into 100 sec bins |
 |
 |
| Module-wise count rates for Quadrant D Data is divided into 100 sec bins |
 |
 |
| Parameter | Plot |
|---|---|
| CZT HV Monitor | 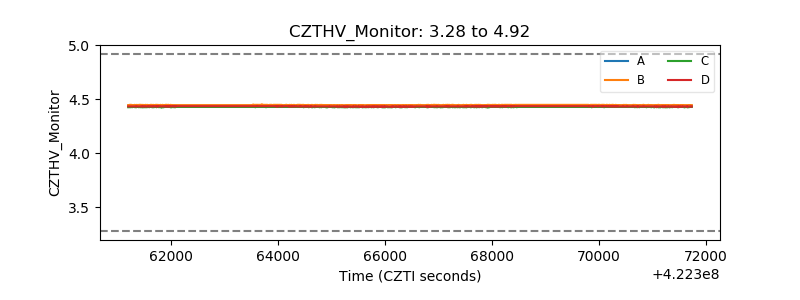 |
| D_VDD | 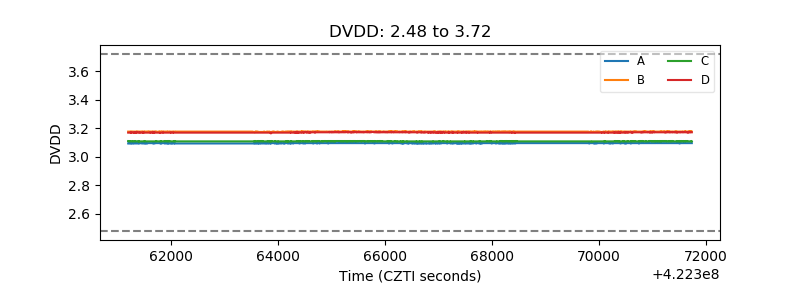 |
| Temperature 1 |  |
| Veto HV Monitor | 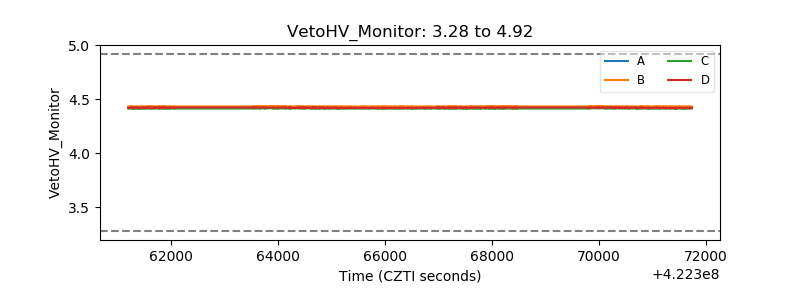 |
| Veto LLD | 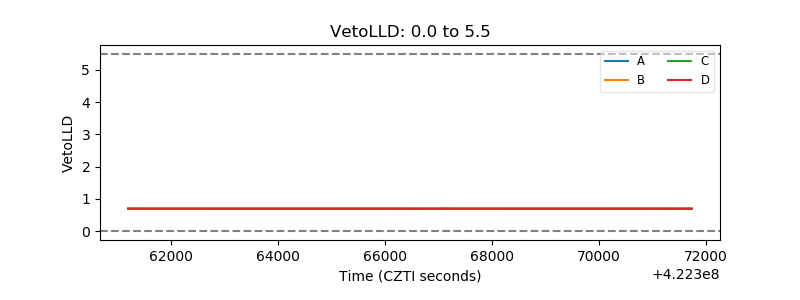 |
| Alpha Counter |  |
| _CPM_Rate |  |
| CZT Counter | 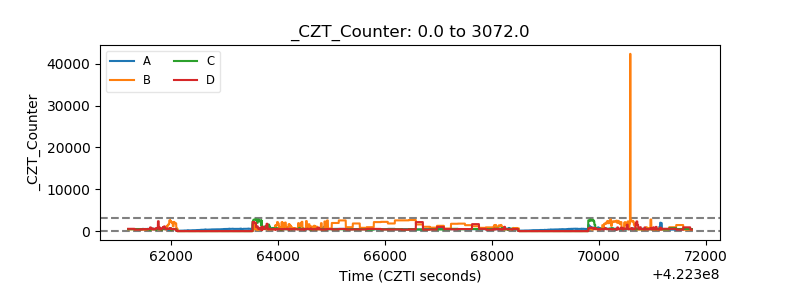 |
| +2.5 Volts monitor | 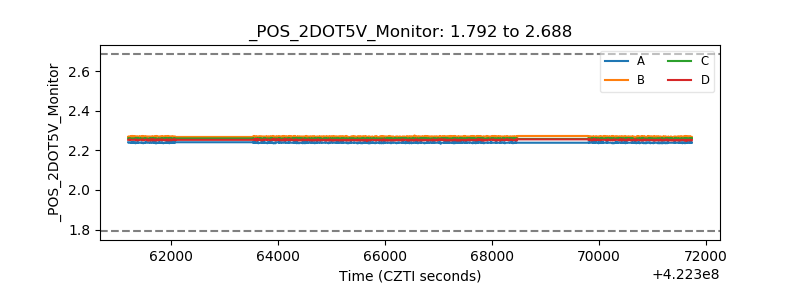 |
| +5 Volts monitor |  |
| _ROLL_ROT |  |
| _Roll_DEC | 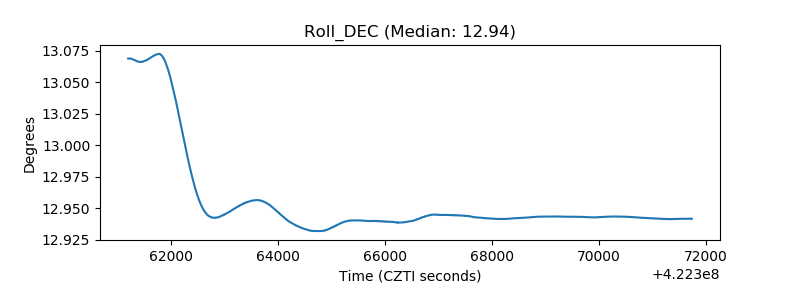 |
| _Roll_RA | 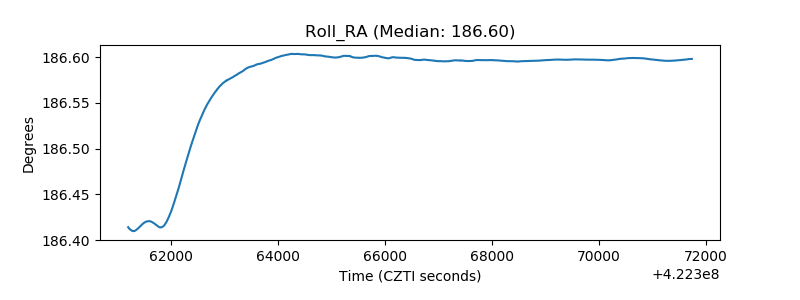 |
| Veto Counter |  |