| Param | Original file | Final file |
|---|---|---|
| Filename | modeM0/AS1A12_101T03_9000005656cztM0_level2.fits | modeM0/AS1A12_101T03_9000005656cztM0_level2_quad_clean.evt |
| Size (bytes) | 111,432,960 | 139,271,040 |
| Size | 106.3 MB | 132.8 MB |
| Events in quadrant A | 658,400 | 873,395 |
| Events in quadrant B | 637,086 | 872,337 |
| Events in quadrant C | 629,684 | 815,567 |
| Events in quadrant D | 560,572 | 767,217 |
| Mode M0 | |||
|---|---|---|---|
| Quadrant | BADHDUFLAG | Total packets | Discarded packets |
| A | 0 | 27426 | 0 |
| B | 0 | 26307 | 0 |
| C | 0 | 30078 | 0 |
| D | 0 | 30846 | 0 |
| Mode M9 | |||
|---|---|---|---|
| Quadrant | BADHDUFLAG | Total packets | Discarded packets |
| A | 0 | 42 | 0 |
| B | 0 | 42 | 0 |
| C | 0 | 42 | 0 |
| D | 0 | 42 | 0 |
| Mode SS | |||
|---|---|---|---|
| Quadrant | BADHDUFLAG | Total packets | Discarded packets |
| A | 0 | 264 | 0 |
| B | 0 | 264 | 0 |
| C | 0 | 264 | 0 |
| D | 0 | 264 | 0 |
| Quadrant | Total seconds | Saturated seconds | Saturation percentage |
|---|---|---|---|
| A | 12861 | 30 | 0.233263% |
| B | 12861 | 42 | 0.326569% |
| C | 12861 | 378 | 2.939118% |
| D | 12861 | 312 | 2.425939% |
Noise dominated data is calculated using 1-second bins in cleaned event files. If a bin has >2000 counts, and if more than 50% of those come from <1% of pixels, then it is considered to be noise-dominated and hence unusable.
| Quadrant | # 1 sec bins | Bins with >0 counts | Bins with >2000 counts | High rate bins dominated by noise | Noise dominated (total time) | Noise dominated (detector-on time) | Marked lightcurve |
|---|---|---|---|---|---|---|---|
| A | 17066 | 12859 | 0 | 0 | 0.00% | 0.00% | 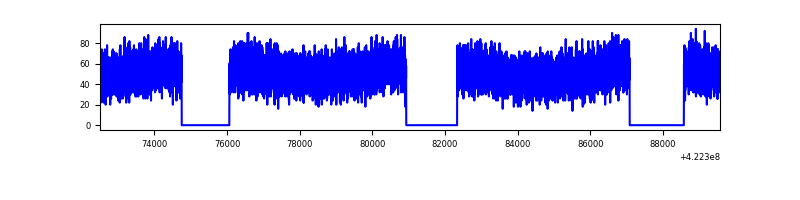 |
| B | 17066 | 12861 | 0 | 0 | 0.00% | 0.00% |  |
| C | 17066 | 12820 | 0 | 0 | 0.00% | 0.00% | 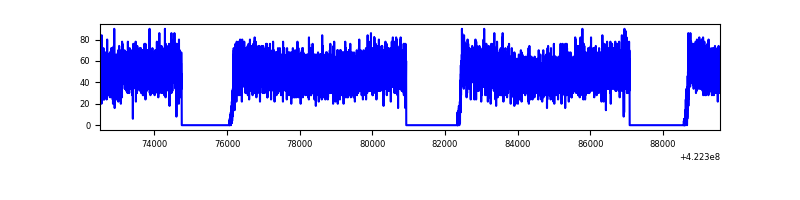 |
| D | 17066 | 12857 | 0 | 0 | 0.00% | 0.00% | 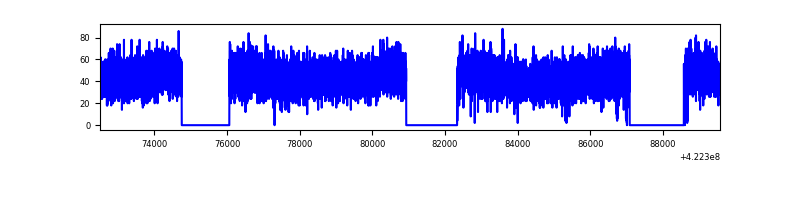 |
Top three noisy pixels from each quadrant. If the there are fewer than three noisy pixels in the level2.evt file, extra rows are filled as -1
| Pixel properties | Quadrant properties | ||||||
|---|---|---|---|---|---|---|---|
| Quadrant | DetID | PixID | Counts | Sigma | Mean | Median | Sigma |
| A | 7 | 110 | 557 | 8.66 | 171 | 160 | 45.8 |
| A | 0 | 29 | 541 | 8.31 | 171 | 160 | 45.8 |
| A | 9 | 19 | 526 | 7.98 | 171 | 160 | 45.8 |
| B | 2 | 9 | 572 | 11.59 | 167 | 159 | 35.6 |
| B | 2 | 8 | 455 | 8.3 | 167 | 159 | 35.6 |
| B | 3 | 80 | 451 | 8.19 | 167 | 159 | 35.6 |
| C | 1 | 81 | 547 | 8.73 | 166 | 155 | 44.9 |
| C | 1 | 80 | 511 | 7.93 | 166 | 155 | 44.9 |
| C | 3 | 203 | 501 | 7.7 | 166 | 155 | 44.9 |
| D | 7 | 3 | 413 | 6.03 | 159 | 145 | 44.4 |
| D | 12 | 6 | 412 | 6.01 | 159 | 145 | 44.4 |
| D | 1 | 3 | 410 | 5.97 | 159 | 145 | 44.4 |
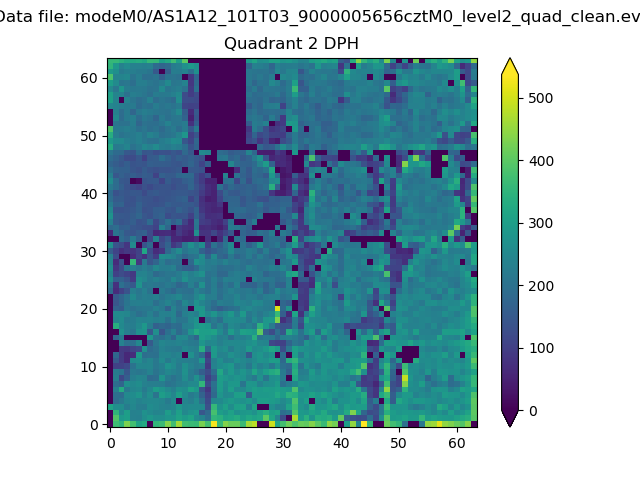
Histogram calculated using DETX and DETY for each event in the final _common_clean file
| Quadrant A | 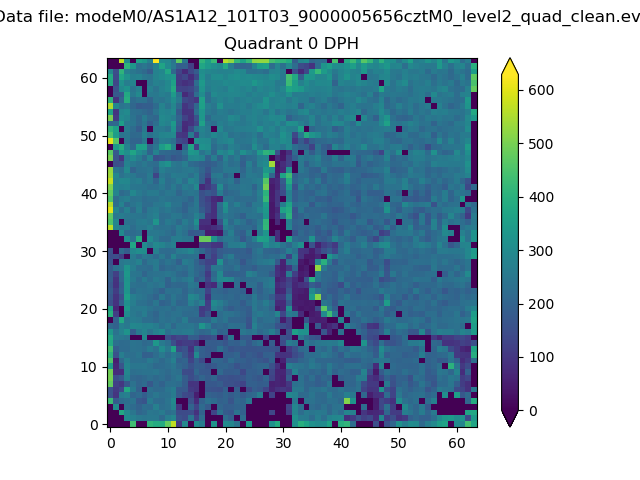 |
 |
Quadrant B |
|---|---|---|---|
| Quadrant D |  |
 |
Quadrant C |
| Plot type | Count rate plots | Images |
|---|---|---|
| Comparison with Poisson distribution Blue bars denote a histogram of data divided into 1 sec bins. Red curve is a Poisson curve with rate = median count rate of data. |
 |
 |
| Quadrant-wise count rates Data is divided into 100 sec bins |
 |
|
| Module-wise count rates for Quadrant A Data is divided into 100 sec bins |
 |
 |
| Module-wise count rates for Quadrant B Data is divided into 100 sec bins |
 |
 |
| Module-wise count rates for Quadrant C Data is divided into 100 sec bins |
 |
 |
| Module-wise count rates for Quadrant D Data is divided into 100 sec bins |
 |
 |
| Parameter | Plot |
|---|---|
| CZT HV Monitor |  |
| D_VDD | 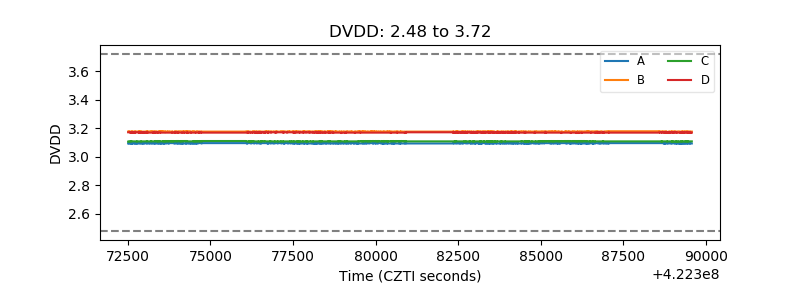 |
| Temperature 1 | 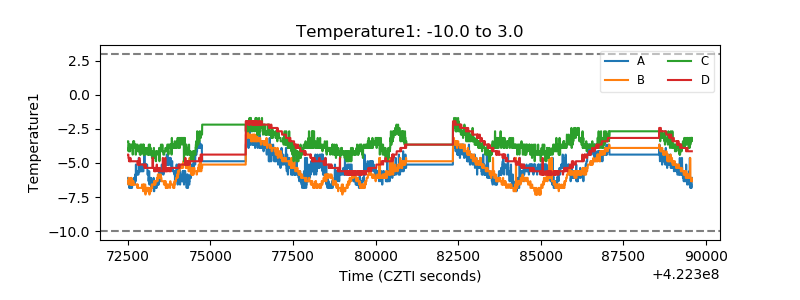 |
| Veto HV Monitor |  |
| Veto LLD |  |
| Alpha Counter |  |
| _CPM_Rate |  |
| CZT Counter | 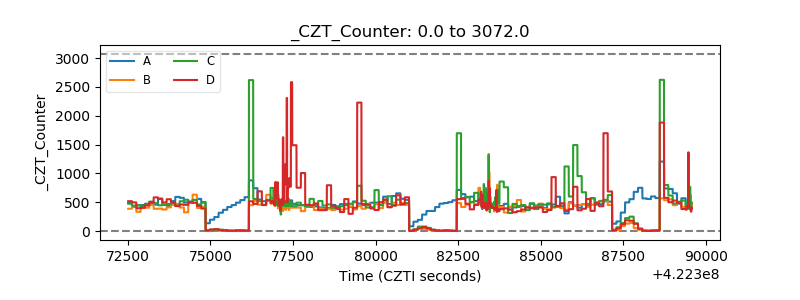 |
| +2.5 Volts monitor |  |
| +5 Volts monitor |  |
| _ROLL_ROT |  |
| _Roll_DEC |  |
| _Roll_RA |  |
| Veto Counter |  |