| Param | Original file | Final file |
|---|---|---|
| Filename | modeM0/AS1T05_105T01_9000005658cztM0_level2.fits | modeM0/AS1T05_105T01_9000005658cztM0_level2_quad_clean.evt |
| Size (bytes) | 844,297,920 | 937,837,440 |
| Size | 805.2 MB | 894.4 MB |
| Events in quadrant A | 5,132,616 | 5,831,028 |
| Events in quadrant B | 4,911,188 | 5,832,939 |
| Events in quadrant C | 4,901,864 | 5,503,419 |
| Events in quadrant D | 4,037,986 | 4,657,295 |
| Mode M9 | |||
|---|---|---|---|
| Quadrant | BADHDUFLAG | Total packets | Discarded packets |
| A | 0 | 375 | 0 |
| B | 0 | 375 | 0 |
| C | 0 | 375 | 0 |
| D | 0 | 375 | 0 |
| Mode SS | |||
|---|---|---|---|
| Quadrant | BADHDUFLAG | Total packets | Discarded packets |
| A | 0 | 1964 | 0 |
| B | 0 | 1964 | 0 |
| C | 0 | 1964 | 0 |
| D | 0 | 1964 | 0 |
| Mode M0 | |||
|---|---|---|---|
| Quadrant | BADHDUFLAG | Total packets | Discarded packets |
| A | 0 | 205162 | 0 |
| B | 0 | 204855 | 0 |
| C | 0 | 215711 | 0 |
| D | 0 | 326442 | 0 |
| Quadrant | Total seconds | Saturated seconds | Saturation percentage |
|---|---|---|---|
| A | 95978 | 242 | 0.252141% |
| B | 95978 | 878 | 0.914793% |
| C | 95978 | 2703 | 2.816270% |
| D | 95978 | 12456 | 12.977974% |
Noise dominated data is calculated using 1-second bins in cleaned event files. If a bin has >2000 counts, and if more than 50% of those come from <1% of pixels, then it is considered to be noise-dominated and hence unusable.
| Quadrant | # 1 sec bins | Bins with >0 counts | Bins with >2000 counts | High rate bins dominated by noise | Noise dominated (total time) | Noise dominated (detector-on time) | Marked lightcurve |
|---|---|---|---|---|---|---|---|
| A | 133657 | 95966 | 0 | 0 | 0.00% | 0.00% |  |
| B | 133657 | 95962 | 0 | 0 | 0.00% | 0.00% |  |
| C | 133657 | 95625 | 0 | 0 | 0.00% | 0.00% |  |
| D | 133657 | 95569 | 0 | 0 | 0.00% | 0.00% |  |
Top three noisy pixels from each quadrant. If the there are fewer than three noisy pixels in the level2.evt file, extra rows are filled as -1
| Pixel properties | Quadrant properties | ||||||
|---|---|---|---|---|---|---|---|
| Quadrant | DetID | PixID | Counts | Sigma | Mean | Median | Sigma |
| A | 7 | 110 | 4351 | 9.15 | 1337 | 1252 | 338.6 |
| A | 9 | 19 | 4281 | 8.95 | 1337 | 1252 | 338.6 |
| A | 0 | 29 | 4074 | 8.33 | 1337 | 1252 | 338.6 |
| B | 2 | 9 | 4291 | 12.14 | 1296 | 1233 | 251.9 |
| B | 3 | 80 | 3427 | 8.71 | 1296 | 1233 | 251.9 |
| B | 5 | 128 | 3424 | 8.7 | 1296 | 1233 | 251.9 |
| C | 1 | 81 | 4115 | 8.73 | 1294 | 1207 | 332.9 |
| C | 1 | 80 | 3899 | 8.08 | 1294 | 1207 | 332.9 |
| C | 3 | 203 | 3853 | 7.95 | 1294 | 1207 | 332.9 |
| D | 7 | 3 | 3125 | 6.66 | 1154 | 1049 | 311.4 |
| D | 10 | 189 | 2909 | 5.97 | 1154 | 1049 | 311.4 |
| D | 10 | 113 | 2878 | 5.87 | 1154 | 1049 | 311.4 |
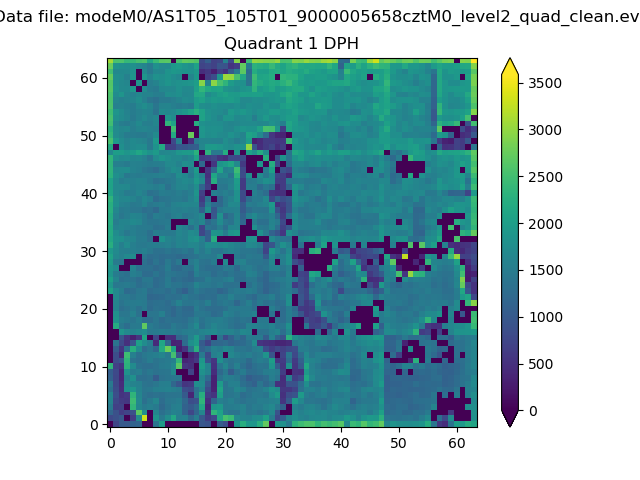
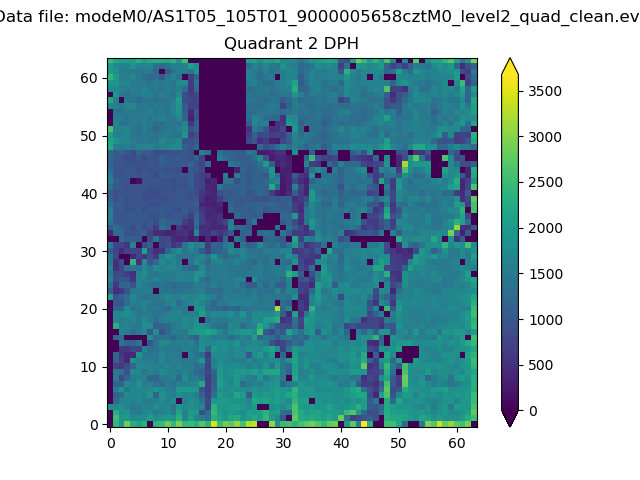
Histogram calculated using DETX and DETY for each event in the final _common_clean file
| Quadrant A | 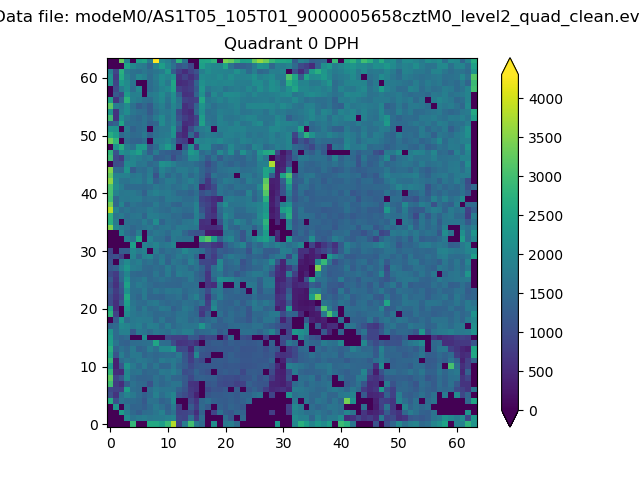 |
 |
Quadrant B |
|---|---|---|---|
| Quadrant D | 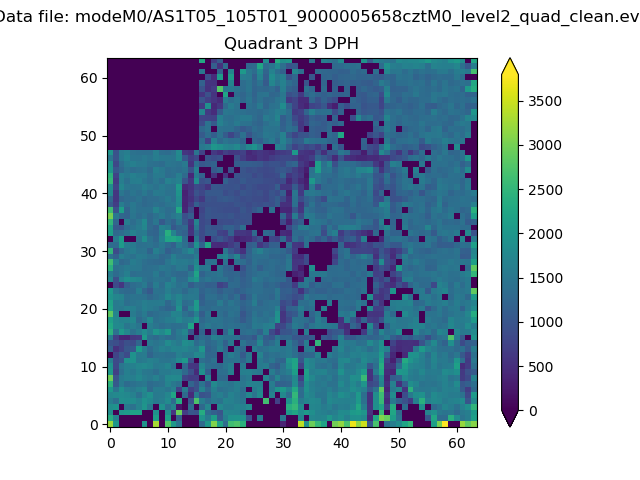 |
 |
Quadrant C |
| Plot type | Count rate plots | Images |
|---|---|---|
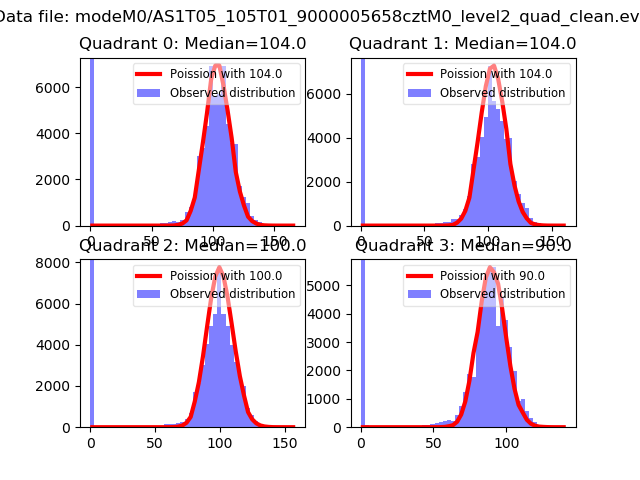
| Comparison with Poisson distribution Blue bars denote a histogram of data divided into 1 sec bins. Red curve is a Poisson curve with rate = median count rate of data. |
 |
 |
| Quadrant-wise count rates Data is divided into 100 sec bins |
 |
|
| Module-wise count rates for Quadrant A Data is divided into 100 sec bins |
 |
 |
| Module-wise count rates for Quadrant B Data is divided into 100 sec bins |
 |
 |
| Module-wise count rates for Quadrant C Data is divided into 100 sec bins |
 |
 |
| Module-wise count rates for Quadrant D Data is divided into 100 sec bins |
 |
 |
| Parameter | Plot |
|---|---|
| CZT HV Monitor | 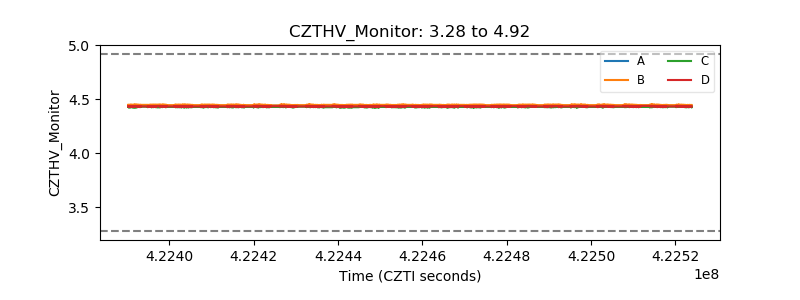 |
| D_VDD | 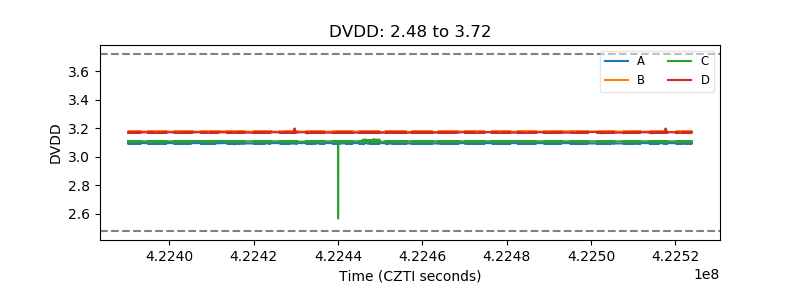 |
| Temperature 1 |  |
| Veto HV Monitor | 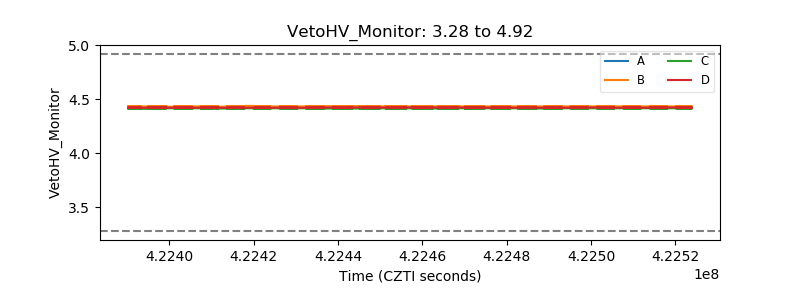 |
| Veto LLD |  |
| Alpha Counter | 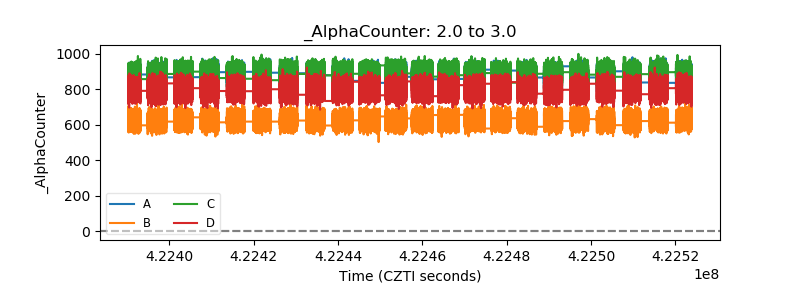 |
| _CPM_Rate |  |
| CZT Counter |  |
| +2.5 Volts monitor |  |
| +5 Volts monitor |  |
| _ROLL_ROT | 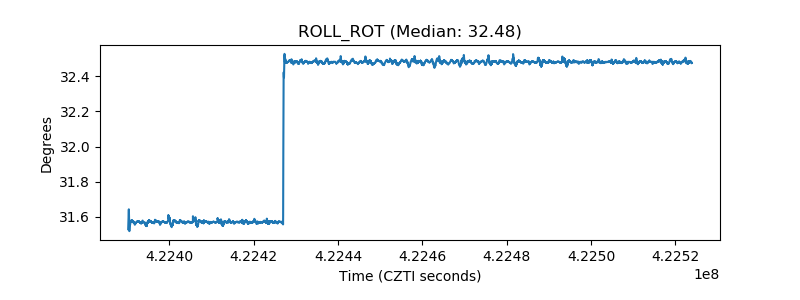 |
| _Roll_DEC | 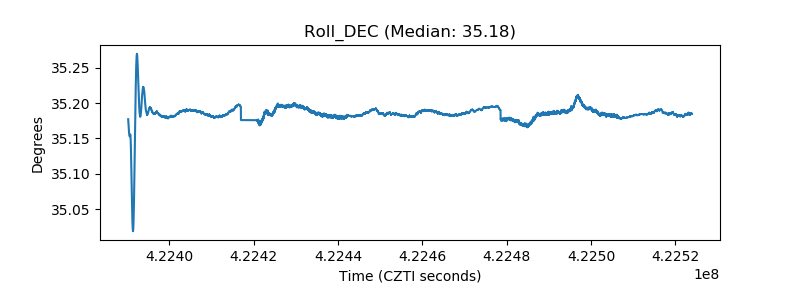 |
| _Roll_RA | 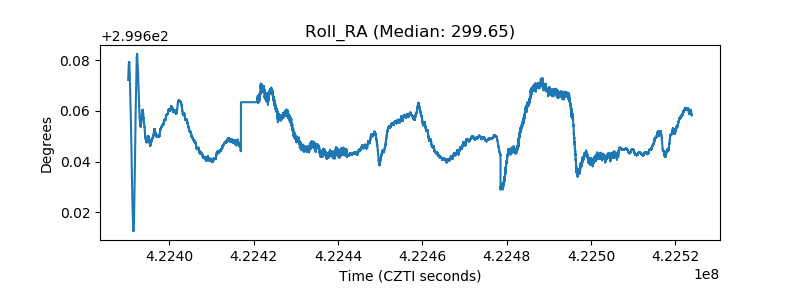 |
| Veto Counter |  |