| Param | Original file | Final file |
|---|---|---|
| Filename | modeM0/AS1A12_035T01_9000005666cztM0_level2.fits | modeM0/AS1A12_035T01_9000005666cztM0_level2_quad_clean.evt |
| Size (bytes) | 1,569,755,520 | 1,757,093,760 |
| Size | 1.5 GB | 1.6 GB |
| Events in quadrant A | 9,381,724 | 10,787,744 |
| Events in quadrant B | 9,030,688 | 10,863,661 |
| Events in quadrant C | 9,160,816 | 10,212,330 |
| Events in quadrant D | 8,007,426 | 9,399,695 |
| Mode M0 | |||
|---|---|---|---|
| Quadrant | BADHDUFLAG | Total packets | Discarded packets |
| A | 0 | 388532 | 0 |
| B | 0 | 386379 | 0 |
| C | 0 | 387761 | 0 |
| D | 0 | 465265 | 0 |
| Mode SS | |||
|---|---|---|---|
| Quadrant | BADHDUFLAG | Total packets | Discarded packets |
| A | 0 | 3568 | 0 |
| B | 0 | 3568 | 0 |
| C | 0 | 3568 | 0 |
| D | 0 | 3568 | 0 |
| Mode M9 | |||
|---|---|---|---|
| Quadrant | BADHDUFLAG | Total packets | Discarded packets |
| A | 0 | 652 | 0 |
| B | 0 | 652 | 0 |
| C | 0 | 652 | 0 |
| D | 0 | 652 | 0 |
| Quadrant | Total seconds | Saturated seconds | Saturation percentage |
|---|---|---|---|
| A | 174509 | 653 | 0.374193% |
| B | 174509 | 3051 | 1.748334% |
| C | 174509 | 4580 | 2.624506% |
| D | 174509 | 6833 | 3.915557% |
Noise dominated data is calculated using 1-second bins in cleaned event files. If a bin has >2000 counts, and if more than 50% of those come from <1% of pixels, then it is considered to be noise-dominated and hence unusable.
| Quadrant | # 1 sec bins | Bins with >0 counts | Bins with >2000 counts | High rate bins dominated by noise | Noise dominated (total time) | Noise dominated (detector-on time) | Marked lightcurve |
|---|---|---|---|---|---|---|---|
| A | 239832 | 174509 | 0 | 0 | 0.00% | 0.00% |  |
| B | 239832 | 174501 | 0 | 0 | 0.00% | 0.00% |  |
| C | 239832 | 174028 | 0 | 0 | 0.00% | 0.00% | 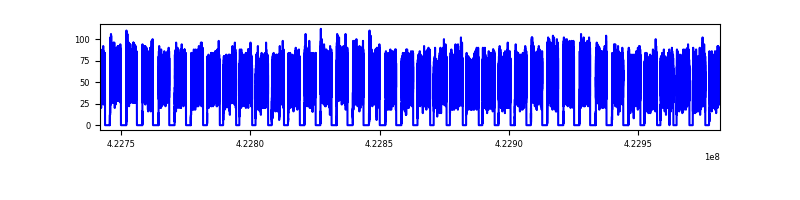 |
| D | 239832 | 174421 | 0 | 0 | 0.00% | 0.00% | 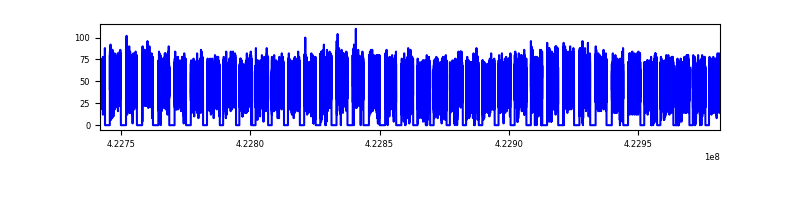 |
Top three noisy pixels from each quadrant. If the there are fewer than three noisy pixels in the level2.evt file, extra rows are filled as -1
| Pixel properties | Quadrant properties | ||||||
|---|---|---|---|---|---|---|---|
| Quadrant | DetID | PixID | Counts | Sigma | Mean | Median | Sigma |
| A | 7 | 110 | 7758 | 8.95 | 2452 | 2292 | 610.5 |
| A | 9 | 19 | 7627 | 8.74 | 2452 | 2292 | 610.5 |
| A | 0 | 29 | 7327 | 8.25 | 2452 | 2292 | 610.5 |
| B | 2 | 9 | 7813 | 11.78 | 2388 | 2267 | 470.7 |
| B | 3 | 80 | 6615 | 9.24 | 2388 | 2267 | 470.7 |
| B | 2 | 8 | 6398 | 8.78 | 2388 | 2267 | 470.7 |
| C | 1 | 81 | 7410 | 8.48 | 2416 | 2261 | 607.3 |
| C | 1 | 80 | 7121 | 8.0 | 2416 | 2261 | 607.3 |
| C | 3 | 202 | 7050 | 7.88 | 2416 | 2261 | 607.3 |
| D | 7 | 3 | 5878 | 6.26 | 2285 | 2080 | 606.4 |
| D | 4 | 160 | 5840 | 6.2 | 2285 | 2080 | 606.4 |
| D | 10 | 189 | 5771 | 6.09 | 2285 | 2080 | 606.4 |
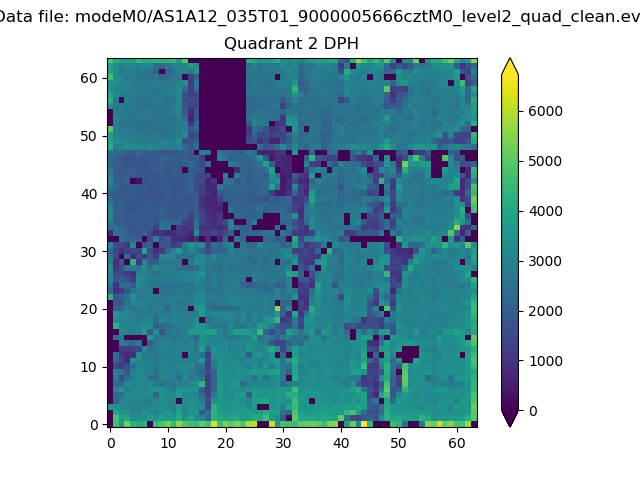
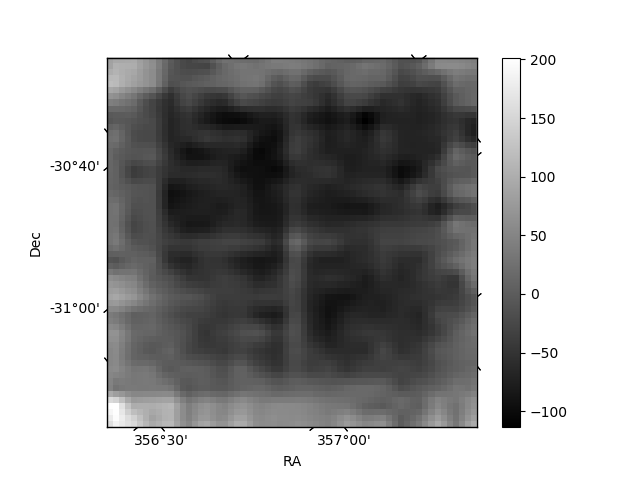
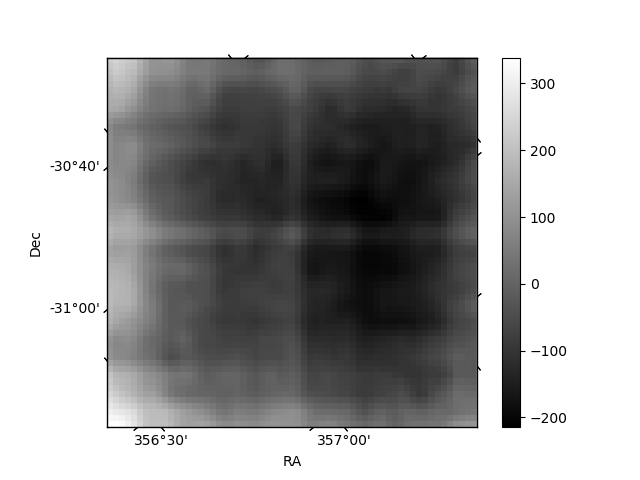
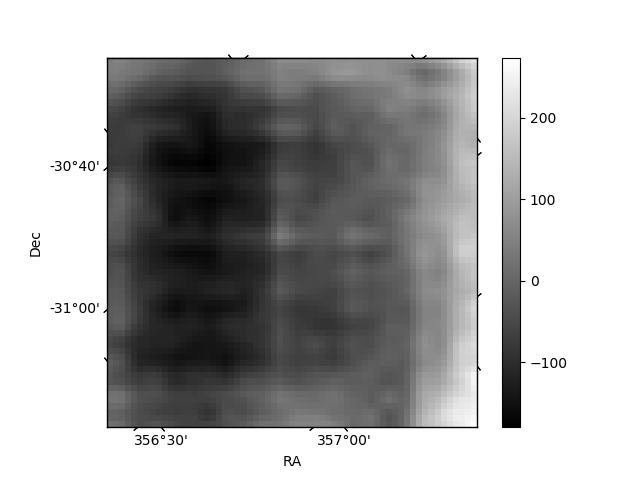
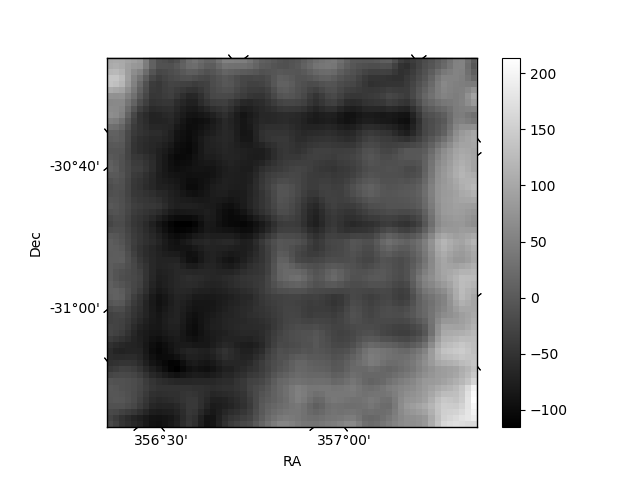
Histogram calculated using DETX and DETY for each event in the final _common_clean file
| Quadrant A | 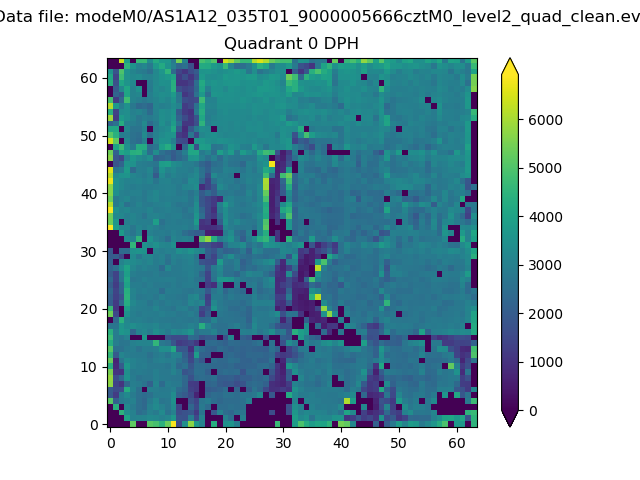 |
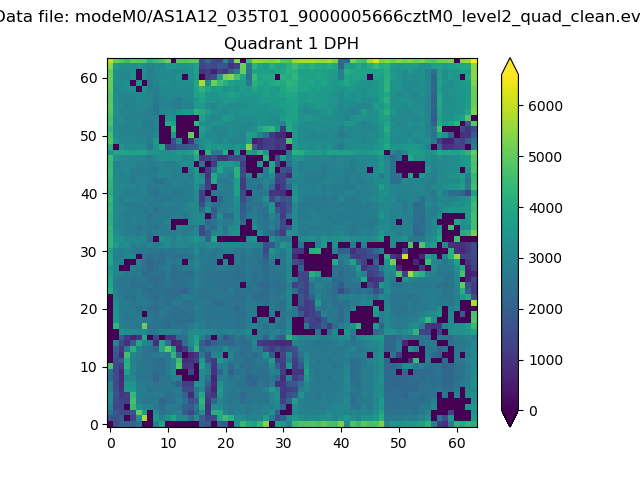 |
Quadrant B |
|---|---|---|---|
| Quadrant D | 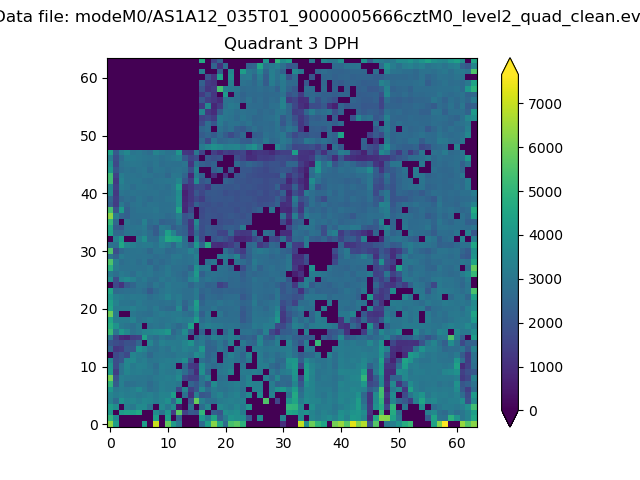 |
 |
Quadrant C |
| Plot type | Count rate plots | Images |
|---|---|---|
| Comparison with Poisson distribution Blue bars denote a histogram of data divided into 1 sec bins. Red curve is a Poisson curve with rate = median count rate of data. |
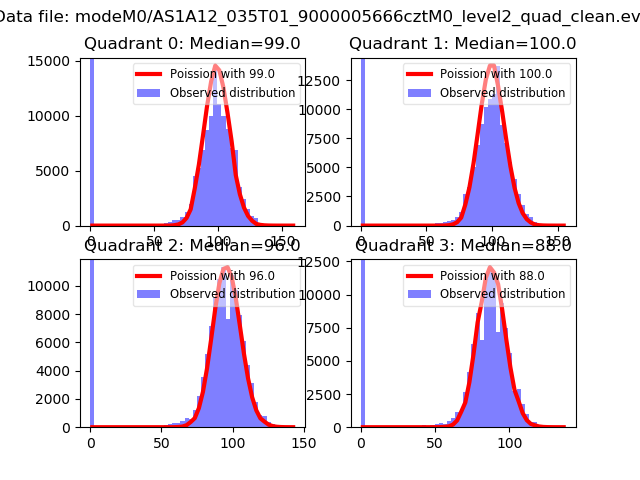 |
 |
| Quadrant-wise count rates Data is divided into 100 sec bins |
 |
|
| Module-wise count rates for Quadrant A Data is divided into 100 sec bins |
 |
 |
| Module-wise count rates for Quadrant B Data is divided into 100 sec bins |
 |
 |
| Module-wise count rates for Quadrant C Data is divided into 100 sec bins |
 |
 |
| Module-wise count rates for Quadrant D Data is divided into 100 sec bins |
 |
 |
| Parameter | Plot |
|---|---|
| CZT HV Monitor | 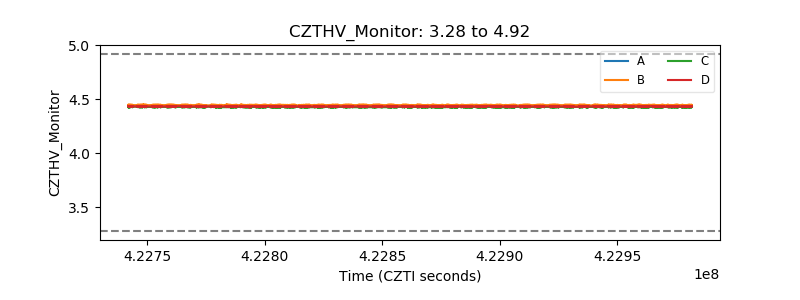 |
| D_VDD | 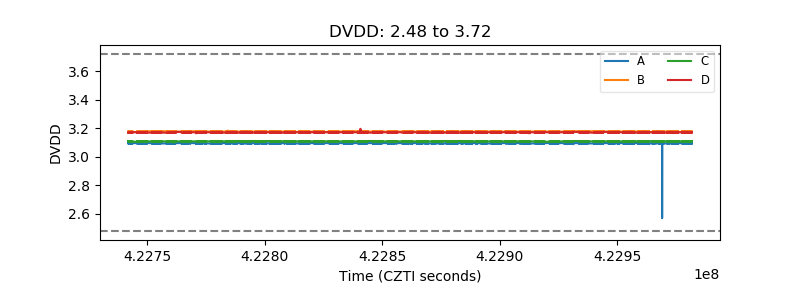 |
| Temperature 1 | 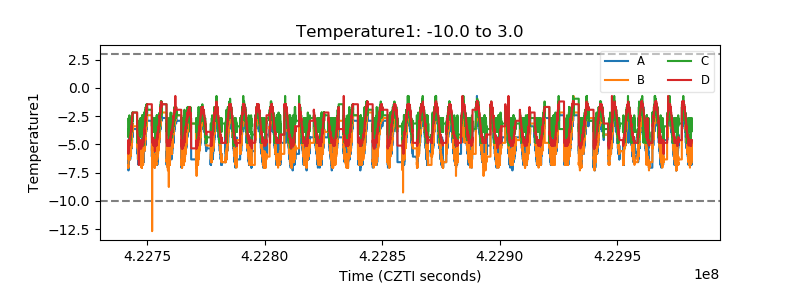 |
| Veto HV Monitor | 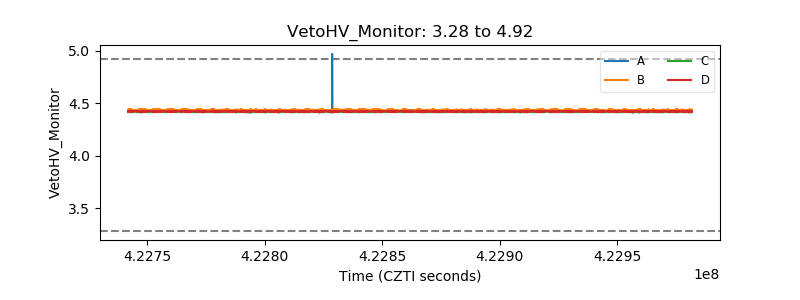 |
| Veto LLD | 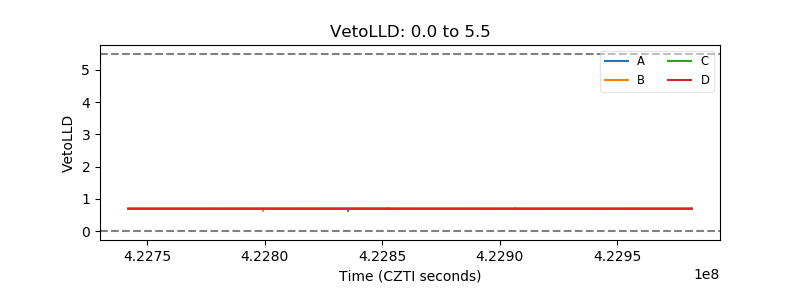 |
| Alpha Counter | 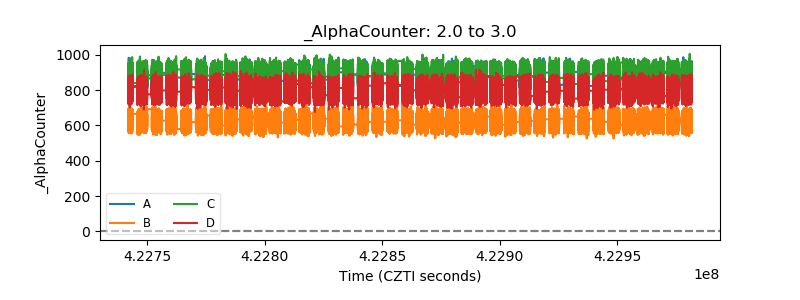 |
| _CPM_Rate |  |
| CZT Counter |  |
| +2.5 Volts monitor | 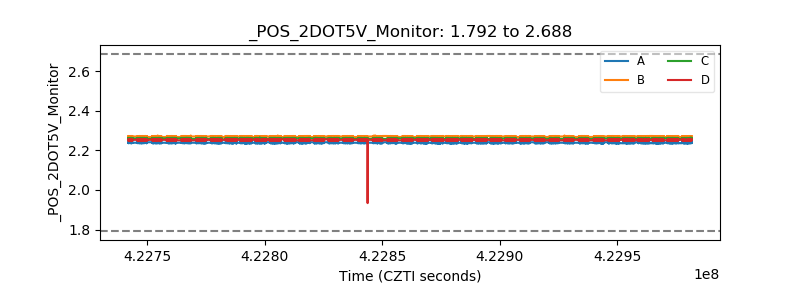 |
| +5 Volts monitor | 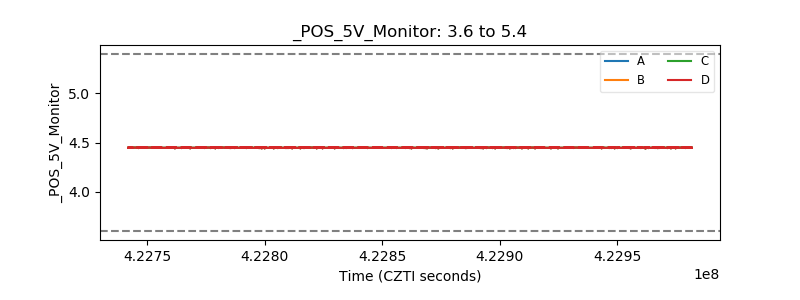 |
| _ROLL_ROT | 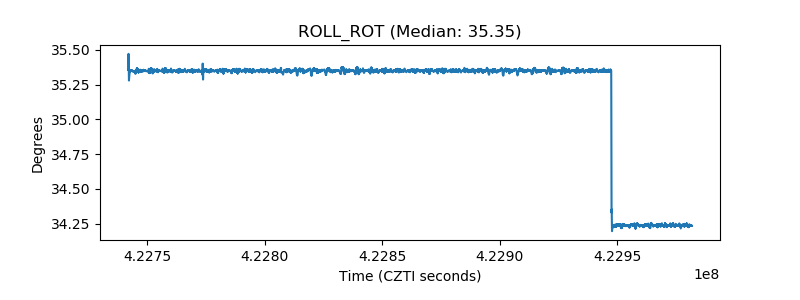 |
| _Roll_DEC | 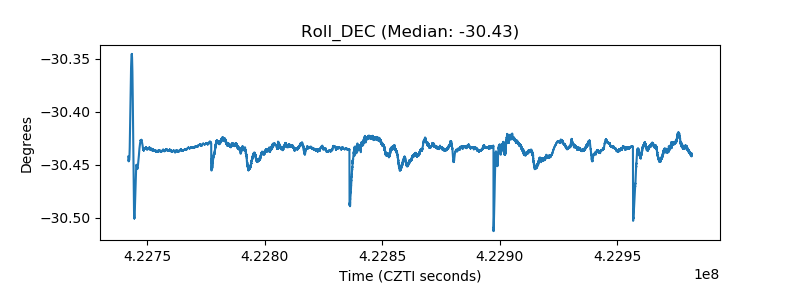 |
| _Roll_RA | 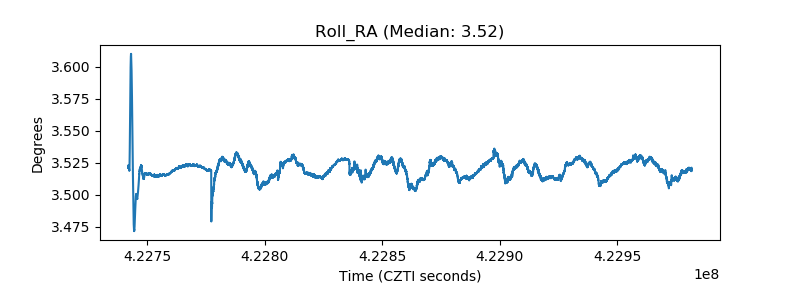 |
| Veto Counter | 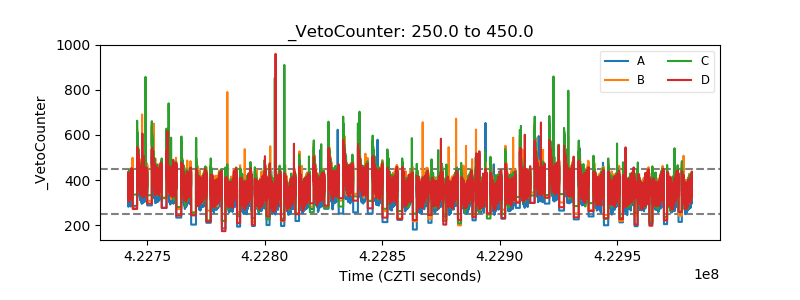 |