| Param | Original file | Final file |
|---|---|---|
| Filename | modeM0/AS1T05_108T01_9000005664cztM0_level2.fits | modeM0/AS1T05_108T01_9000005664cztM0_level2_quad_clean.evt |
| Size (bytes) | 176,754,240 | 144,017,280 |
| Size | 168.6 MB | 137.3 MB |
| Events in quadrant A | 1,044,550 | 768,748 |
| Events in quadrant B | 1,011,498 | 766,382 |
| Events in quadrant C | 1,004,972 | 731,496 |
| Events in quadrant D | 886,468 | 688,619 |
| Mode M0 | |||
|---|---|---|---|
| Quadrant | BADHDUFLAG | Total packets | Discarded packets |
| A | 0 | 44114 | 0 |
| B | 0 | 42952 | 0 |
| C | 0 | 47476 | 0 |
| D | 0 | 50488 | 0 |
| Mode M9 | |||
|---|---|---|---|
| Quadrant | BADHDUFLAG | Total packets | Discarded packets |
| A | 0 | 75 | 0 |
| B | 0 | 75 | 0 |
| C | 0 | 75 | 0 |
| D | 0 | 75 | 0 |
| Mode SS | |||
|---|---|---|---|
| Quadrant | BADHDUFLAG | Total packets | Discarded packets |
| A | 0 | 420 | 0 |
| B | 0 | 420 | 0 |
| C | 0 | 420 | 0 |
| D | 0 | 420 | 0 |
| Quadrant | Total seconds | Saturated seconds | Saturation percentage |
|---|---|---|---|
| A | 20397 | 50 | 0.245134% |
| B | 20397 | 111 | 0.544198% |
| C | 20397 | 581 | 2.848458% |
| D | 20397 | 550 | 2.696475% |
Noise dominated data is calculated using 1-second bins in cleaned event files. If a bin has >2000 counts, and if more than 50% of those come from <1% of pixels, then it is considered to be noise-dominated and hence unusable.
| Quadrant | # 1 sec bins | Bins with >0 counts | Bins with >2000 counts | High rate bins dominated by noise | Noise dominated (total time) | Noise dominated (detector-on time) | Marked lightcurve |
|---|---|---|---|---|---|---|---|
| A | 28008 | 20398 | 0 | 0 | 0.00% | 0.00% | 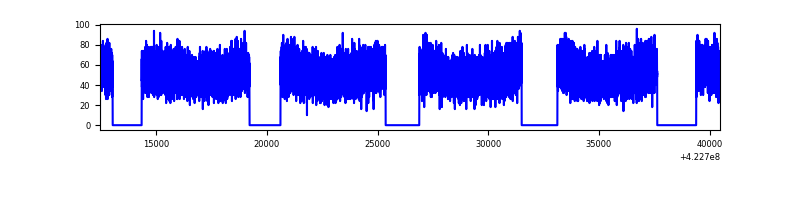 |
| B | 28008 | 20397 | 0 | 0 | 0.00% | 0.00% |  |
| C | 28008 | 20328 | 0 | 0 | 0.00% | 0.00% | 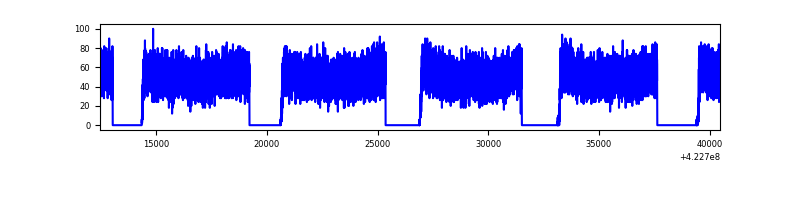 |
| D | 28008 | 20386 | 0 | 0 | 0.00% | 0.00% |  |
Top three noisy pixels from each quadrant. If the there are fewer than three noisy pixels in the level2.evt file, extra rows are filled as -1
| Pixel properties | Quadrant properties | ||||||
|---|---|---|---|---|---|---|---|
| Quadrant | DetID | PixID | Counts | Sigma | Mean | Median | Sigma |
| A | 0 | 29 | 858 | 8.47 | 272 | 256 | 71.1 |
| A | 9 | 19 | 850 | 8.36 | 272 | 256 | 71.1 |
| A | 7 | 110 | 837 | 8.17 | 272 | 256 | 71.1 |
| B | 2 | 9 | 843 | 10.89 | 267 | 254 | 54.1 |
| B | 3 | 80 | 755 | 9.26 | 267 | 254 | 54.1 |
| B | 3 | 17 | 736 | 8.91 | 267 | 254 | 54.1 |
| C | 1 | 81 | 886 | 9.08 | 266 | 249 | 70.2 |
| C | 1 | 80 | 857 | 8.67 | 266 | 249 | 70.2 |
| C | 1 | 65 | 752 | 7.17 | 266 | 249 | 70.2 |
| D | 4 | 160 | 673 | 6.41 | 252 | 229 | 69.3 |
| D | 6 | 231 | 670 | 6.37 | 252 | 229 | 69.3 |
| D | 7 | 3 | 655 | 6.15 | 252 | 229 | 69.3 |
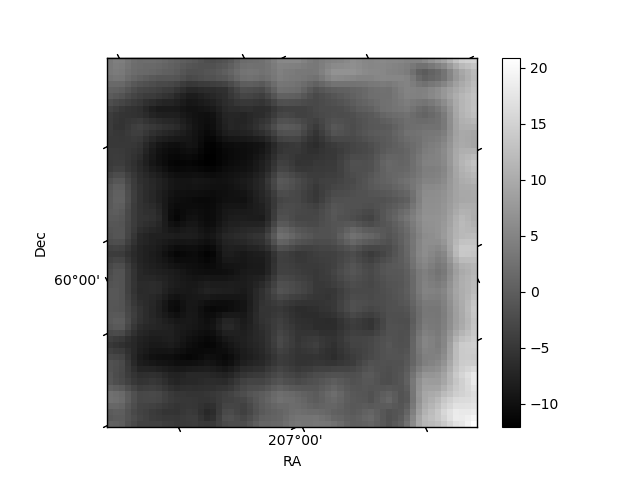
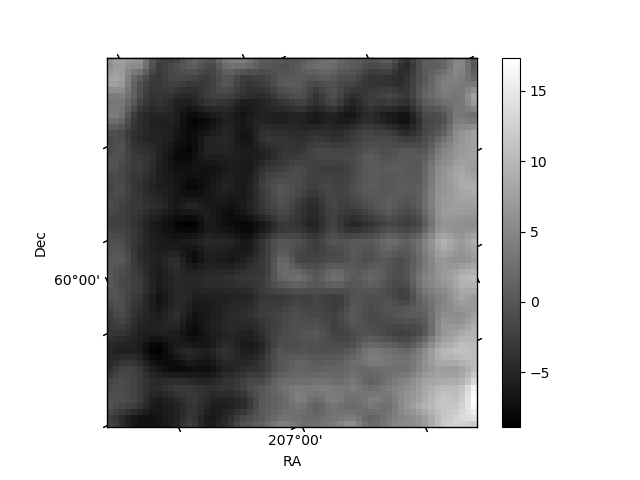
Histogram calculated using DETX and DETY for each event in the final _common_clean file
| Quadrant A |  |
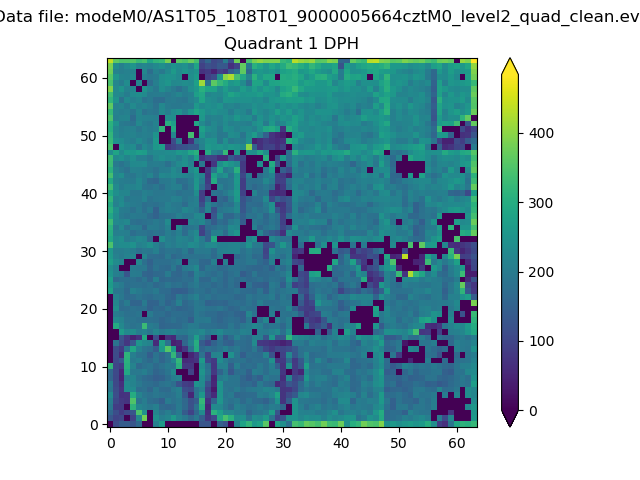 |
Quadrant B |
|---|---|---|---|
| Quadrant D | 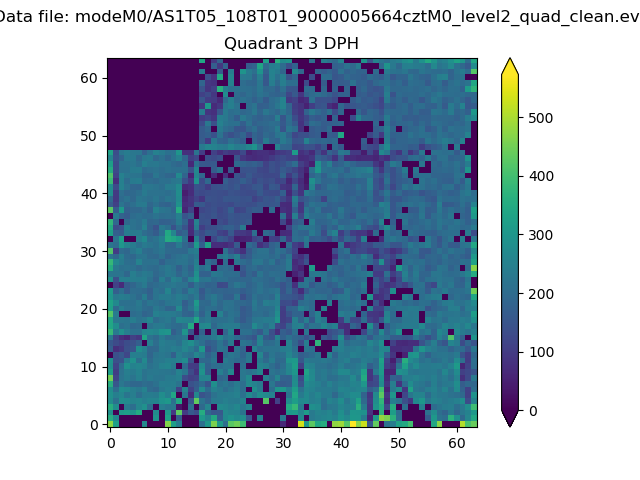 |
 |
Quadrant C |
| Plot type | Count rate plots | Images |
|---|---|---|
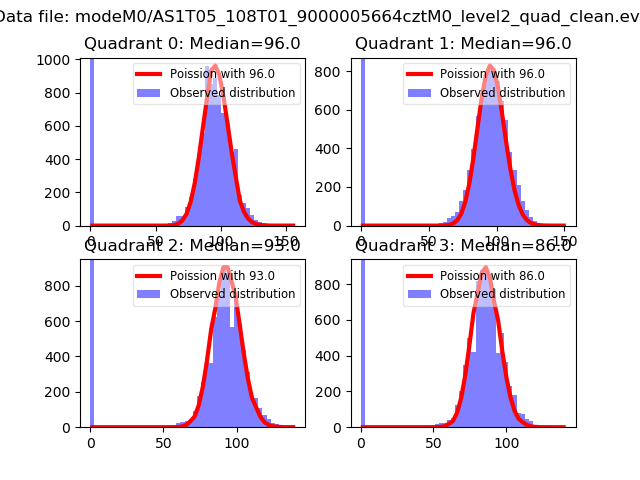
| Comparison with Poisson distribution Blue bars denote a histogram of data divided into 1 sec bins. Red curve is a Poisson curve with rate = median count rate of data. |
 |
 |
| Quadrant-wise count rates Data is divided into 100 sec bins |
 |
|
| Module-wise count rates for Quadrant A Data is divided into 100 sec bins |
 |
 |
| Module-wise count rates for Quadrant B Data is divided into 100 sec bins |
 |
 |
| Module-wise count rates for Quadrant C Data is divided into 100 sec bins |
 |
 |
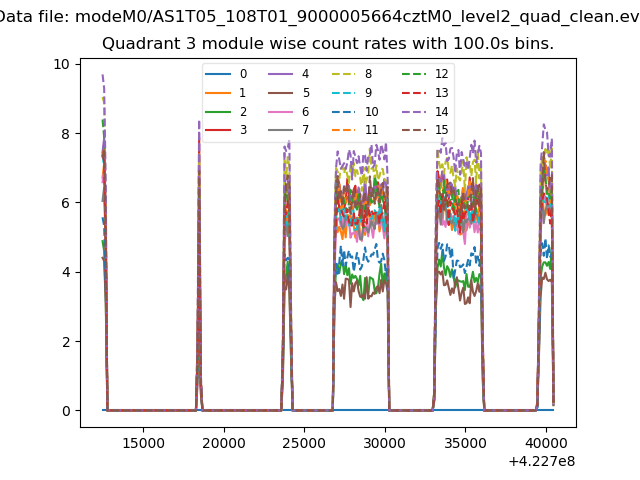
| Module-wise count rates for Quadrant D Data is divided into 100 sec bins |
 |
 |
| Parameter | Plot |
|---|---|
| CZT HV Monitor |  |
| D_VDD | 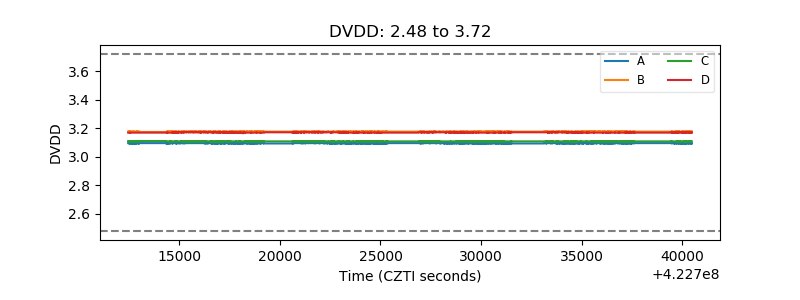 |
| Temperature 1 |  |
| Veto HV Monitor | 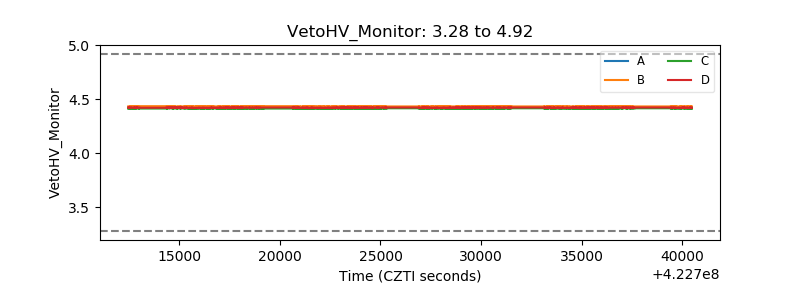 |
| Veto LLD |  |
| Alpha Counter | 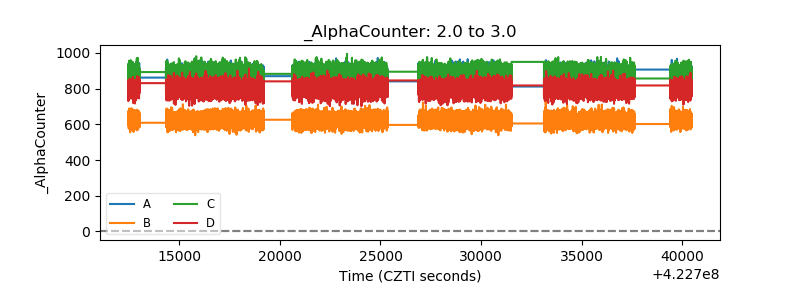 |
| _CPM_Rate |  |
| CZT Counter |  |
| +2.5 Volts monitor | 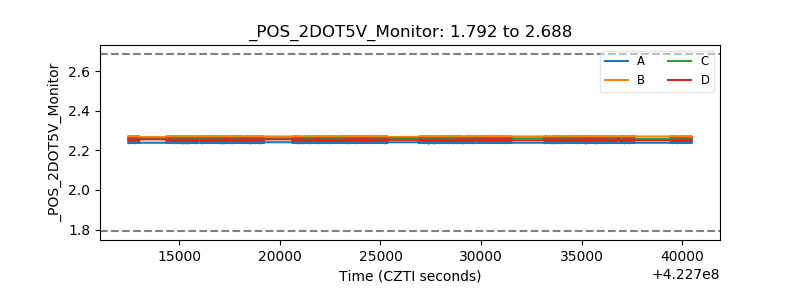 |
| +5 Volts monitor |  |
| _ROLL_ROT |  |
| _Roll_DEC |  |
| _Roll_RA |  |
| Veto Counter |  |