| Param | Original file | Final file |
|---|---|---|
| Filename | modeM0/AS1A12_044T21_9000005688cztM0_level2.fits | modeM0/AS1A12_044T21_9000005688cztM0_level2_quad_clean.evt |
| Size (bytes) | 425,831,040 | 440,510,400 |
| Size | 406.1 MB | 420.1 MB |
| Events in quadrant A | 2,544,026 | 2,651,216 |
| Events in quadrant B | 2,444,370 | 2,662,843 |
| Events in quadrant C | 2,493,120 | 2,508,896 |
| Events in quadrant D | 2,121,452 | 2,225,215 |
| Mode SS | |||
|---|---|---|---|
| Quadrant | BADHDUFLAG | Total packets | Discarded packets |
| A | 0 | 978 | 0 |
| B | 0 | 978 | 0 |
| C | 0 | 978 | 0 |
| D | 0 | 978 | 0 |
| Mode M9 | |||
|---|---|---|---|
| Quadrant | BADHDUFLAG | Total packets | Discarded packets |
| A | 0 | 161 | 0 |
| B | 0 | 161 | 0 |
| C | 0 | 161 | 0 |
| D | 0 | 161 | 0 |
| Mode M0 | |||
|---|---|---|---|
| Quadrant | BADHDUFLAG | Total packets | Discarded packets |
| A | 0 | 103084 | 0 |
| B | 0 | 98058 | 0 |
| C | 0 | 99811 | 0 |
| D | 0 | 124165 | 0 |
| Quadrant | Total seconds | Saturated seconds | Saturation percentage |
|---|---|---|---|
| A | 47983 | 96 | 0.200071% |
| B | 47983 | 134 | 0.279266% |
| C | 47983 | 366 | 0.762770% |
| D | 47983 | 2315 | 4.824625% |
Noise dominated data is calculated using 1-second bins in cleaned event files. If a bin has >2000 counts, and if more than 50% of those come from <1% of pixels, then it is considered to be noise-dominated and hence unusable.
| Quadrant | # 1 sec bins | Bins with >0 counts | Bins with >2000 counts | High rate bins dominated by noise | Noise dominated (total time) | Noise dominated (detector-on time) | Marked lightcurve |
|---|---|---|---|---|---|---|---|
| A | 64022 | 47982 | 0 | 0 | 0.00% | 0.00% |  |
| B | 64022 | 47983 | 0 | 0 | 0.00% | 0.00% | 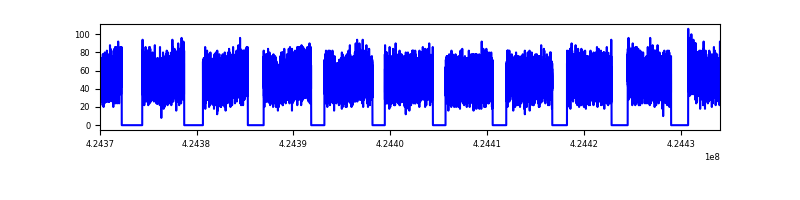 |
| C | 64022 | 47972 | 0 | 0 | 0.00% | 0.00% |  |
| D | 64021 | 47938 | 0 | 0 | 0.00% | 0.00% | 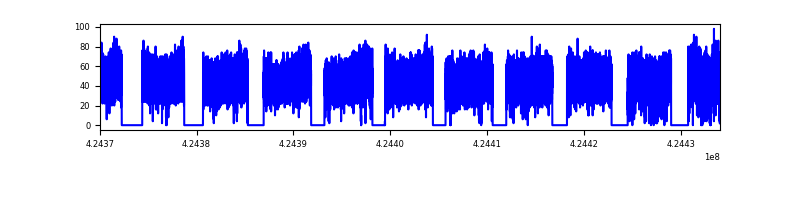 |
Top three noisy pixels from each quadrant. If the there are fewer than three noisy pixels in the level2.evt file, extra rows are filled as -1
| Pixel properties | Quadrant properties | ||||||
|---|---|---|---|---|---|---|---|
| Quadrant | DetID | PixID | Counts | Sigma | Mean | Median | Sigma |
| A | 7 | 110 | 2119 | 8.82 | 663 | 618 | 170.2 |
| A | 0 | 29 | 2039 | 8.35 | 663 | 618 | 170.2 |
| A | 9 | 19 | 2001 | 8.13 | 663 | 618 | 170.2 |
| B | 2 | 9 | 2118 | 11.74 | 644 | 611 | 128.4 |
| B | 3 | 17 | 1803 | 9.29 | 644 | 611 | 128.4 |
| B | 3 | 80 | 1721 | 8.65 | 644 | 611 | 128.4 |
| C | 1 | 81 | 2089 | 8.72 | 657 | 613 | 169.2 |
| C | 1 | 80 | 1973 | 8.04 | 657 | 613 | 169.2 |
| C | 3 | 203 | 1965 | 7.99 | 657 | 613 | 169.2 |
| D | 7 | 3 | 1663 | 6.78 | 607 | 551 | 164.1 |
| D | 6 | 38 | 1536 | 6.0 | 607 | 551 | 164.1 |
| D | 10 | 113 | 1513 | 5.86 | 607 | 551 | 164.1 |
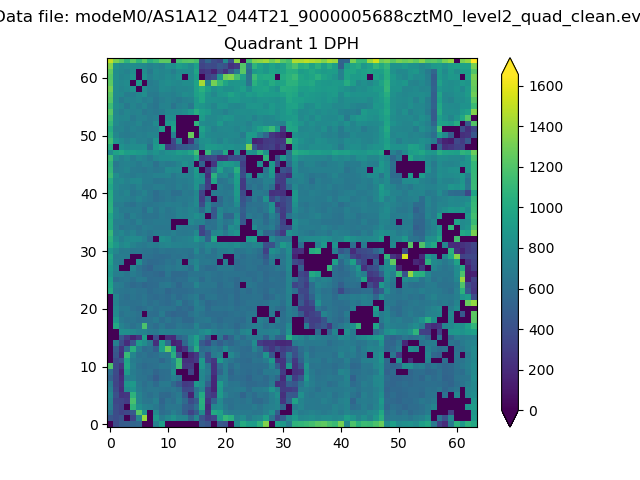
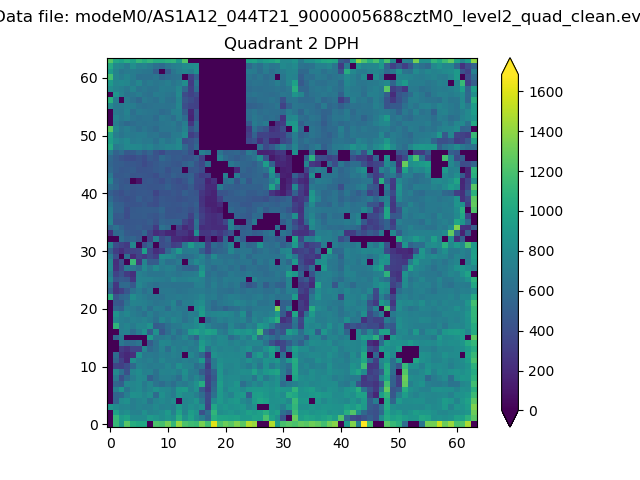
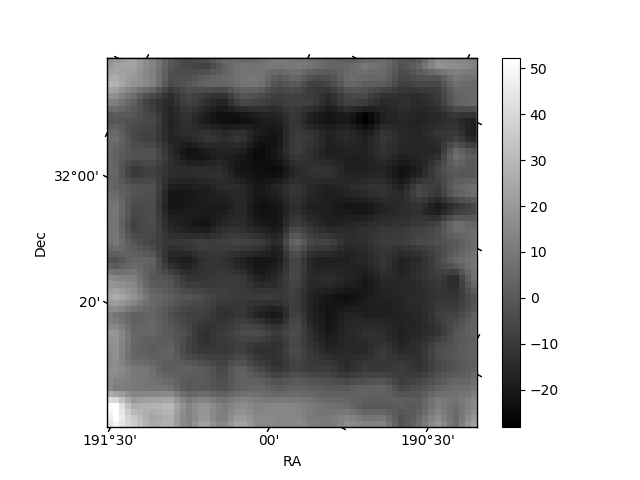
Histogram calculated using DETX and DETY for each event in the final _common_clean file
| Quadrant A |  |
 |
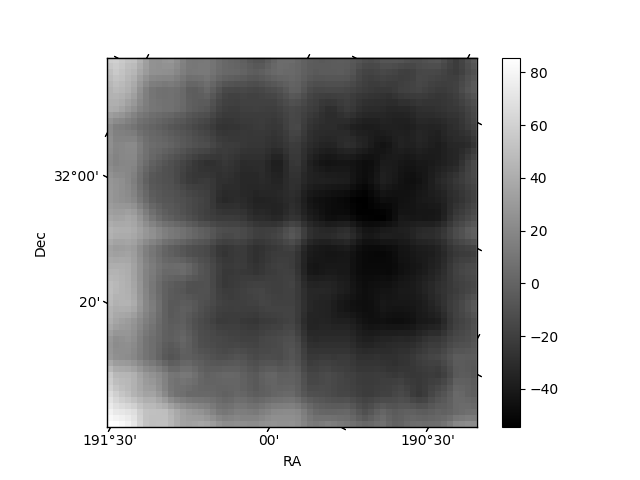
Quadrant B |
|---|---|---|---|
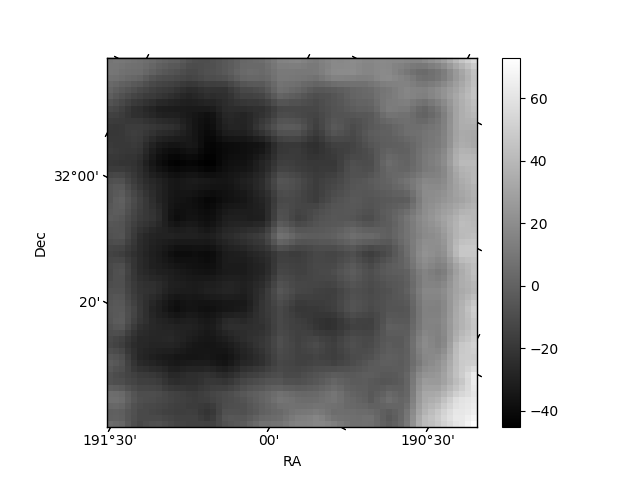
| Quadrant D |  |
 |
Quadrant C |
| Plot type | Count rate plots | Images |
|---|---|---|
| Comparison with Poisson distribution Blue bars denote a histogram of data divided into 1 sec bins. Red curve is a Poisson curve with rate = median count rate of data. |
 |
 |
| Quadrant-wise count rates Data is divided into 100 sec bins |
 |
|
| Module-wise count rates for Quadrant A Data is divided into 100 sec bins |
 |
 |
| Module-wise count rates for Quadrant B Data is divided into 100 sec bins |
 |
 |
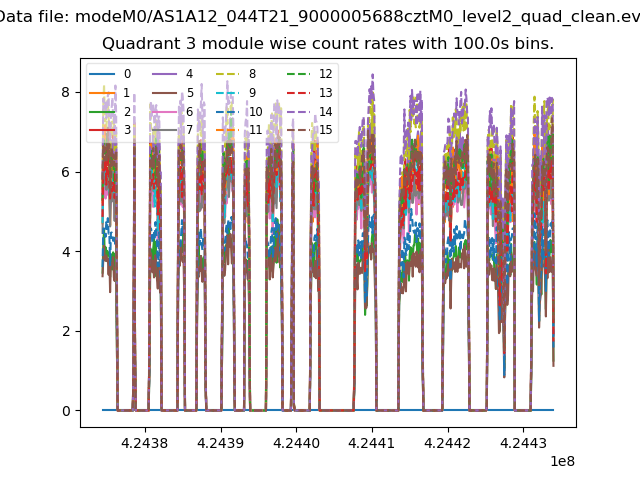
| Module-wise count rates for Quadrant C Data is divided into 100 sec bins |
 |
 |
| Module-wise count rates for Quadrant D Data is divided into 100 sec bins |
 |
 |
| Parameter | Plot |
|---|---|
| CZT HV Monitor | 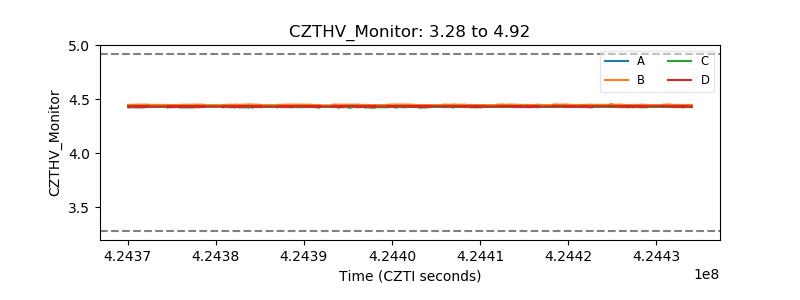 |
| D_VDD |  |
| Temperature 1 |  |
| Veto HV Monitor |  |
| Veto LLD | 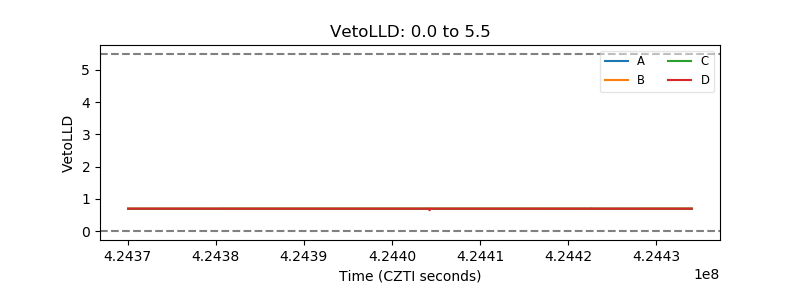 |
| Alpha Counter |  |
| _CPM_Rate |  |
| CZT Counter | 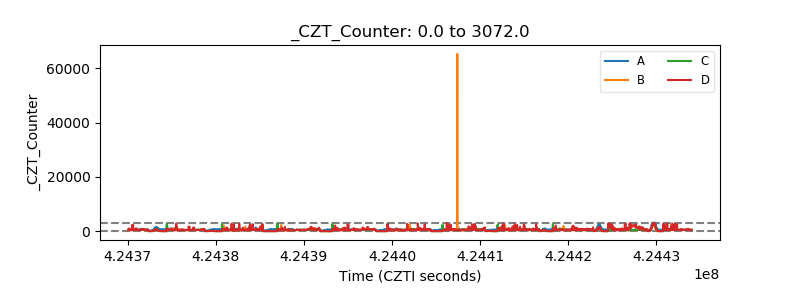 |
| +2.5 Volts monitor |  |
| +5 Volts monitor |  |
| _ROLL_ROT | 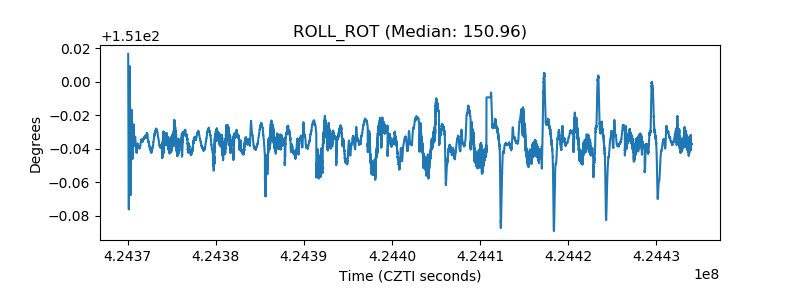 |
| _Roll_DEC |  |
| _Roll_RA | 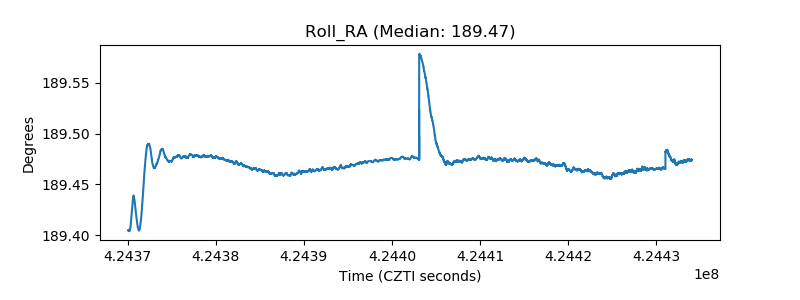 |
| Veto Counter |  |