| Param | Original file | Final file |
|---|---|---|
| Filename | modeM0/AS1T05_110T01_9000005686cztM0_level2.fits | modeM0/AS1T05_110T01_9000005686cztM0_level2_quad_clean.evt |
| Size (bytes) | 135,754,560 | 142,683,840 |
| Size | 129.5 MB | 136.1 MB |
| Events in quadrant A | 830,610 | 873,524 |
| Events in quadrant B | 793,160 | 867,117 |
| Events in quadrant C | 807,370 | 839,727 |
| Events in quadrant D | 698,664 | 758,551 |
| Mode SS | |||
|---|---|---|---|
| Quadrant | BADHDUFLAG | Total packets | Discarded packets |
| A | 0 | 288 | 0 |
| B | 0 | 288 | 0 |
| C | 0 | 288 | 0 |
| D | 0 | 288 | 0 |
| Mode M0 | |||
|---|---|---|---|
| Quadrant | BADHDUFLAG | Total packets | Discarded packets |
| A | 0 | 31548 | 0 |
| B | 0 | 29598 | 0 |
| C | 0 | 30673 | 0 |
| D | 0 | 36436 | 0 |
| Mode M9 | |||
|---|---|---|---|
| Quadrant | BADHDUFLAG | Total packets | Discarded packets |
| A | 0 | 82 | 0 |
| B | 0 | 82 | 0 |
| C | 0 | 82 | 0 |
| D | 0 | 82 | 0 |
| Quadrant | Total seconds | Saturated seconds | Saturation percentage |
|---|---|---|---|
| A | 14232 | 37 | 0.259978% |
| B | 14232 | 45 | 0.316189% |
| C | 14232 | 210 | 1.475548% |
| D | 14232 | 572 | 4.019112% |
Noise dominated data is calculated using 1-second bins in cleaned event files. If a bin has >2000 counts, and if more than 50% of those come from <1% of pixels, then it is considered to be noise-dominated and hence unusable.
| Quadrant | # 1 sec bins | Bins with >0 counts | Bins with >2000 counts | High rate bins dominated by noise | Noise dominated (total time) | Noise dominated (detector-on time) | Marked lightcurve |
|---|---|---|---|---|---|---|---|
| A | 22245 | 14232 | 0 | 0 | 0.00% | 0.00% | 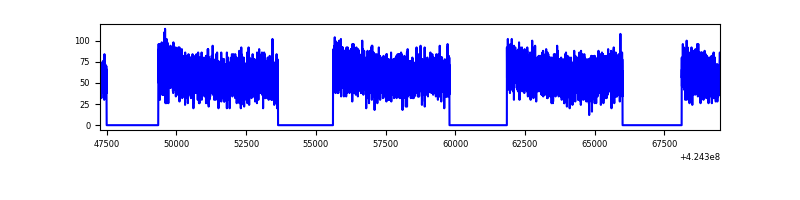 |
| B | 22245 | 14232 | 0 | 0 | 0.00% | 0.00% | 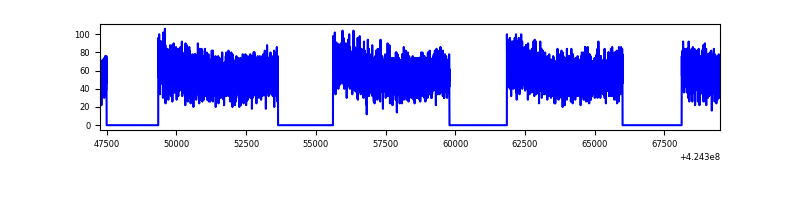 |
| C | 22245 | 14230 | 0 | 0 | 0.00% | 0.00% | 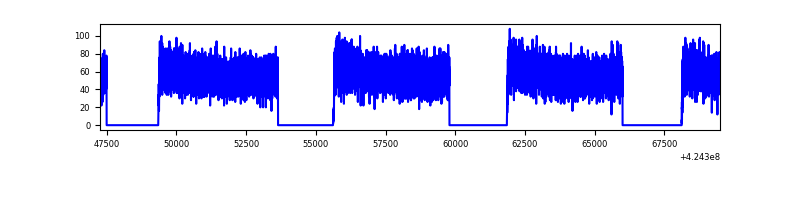 |
| D | 22245 | 14207 | 0 | 0 | 0.00% | 0.00% | 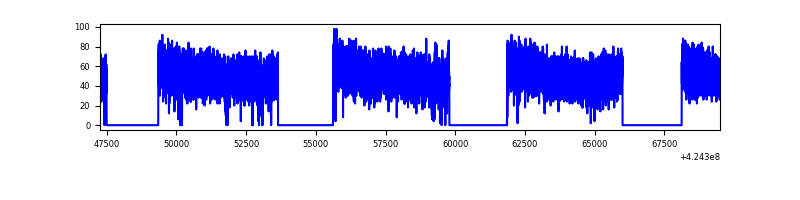 |
Top three noisy pixels from each quadrant. If the there are fewer than three noisy pixels in the level2.evt file, extra rows are filled as -1
| Pixel properties | Quadrant properties | ||||||
|---|---|---|---|---|---|---|---|
| Quadrant | DetID | PixID | Counts | Sigma | Mean | Median | Sigma |
| A | 7 | 110 | 677 | 8.37 | 217 | 205 | 56.4 |
| A | 9 | 19 | 662 | 8.1 | 217 | 205 | 56.4 |
| A | 14 | 95 | 652 | 7.92 | 217 | 205 | 56.4 |
| B | 2 | 9 | 602 | 9.57 | 209 | 201 | 41.9 |
| B | 5 | 128 | 578 | 9.0 | 209 | 201 | 41.9 |
| B | 3 | 80 | 563 | 8.64 | 209 | 201 | 41.9 |
| C | 1 | 81 | 655 | 8.09 | 213 | 202 | 56.0 |
| C | 1 | 80 | 636 | 7.75 | 213 | 202 | 56.0 |
| C | 3 | 187 | 555 | 6.3 | 213 | 202 | 56.0 |
| D | 4 | 160 | 539 | 6.52 | 200 | 183 | 54.6 |
| D | 10 | 113 | 523 | 6.23 | 200 | 183 | 54.6 |
| D | 10 | 189 | 521 | 6.19 | 200 | 183 | 54.6 |
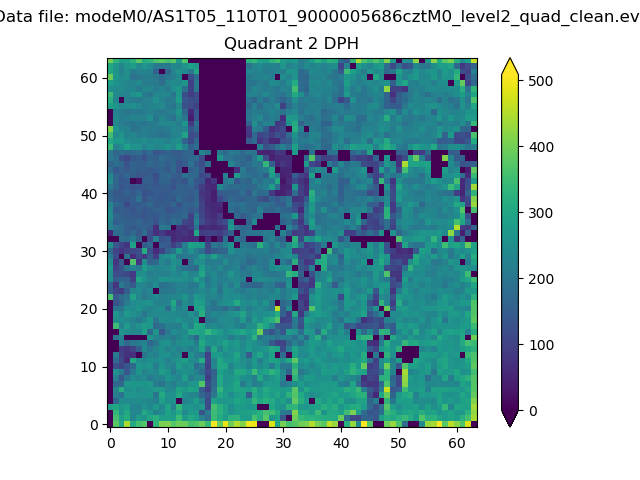
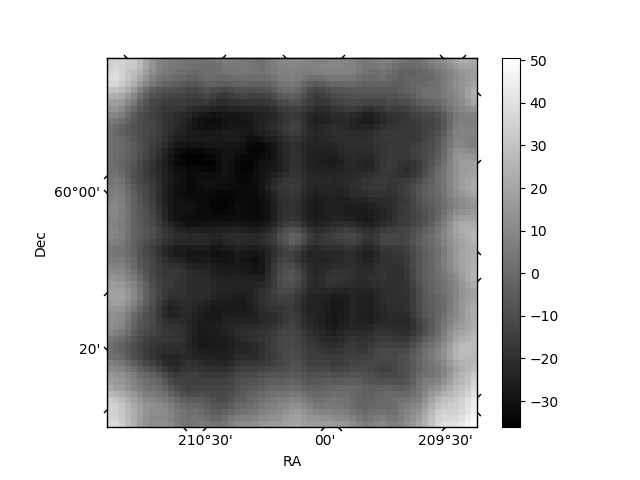
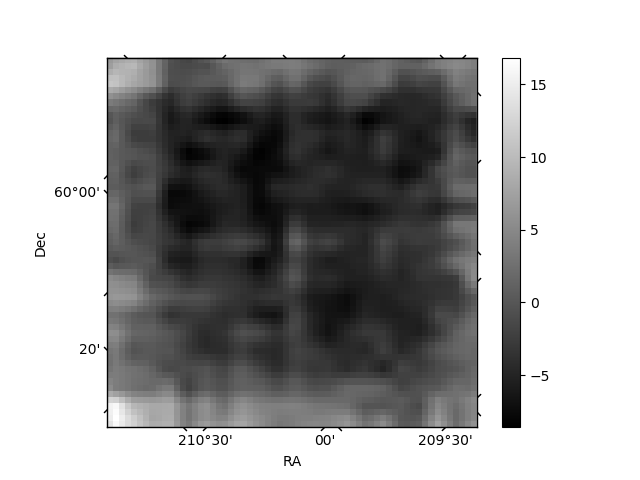
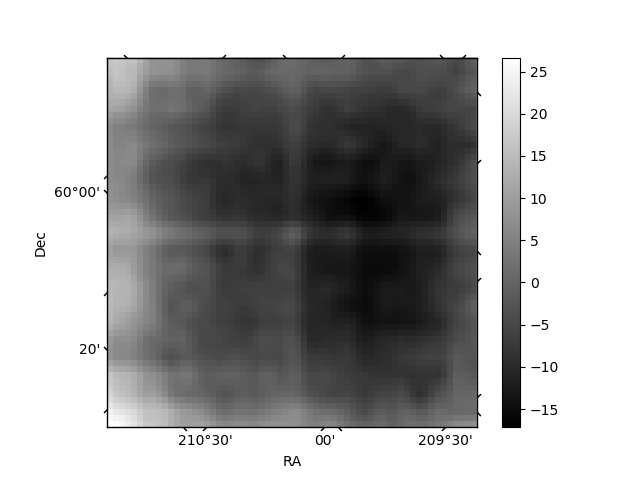
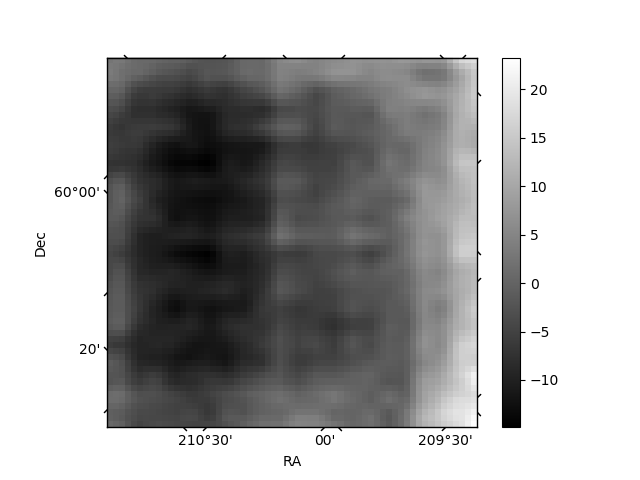
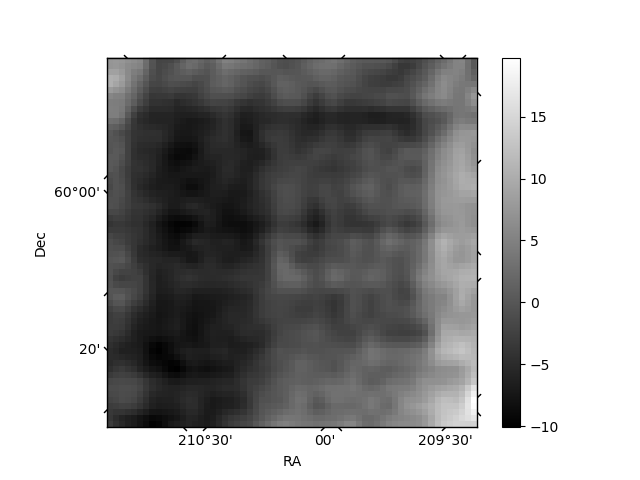
Histogram calculated using DETX and DETY for each event in the final _common_clean file
| Quadrant A | 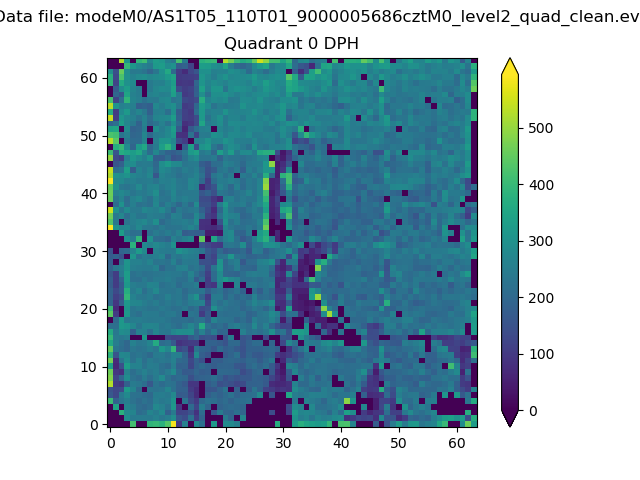 |
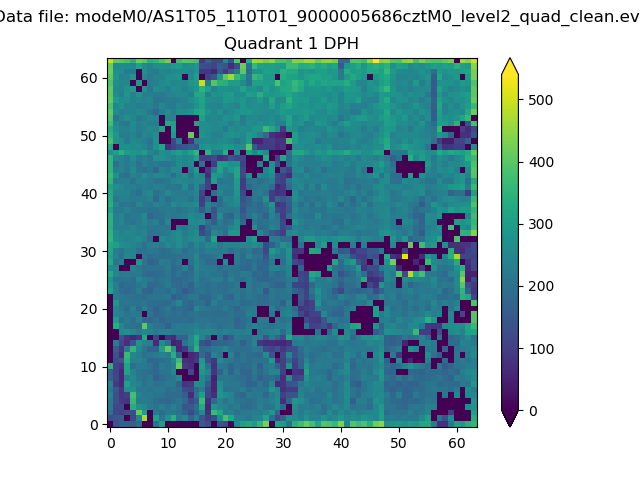 |
Quadrant B |
|---|---|---|---|
| Quadrant D | 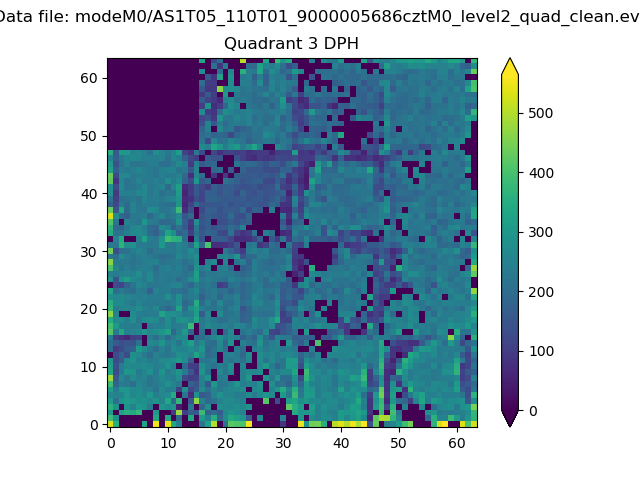 |
 |
Quadrant C |
| Plot type | Count rate plots | Images |
|---|---|---|
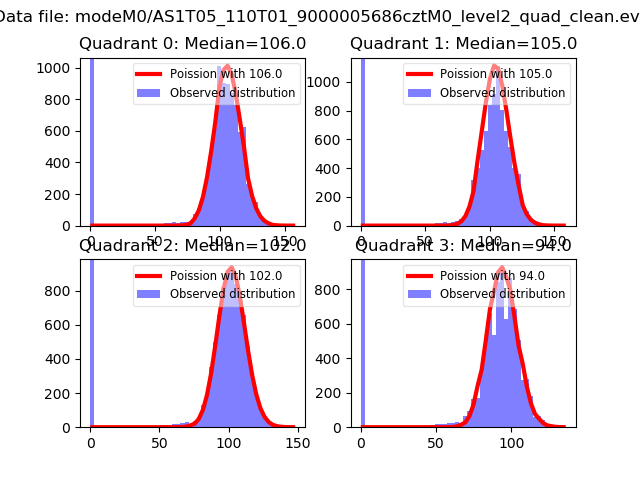
| Comparison with Poisson distribution Blue bars denote a histogram of data divided into 1 sec bins. Red curve is a Poisson curve with rate = median count rate of data. |
 |
 |
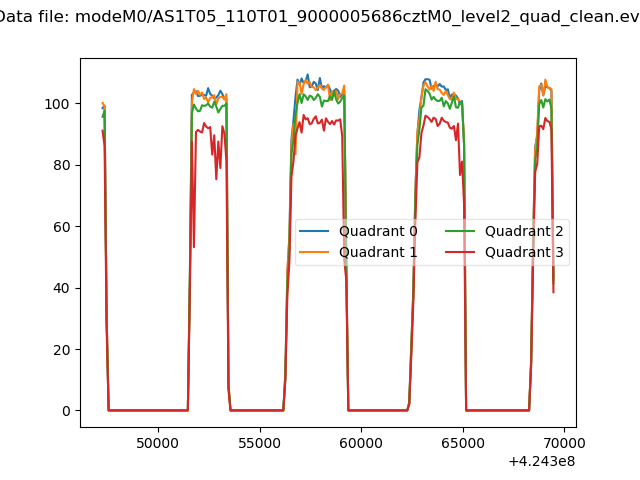
| Quadrant-wise count rates Data is divided into 100 sec bins |
 |
|
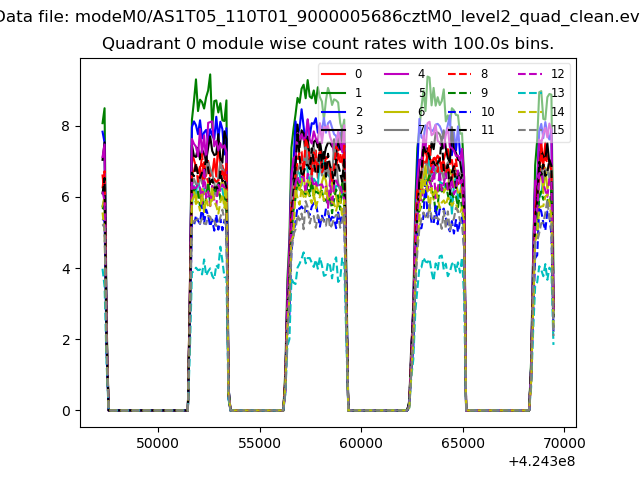
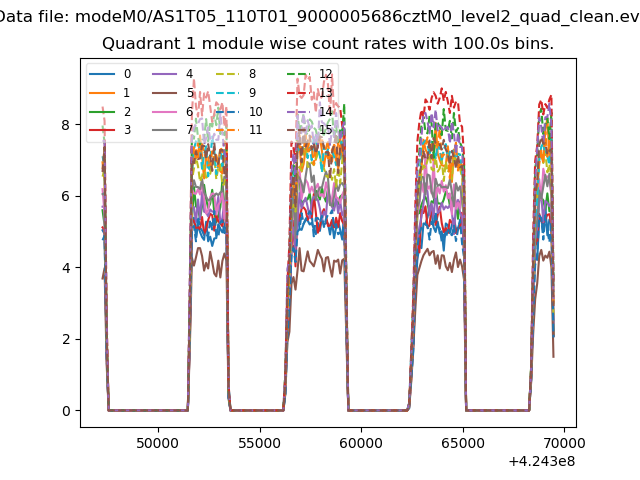
| Module-wise count rates for Quadrant A Data is divided into 100 sec bins |
 |
 |
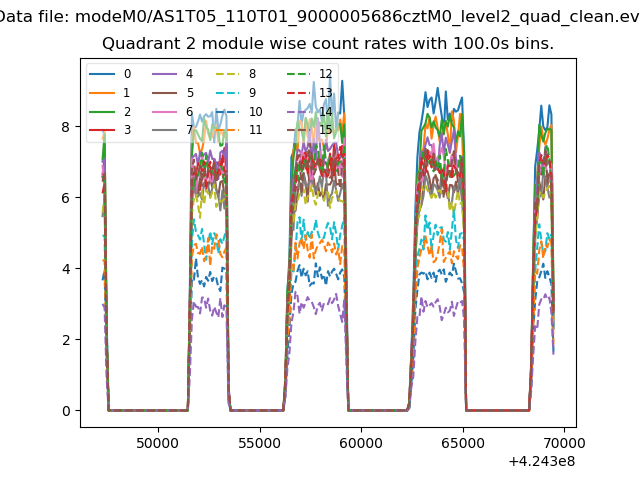
| Module-wise count rates for Quadrant B Data is divided into 100 sec bins |
 |
 |
| Module-wise count rates for Quadrant C Data is divided into 100 sec bins |
 |
 |
| Module-wise count rates for Quadrant D Data is divided into 100 sec bins |
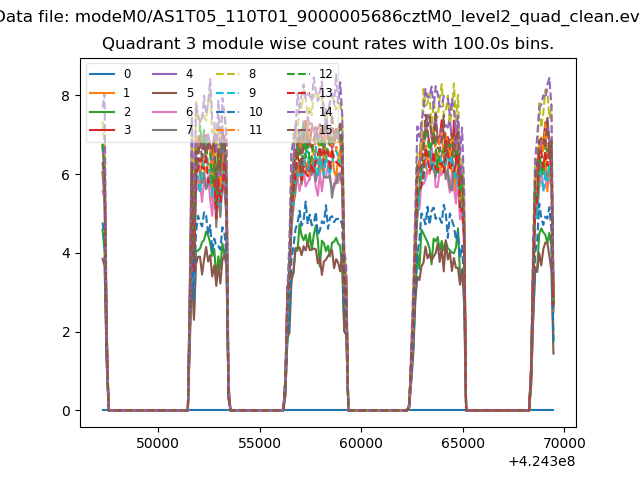 |
 |
| Parameter | Plot |
|---|---|
| CZT HV Monitor | 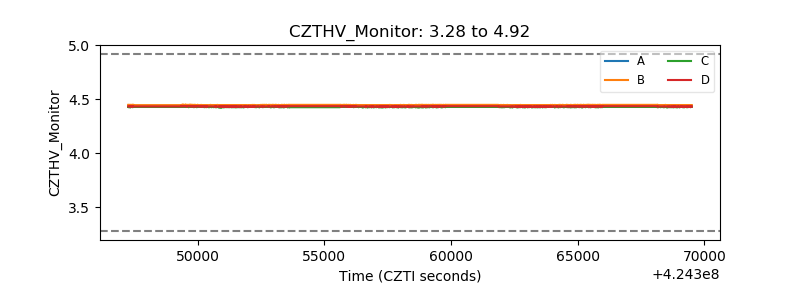 |
| D_VDD | 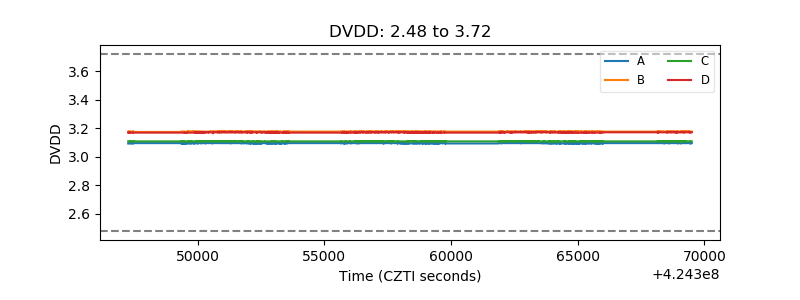 |
| Temperature 1 |  |
| Veto HV Monitor | 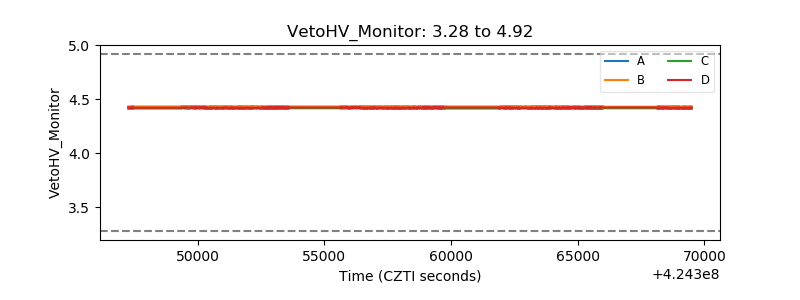 |
| Veto LLD | 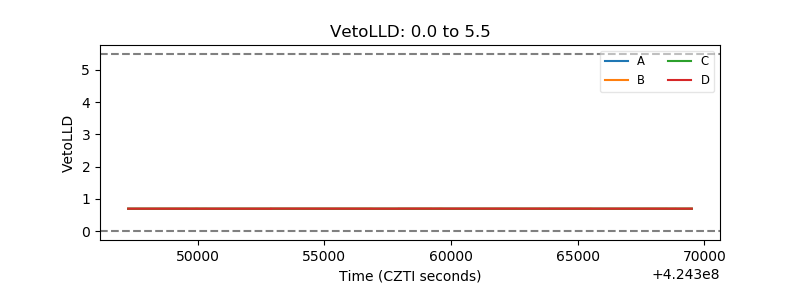 |
| Alpha Counter | 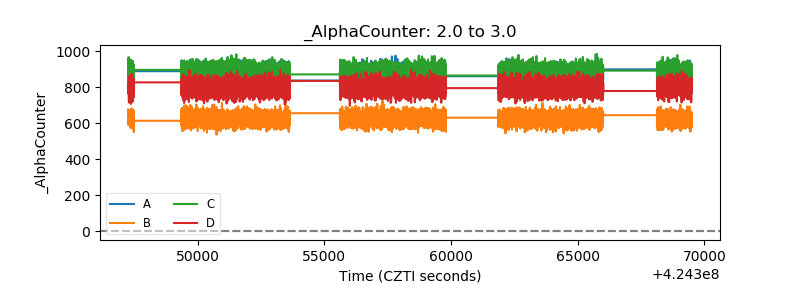 |
| _CPM_Rate | 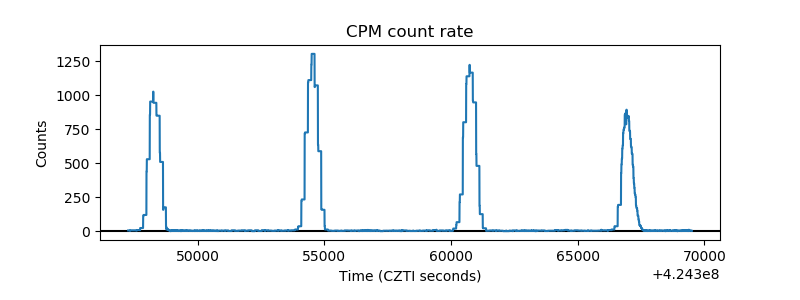 |
| CZT Counter | 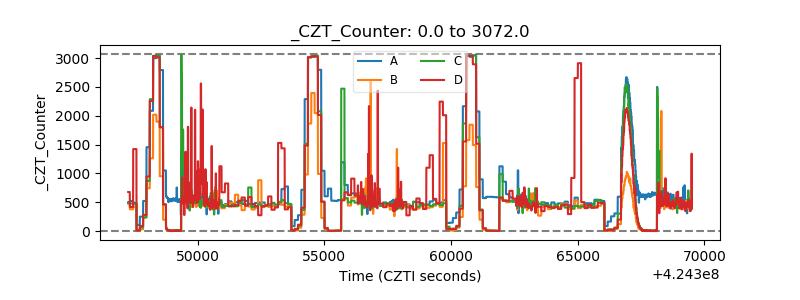 |
| +2.5 Volts monitor | 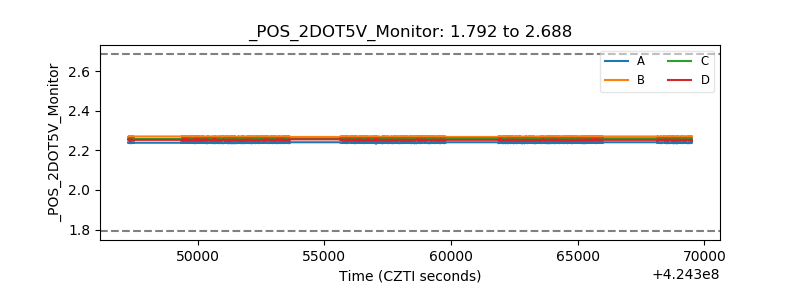 |
| +5 Volts monitor | 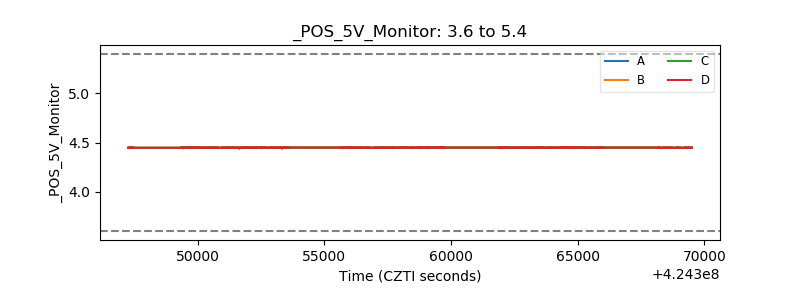 |
| _ROLL_ROT | 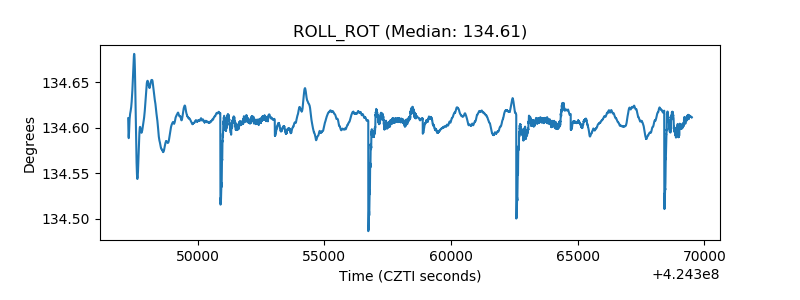 |
| _Roll_DEC | 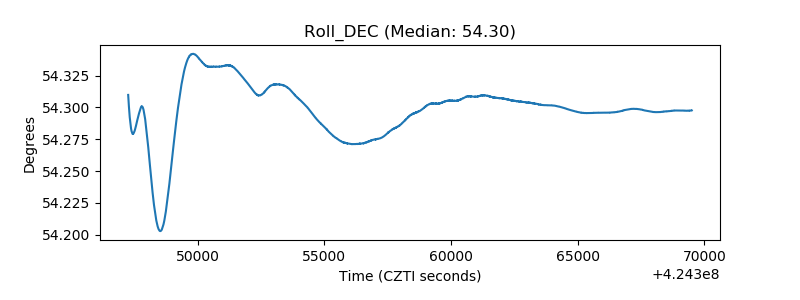 |
| _Roll_RA | 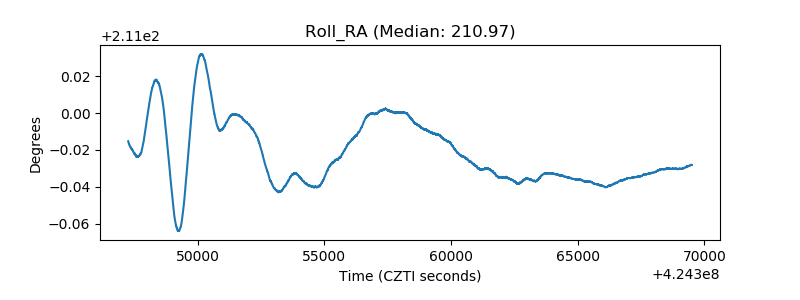 |
| Veto Counter | 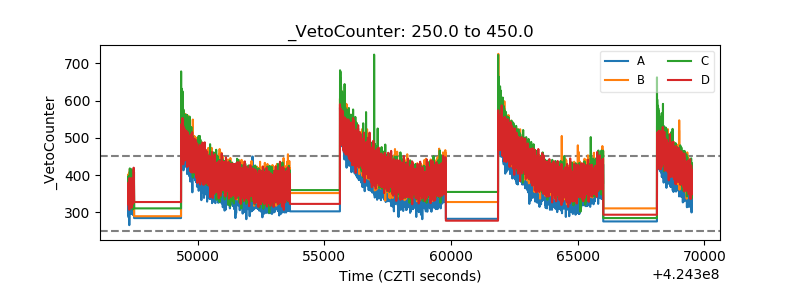 |