| Param | Original file | Final file |
|---|---|---|
| Filename | modeM0/AS1A12_035T02_9000005690cztM0_level2.fits | modeM0/AS1A12_035T02_9000005690cztM0_level2_quad_clean.evt |
| Size (bytes) | 350,208,000 | 407,724,480 |
| Size | 334.0 MB | 388.8 MB |
| Events in quadrant A | 2,129,310 | 2,577,890 |
| Events in quadrant B | 2,037,072 | 2,577,060 |
| Events in quadrant C | 2,053,626 | 2,431,628 |
| Events in quadrant D | 1,740,990 | 2,117,872 |
| Mode M9 | |||
|---|---|---|---|
| Quadrant | BADHDUFLAG | Total packets | Discarded packets |
| A | 0 | 157 | 0 |
| B | 0 | 157 | 0 |
| C | 0 | 157 | 0 |
| D | 0 | 157 | 0 |
| Mode M0 | |||
|---|---|---|---|
| Quadrant | BADHDUFLAG | Total packets | Discarded packets |
| A | 0 | 85411 | 0 |
| B | 0 | 81678 | 0 |
| C | 0 | 81728 | 0 |
| D | 0 | 110698 | 0 |
| Mode SS | |||
|---|---|---|---|
| Quadrant | BADHDUFLAG | Total packets | Discarded packets |
| A | 0 | 784 | 0 |
| B | 0 | 784 | 0 |
| C | 0 | 784 | 0 |
| D | 0 | 784 | 0 |
| Quadrant | Total seconds | Saturated seconds | Saturation percentage |
|---|---|---|---|
| A | 38513 | 140 | 0.363514% |
| B | 38512 | 262 | 0.680307% |
| C | 38511 | 581 | 1.508660% |
| D | 38508 | 2523 | 6.551885% |
Noise dominated data is calculated using 1-second bins in cleaned event files. If a bin has >2000 counts, and if more than 50% of those come from <1% of pixels, then it is considered to be noise-dominated and hence unusable.
| Quadrant | # 1 sec bins | Bins with >0 counts | Bins with >2000 counts | High rate bins dominated by noise | Noise dominated (total time) | Noise dominated (detector-on time) | Marked lightcurve |
|---|---|---|---|---|---|---|---|
| A | 52768 | 38513 | 0 | 0 | 0.00% | 0.00% | 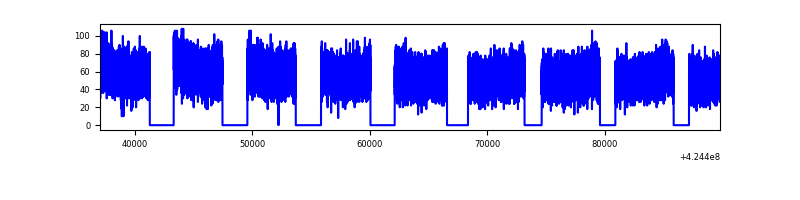 |
| B | 52768 | 38514 | 0 | 0 | 0.00% | 0.00% |  |
| C | 52768 | 38491 | 0 | 0 | 0.00% | 0.00% |  |
| D | 52767 | 38485 | 0 | 0 | 0.00% | 0.00% |  |
Top three noisy pixels from each quadrant. If the there are fewer than three noisy pixels in the level2.evt file, extra rows are filled as -1
| Pixel properties | Quadrant properties | ||||||
|---|---|---|---|---|---|---|---|
| Quadrant | DetID | PixID | Counts | Sigma | Mean | Median | Sigma |
| A | 7 | 110 | 1741 | 8.6 | 556 | 522 | 141.8 |
| A | 9 | 19 | 1724 | 8.48 | 556 | 522 | 141.8 |
| A | 0 | 29 | 1713 | 8.4 | 556 | 522 | 141.8 |
| B | 2 | 9 | 1802 | 12.01 | 539 | 514 | 107.2 |
| B | 3 | 80 | 1435 | 8.59 | 539 | 514 | 107.2 |
| B | 3 | 17 | 1428 | 8.52 | 539 | 514 | 107.2 |
| C | 1 | 81 | 1744 | 8.9 | 541 | 506 | 139.1 |
| C | 1 | 80 | 1663 | 8.32 | 541 | 506 | 139.1 |
| C | 3 | 202 | 1617 | 7.98 | 541 | 506 | 139.1 |
| D | 4 | 160 | 1285 | 6.17 | 498 | 454 | 134.7 |
| D | 6 | 83 | 1269 | 6.05 | 498 | 454 | 134.7 |
| D | 10 | 189 | 1261 | 5.99 | 498 | 454 | 134.7 |
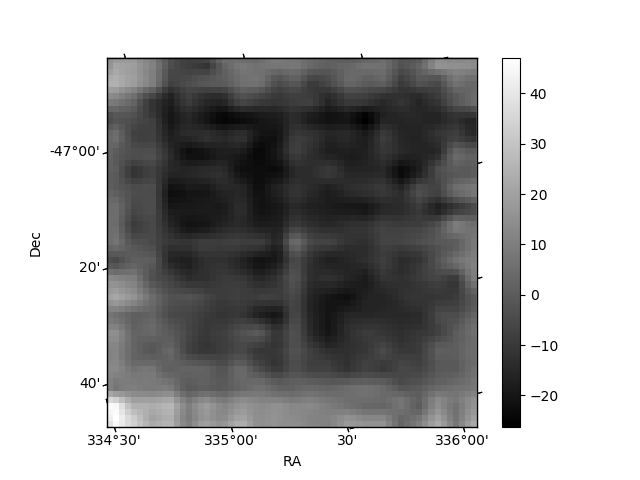
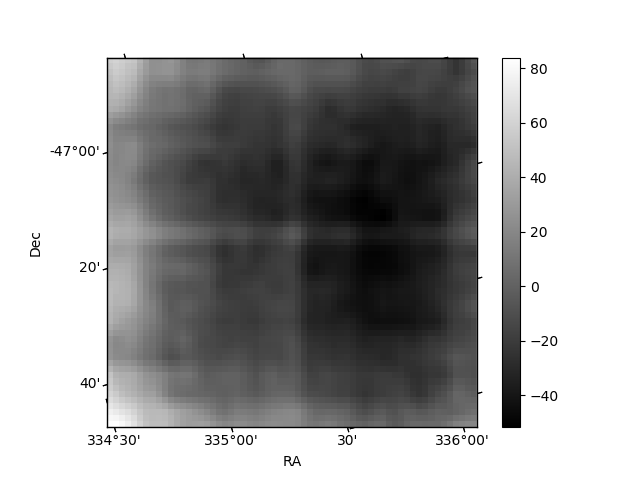
Histogram calculated using DETX and DETY for each event in the final _common_clean file
| Quadrant A | 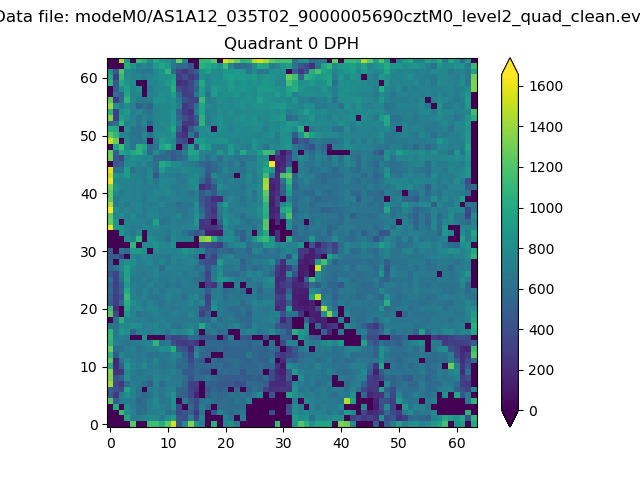 |
 |
Quadrant B |
|---|---|---|---|
| Quadrant D |  |
 |
Quadrant C |
| Plot type | Count rate plots | Images |
|---|---|---|
| Comparison with Poisson distribution Blue bars denote a histogram of data divided into 1 sec bins. Red curve is a Poisson curve with rate = median count rate of data. |
 |
 |
| Quadrant-wise count rates Data is divided into 100 sec bins |
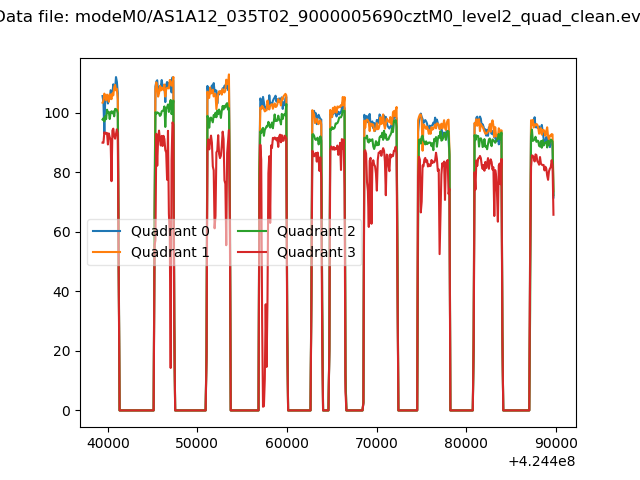 |
|
| Module-wise count rates for Quadrant A Data is divided into 100 sec bins |
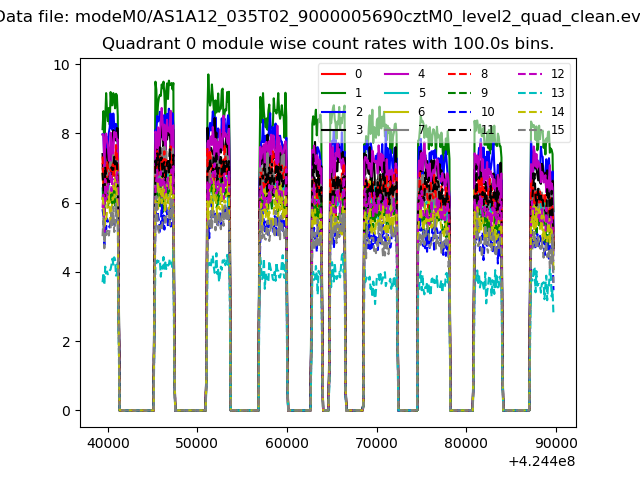 |
 |
| Module-wise count rates for Quadrant B Data is divided into 100 sec bins |
 |
 |
| Module-wise count rates for Quadrant C Data is divided into 100 sec bins |
 |
 |
| Module-wise count rates for Quadrant D Data is divided into 100 sec bins |
 |
 |
| Parameter | Plot |
|---|---|
| CZT HV Monitor |  |
| D_VDD |  |
| Temperature 1 |  |
| Veto HV Monitor |  |
| Veto LLD |  |
| Alpha Counter | 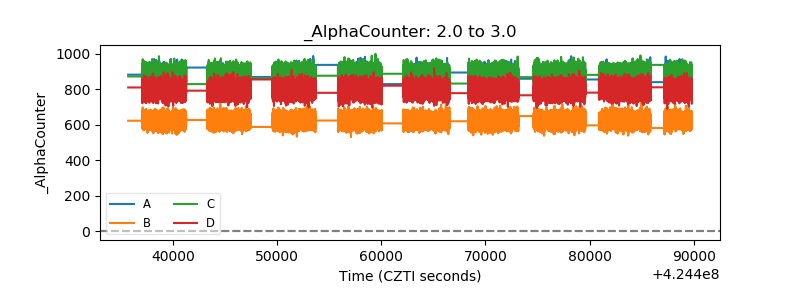 |
| _CPM_Rate | 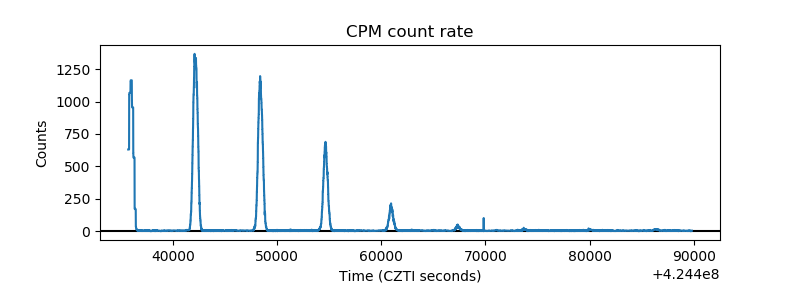 |
| CZT Counter |  |
| +2.5 Volts monitor | 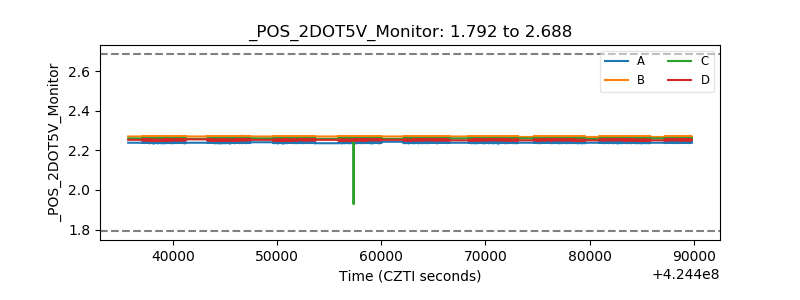 |
| +5 Volts monitor |  |
| _ROLL_ROT |  |
| _Roll_DEC | 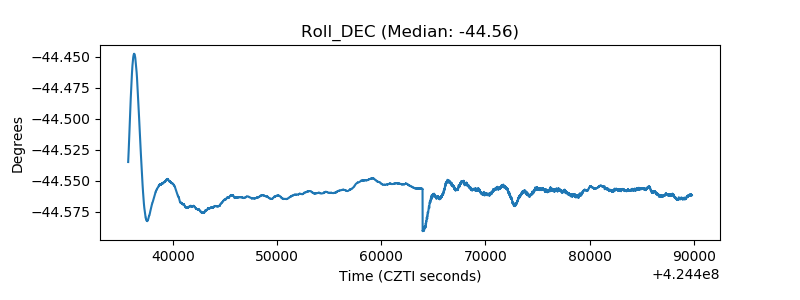 |
| _Roll_RA | 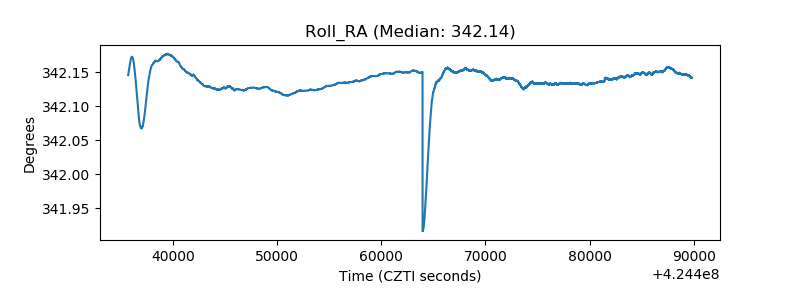 |
| Veto Counter |  |