| Param | Original file | Final file |
|---|---|---|
| Filename | modeM0/AS1A12_077T12_9000005692cztM0_level2.fits | modeM0/AS1A12_077T12_9000005692cztM0_level2_quad_clean.evt |
| Size (bytes) | 944,559,360 | 1,011,741,120 |
| Size | 900.8 MB | 964.9 MB |
| Events in quadrant A | 5,742,136 | 6,272,934 |
| Events in quadrant B | 5,499,444 | 6,283,305 |
| Events in quadrant C | 5,527,998 | 5,869,913 |
| Events in quadrant D | 4,711,322 | 5,093,111 |
| Mode M9 | |||
|---|---|---|---|
| Quadrant | BADHDUFLAG | Total packets | Discarded packets |
| A | 0 | 421 | 0 |
| B | 0 | 421 | 0 |
| C | 0 | 421 | 0 |
| D | 0 | 421 | 0 |
| Mode M0 | |||
|---|---|---|---|
| Quadrant | BADHDUFLAG | Total packets | Discarded packets |
| A | 0 | 226972 | 0 |
| B | 0 | 213305 | 0 |
| C | 0 | 224264 | 0 |
| D | 0 | 299964 | 0 |
| Mode SS | |||
|---|---|---|---|
| Quadrant | BADHDUFLAG | Total packets | Discarded packets |
| A | 0 | 2126 | 0 |
| B | 0 | 2128 | 0 |
| C | 0 | 2126 | 0 |
| D | 0 | 2126 | 0 |
| Quadrant | Total seconds | Saturated seconds | Saturation percentage |
|---|---|---|---|
| A | 103927 | 311 | 0.299249% |
| B | 103927 | 236 | 0.227082% |
| C | 103926 | 1999 | 1.923484% |
| D | 103927 | 6260 | 6.023459% |
Noise dominated data is calculated using 1-second bins in cleaned event files. If a bin has >2000 counts, and if more than 50% of those come from <1% of pixels, then it is considered to be noise-dominated and hence unusable.
| Quadrant | # 1 sec bins | Bins with >0 counts | Bins with >2000 counts | High rate bins dominated by noise | Noise dominated (total time) | Noise dominated (detector-on time) | Marked lightcurve |
|---|---|---|---|---|---|---|---|
| A | 147346 | 103925 | 0 | 0 | 0.00% | 0.00% |  |
| B | 147345 | 103924 | 0 | 0 | 0.00% | 0.00% | 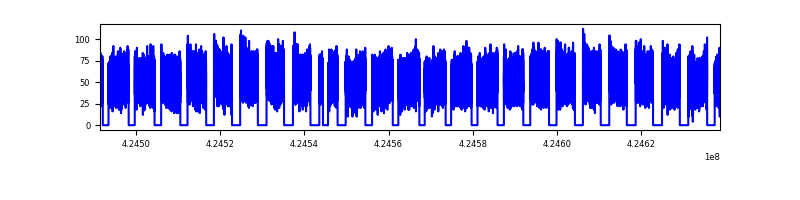 |
| C | 147345 | 103790 | 0 | 0 | 0.00% | 0.00% |  |
| D | 147345 | 103771 | 0 | 0 | 0.00% | 0.00% |  |
Top three noisy pixels from each quadrant. If the there are fewer than three noisy pixels in the level2.evt file, extra rows are filled as -1
| Pixel properties | Quadrant properties | ||||||
|---|---|---|---|---|---|---|---|
| Quadrant | DetID | PixID | Counts | Sigma | Mean | Median | Sigma |
| A | 7 | 110 | 4697 | 8.82 | 1496 | 1396 | 374.2 |
| A | 9 | 19 | 4690 | 8.8 | 1496 | 1396 | 374.2 |
| A | 0 | 29 | 4670 | 8.75 | 1496 | 1396 | 374.2 |
| B | 2 | 9 | 4718 | 11.6 | 1453 | 1379 | 287.8 |
| B | 3 | 80 | 4031 | 9.21 | 1453 | 1379 | 287.8 |
| B | 5 | 128 | 3894 | 8.74 | 1453 | 1379 | 287.8 |
| C | 1 | 81 | 4473 | 8.38 | 1457 | 1361 | 371.3 |
| C | 3 | 202 | 4406 | 8.2 | 1457 | 1361 | 371.3 |
| C | 3 | 203 | 4356 | 8.07 | 1457 | 1361 | 371.3 |
| D | 7 | 3 | 3516 | 6.38 | 1350 | 1230 | 358.5 |
| D | 10 | 189 | 3381 | 6.0 | 1350 | 1230 | 358.5 |
| D | 4 | 160 | 3344 | 5.9 | 1350 | 1230 | 358.5 |
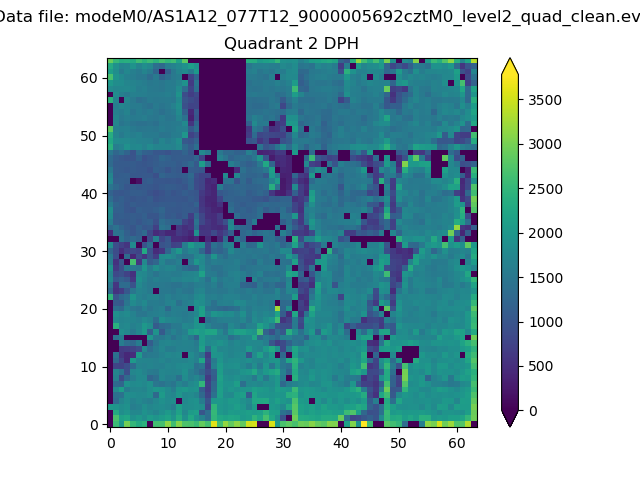
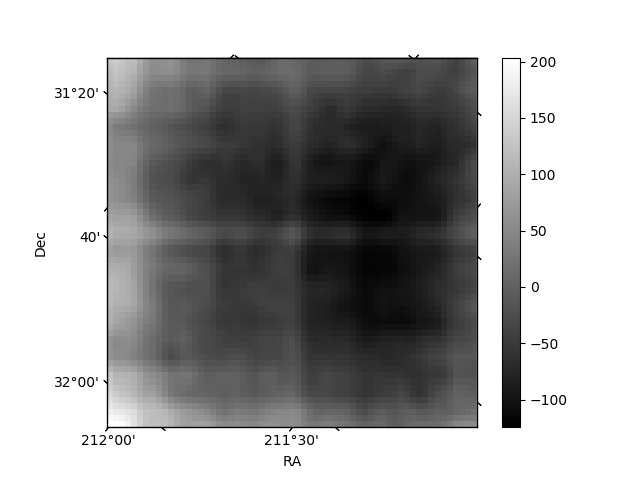
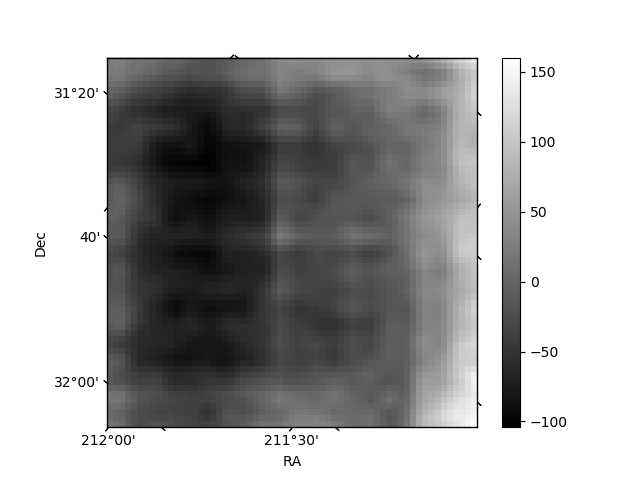
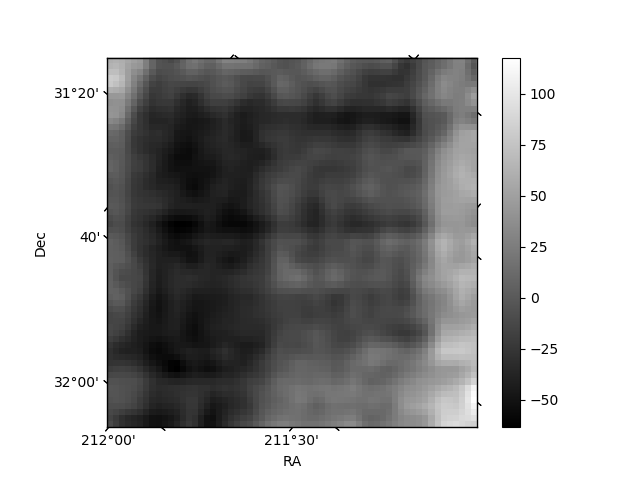
Histogram calculated using DETX and DETY for each event in the final _common_clean file
| Quadrant A |  |
 |
Quadrant B |
|---|---|---|---|
| Quadrant D | 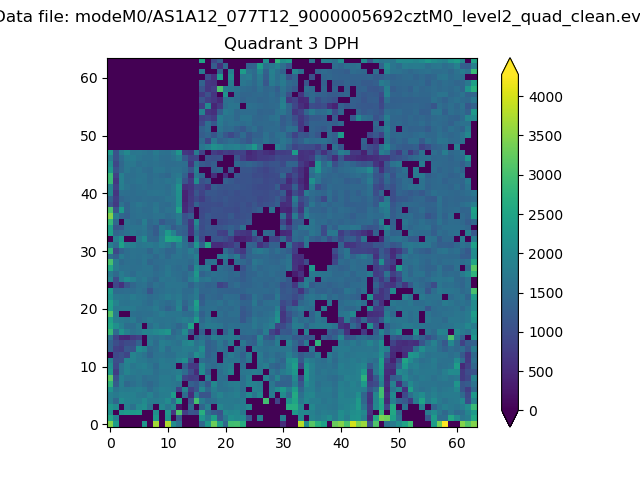 |
 |
Quadrant C |
| Plot type | Count rate plots | Images |
|---|---|---|
| Comparison with Poisson distribution Blue bars denote a histogram of data divided into 1 sec bins. Red curve is a Poisson curve with rate = median count rate of data. |
 |
 |
| Quadrant-wise count rates Data is divided into 100 sec bins |
 |
|
| Module-wise count rates for Quadrant A Data is divided into 100 sec bins |
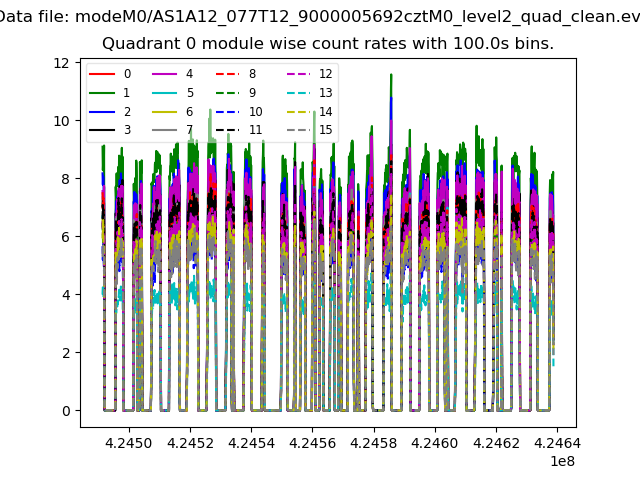 |
 |
| Module-wise count rates for Quadrant B Data is divided into 100 sec bins |
 |
 |
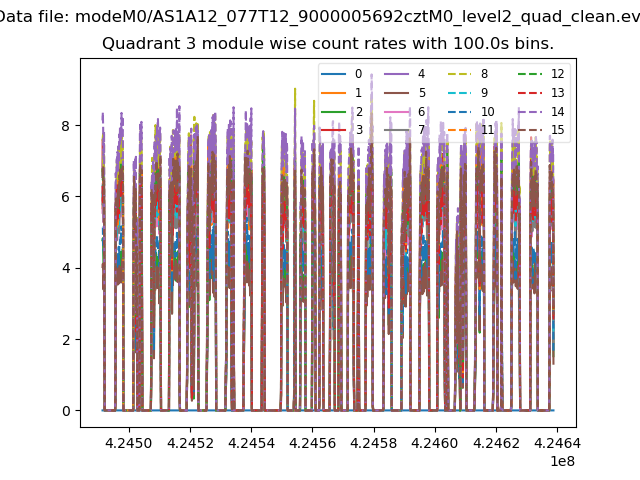
| Module-wise count rates for Quadrant C Data is divided into 100 sec bins |
 |
 |
| Module-wise count rates for Quadrant D Data is divided into 100 sec bins |
 |
 |
| Parameter | Plot |
|---|---|
| CZT HV Monitor |  |
| D_VDD |  |
| Temperature 1 |  |
| Veto HV Monitor |  |
| Veto LLD |  |
| Alpha Counter |  |
| _CPM_Rate |  |
| CZT Counter |  |
| +2.5 Volts monitor | 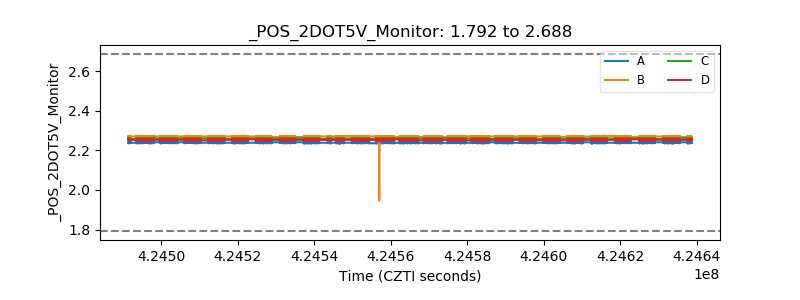 |
| +5 Volts monitor |  |
| _ROLL_ROT | 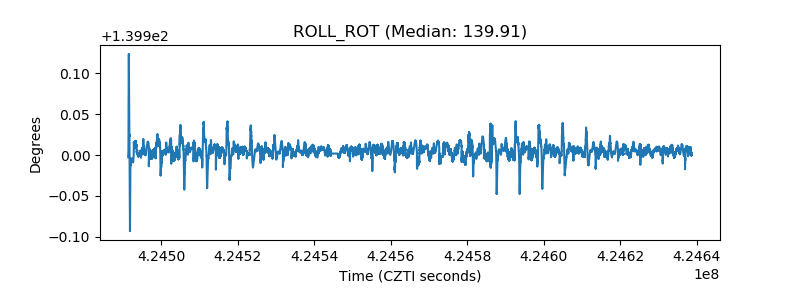 |
| _Roll_DEC |  |
| _Roll_RA |  |
| Veto Counter |  |