| Param | Original file | Final file |
|---|---|---|
| Filename | modeM0/AS1A12_070T01_9000005694cztM0_level2.fits | modeM0/AS1A12_070T01_9000005694cztM0_level2_quad_clean.evt |
| Size (bytes) | 261,535,680 | 378,181,440 |
| Size | 249.4 MB | 360.7 MB |
| Events in quadrant A | 1,558,806 | 2,484,566 |
| Events in quadrant B | 1,455,182 | 2,398,646 |
| Events in quadrant C | 1,502,186 | 2,349,302 |
| Events in quadrant D | 1,292,220 | 2,110,887 |
| Mode SS | |||
|---|---|---|---|
| Quadrant | BADHDUFLAG | Total packets | Discarded packets |
| A | 0 | 624 | 0 |
| B | 0 | 624 | 0 |
| C | 0 | 624 | 0 |
| D | 0 | 624 | 0 |
| Mode M9 | |||
|---|---|---|---|
| Quadrant | BADHDUFLAG | Total packets | Discarded packets |
| A | 0 | 86 | 0 |
| B | 0 | 86 | 0 |
| C | 0 | 86 | 0 |
| D | 0 | 86 | 0 |
| Mode M0 | |||
|---|---|---|---|
| Quadrant | BADHDUFLAG | Total packets | Discarded packets |
| A | 0 | 66763 | 0 |
| B | 0 | 68715 | 0 |
| C | 0 | 67770 | 0 |
| D | 0 | 79845 | 0 |
| Quadrant | Total seconds | Saturated seconds | Saturation percentage |
|---|---|---|---|
| A | 30723 | 85 | 0.276666% |
| B | 30723 | 1100 | 3.580380% |
| C | 30723 | 657 | 2.138463% |
| D | 30723 | 1535 | 4.996257% |
Noise dominated data is calculated using 1-second bins in cleaned event files. If a bin has >2000 counts, and if more than 50% of those come from <1% of pixels, then it is considered to be noise-dominated and hence unusable.
| Quadrant | # 1 sec bins | Bins with >0 counts | Bins with >2000 counts | High rate bins dominated by noise | Noise dominated (total time) | Noise dominated (detector-on time) | Marked lightcurve |
|---|---|---|---|---|---|---|---|
| A | 39227 | 30717 | 0 | 0 | 0.00% | 0.00% | 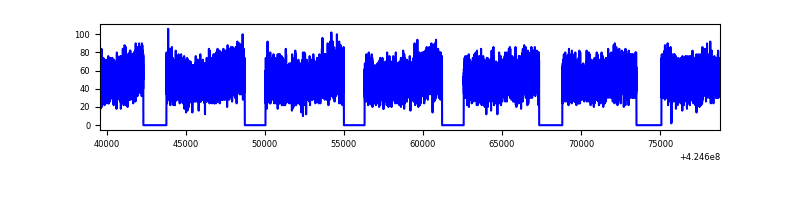 |
| B | 39227 | 30486 | 0 | 0 | 0.00% | 0.00% |  |
| C | 39227 | 30646 | 0 | 0 | 0.00% | 0.00% |  |
| D | 39227 | 30704 | 0 | 0 | 0.00% | 0.00% |  |
Top three noisy pixels from each quadrant. If the there are fewer than three noisy pixels in the level2.evt file, extra rows are filled as -1
| Pixel properties | Quadrant properties | ||||||
|---|---|---|---|---|---|---|---|
| Quadrant | DetID | PixID | Counts | Sigma | Mean | Median | Sigma |
| A | 9 | 19 | 1283 | 8.57 | 407 | 381 | 105.2 |
| A | 7 | 110 | 1275 | 8.5 | 407 | 381 | 105.2 |
| A | 0 | 29 | 1165 | 7.45 | 407 | 381 | 105.2 |
| B | 2 | 9 | 1219 | 11.07 | 385 | 368 | 76.9 |
| B | 3 | 80 | 1044 | 8.79 | 385 | 368 | 76.9 |
| B | 3 | 17 | 1024 | 8.53 | 385 | 368 | 76.9 |
| C | 1 | 81 | 1322 | 9.27 | 396 | 371 | 102.6 |
| C | 1 | 80 | 1285 | 8.91 | 396 | 371 | 102.6 |
| C | 3 | 202 | 1195 | 8.03 | 396 | 371 | 102.6 |
| D | 7 | 3 | 1007 | 6.68 | 370 | 338 | 100.2 |
| D | 6 | 62 | 971 | 6.32 | 370 | 338 | 100.2 |
| D | 4 | 160 | 969 | 6.3 | 370 | 338 | 100.2 |
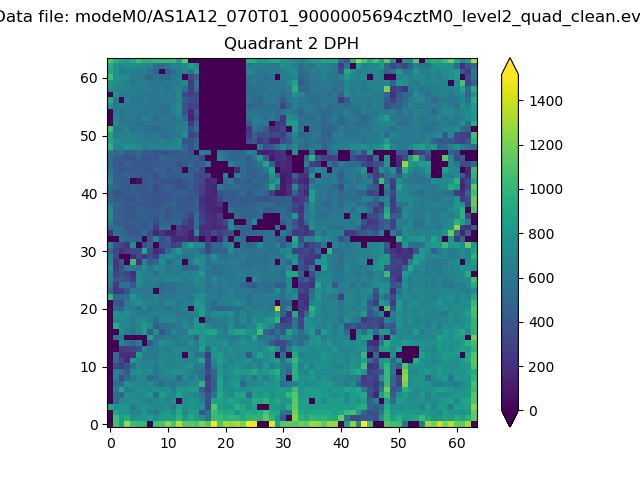
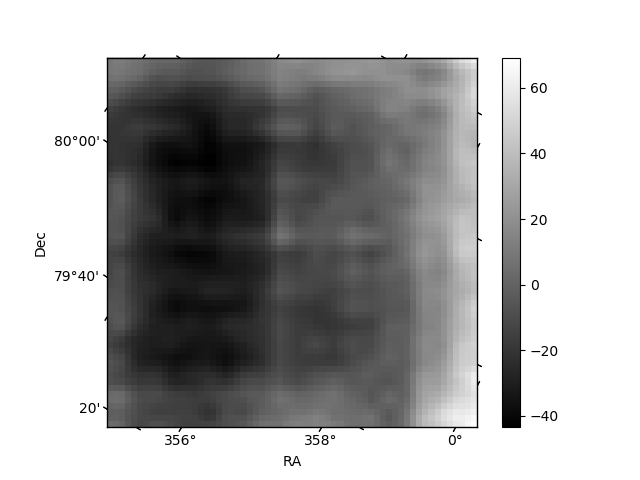
Histogram calculated using DETX and DETY for each event in the final _common_clean file
| Quadrant A |  |
 |
Quadrant B |
|---|---|---|---|
| Quadrant D | 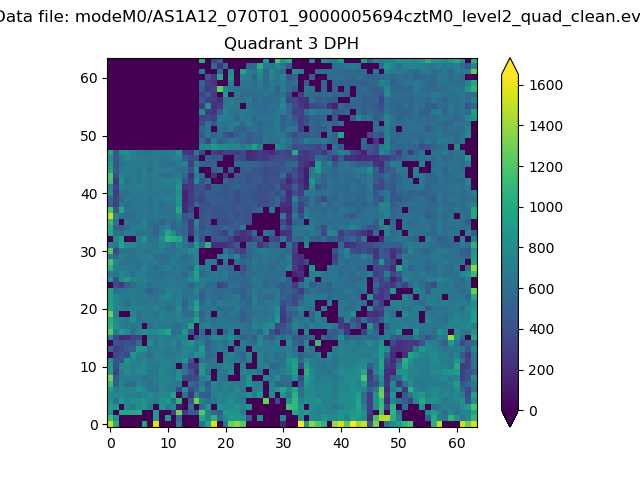 |
 |
Quadrant C |
| Plot type | Count rate plots | Images |
|---|---|---|
| Comparison with Poisson distribution Blue bars denote a histogram of data divided into 1 sec bins. Red curve is a Poisson curve with rate = median count rate of data. |
 |
 |
| Quadrant-wise count rates Data is divided into 100 sec bins |
 |
|
| Module-wise count rates for Quadrant A Data is divided into 100 sec bins |
 |
 |
| Module-wise count rates for Quadrant B Data is divided into 100 sec bins |
 |
 |
| Module-wise count rates for Quadrant C Data is divided into 100 sec bins |
 |
 |
| Module-wise count rates for Quadrant D Data is divided into 100 sec bins |
 |
 |
| Parameter | Plot |
|---|---|
| CZT HV Monitor |  |
| D_VDD |  |
| Temperature 1 |  |
| Veto HV Monitor | 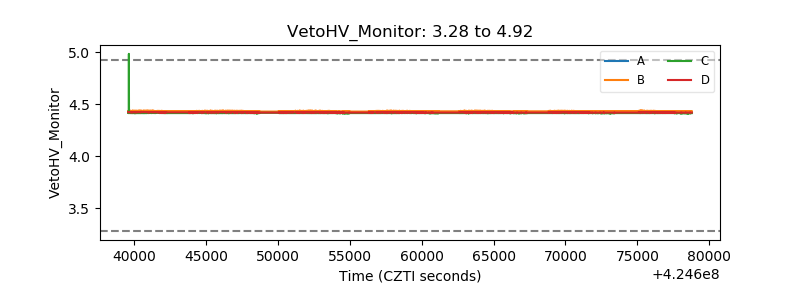 |
| Veto LLD | 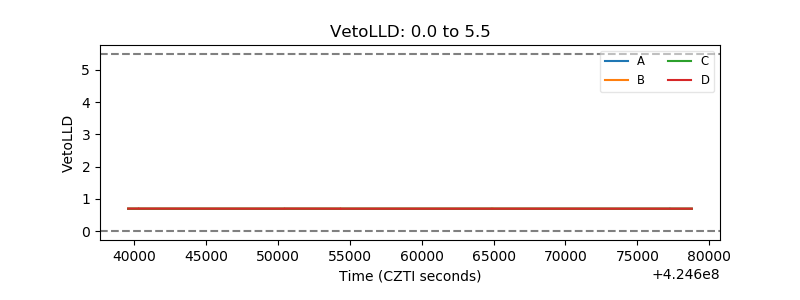 |
| Alpha Counter |  |
| _CPM_Rate |  |
| CZT Counter |  |
| +2.5 Volts monitor |  |
| +5 Volts monitor | 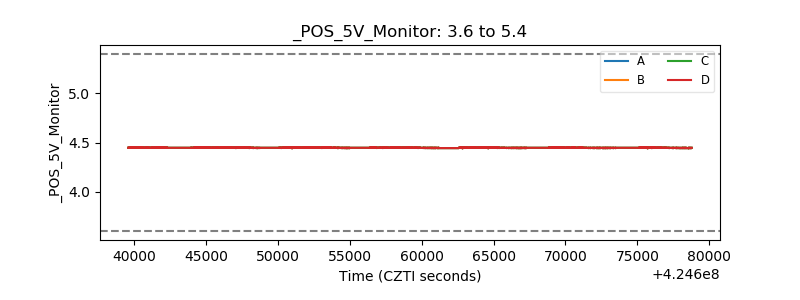 |
| _ROLL_ROT |  |
| _Roll_DEC |  |
| _Roll_RA |  |
| Veto Counter |  |