| Param | Original file | Final file |
|---|---|---|
| Filename | modeM0/AS1A12_044T19_9000005698cztM0_level2.fits | modeM0/AS1A12_044T19_9000005698cztM0_level2_quad_clean.evt |
| Size (bytes) | 643,049,280 | 700,859,520 |
| Size | 613.3 MB | 668.4 MB |
| Events in quadrant A | 3,920,034 | 4,340,481 |
| Events in quadrant B | 3,696,410 | 4,272,562 |
| Events in quadrant C | 3,711,108 | 4,068,528 |
| Events in quadrant D | 3,243,382 | 3,643,024 |
| Mode SS | |||
|---|---|---|---|
| Quadrant | BADHDUFLAG | Total packets | Discarded packets |
| A | 0 | 1462 | 0 |
| B | 0 | 1462 | 0 |
| C | 0 | 1462 | 0 |
| D | 0 | 1462 | 0 |
| Mode M0 | |||
|---|---|---|---|
| Quadrant | BADHDUFLAG | Total packets | Discarded packets |
| A | 0 | 156975 | 0 |
| B | 0 | 156534 | 0 |
| C | 0 | 161580 | 0 |
| D | 0 | 187386 | 0 |
| Mode M9 | |||
|---|---|---|---|
| Quadrant | BADHDUFLAG | Total packets | Discarded packets |
| A | 0 | 274 | 0 |
| B | 0 | 274 | 0 |
| C | 0 | 274 | 0 |
| D | 0 | 274 | 0 |
| Quadrant | Total seconds | Saturated seconds | Saturation percentage |
|---|---|---|---|
| A | 71477 | 293 | 0.409922% |
| B | 71477 | 767 | 1.073072% |
| C | 71477 | 2108 | 2.949200% |
| D | 71476 | 3280 | 4.588953% |
Noise dominated data is calculated using 1-second bins in cleaned event files. If a bin has >2000 counts, and if more than 50% of those come from <1% of pixels, then it is considered to be noise-dominated and hence unusable.
| Quadrant | # 1 sec bins | Bins with >0 counts | Bins with >2000 counts | High rate bins dominated by noise | Noise dominated (total time) | Noise dominated (detector-on time) | Marked lightcurve |
|---|---|---|---|---|---|---|---|
| A | 97468 | 71467 | 0 | 0 | 0.00% | 0.00% |  |
| B | 97468 | 71441 | 0 | 0 | 0.00% | 0.00% | 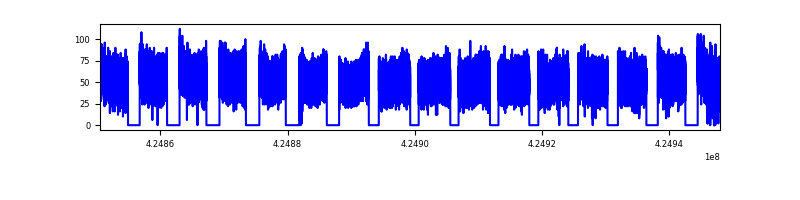 |
| C | 97466 | 71140 | 0 | 0 | 0.00% | 0.00% |  |
| D | 97468 | 71275 | 0 | 0 | 0.00% | 0.00% | 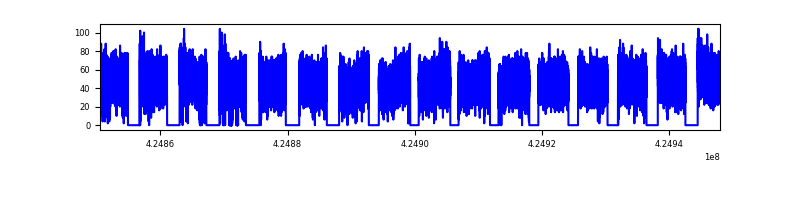 |
Top three noisy pixels from each quadrant. If the there are fewer than three noisy pixels in the level2.evt file, extra rows are filled as -1
| Pixel properties | Quadrant properties | ||||||
|---|---|---|---|---|---|---|---|
| Quadrant | DetID | PixID | Counts | Sigma | Mean | Median | Sigma |
| A | 0 | 29 | 3206 | 8.79 | 1022 | 956 | 256.0 |
| A | 9 | 19 | 3193 | 8.74 | 1022 | 956 | 256.0 |
| A | 7 | 110 | 3158 | 8.6 | 1022 | 956 | 256.0 |
| B | 2 | 9 | 3147 | 11.49 | 979 | 932 | 192.8 |
| B | 3 | 80 | 2818 | 9.78 | 979 | 932 | 192.8 |
| B | 3 | 17 | 2637 | 8.84 | 979 | 932 | 192.8 |
| C | 1 | 81 | 3010 | 8.33 | 980 | 914 | 251.5 |
| C | 3 | 202 | 2909 | 7.93 | 980 | 914 | 251.5 |
| C | 1 | 80 | 2906 | 7.92 | 980 | 914 | 251.5 |
| D | 7 | 3 | 2509 | 6.7 | 930 | 848 | 247.9 |
| D | 4 | 160 | 2367 | 6.13 | 930 | 848 | 247.9 |
| D | 10 | 189 | 2334 | 6.0 | 930 | 848 | 247.9 |
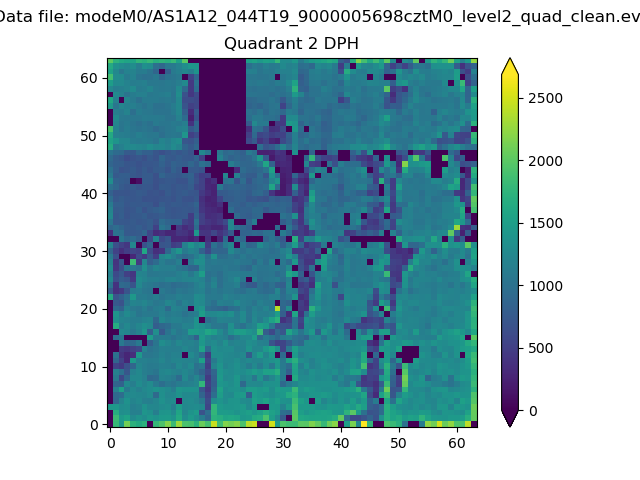
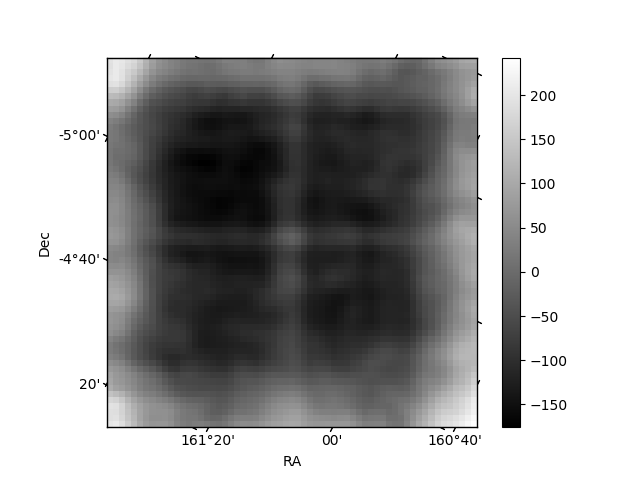
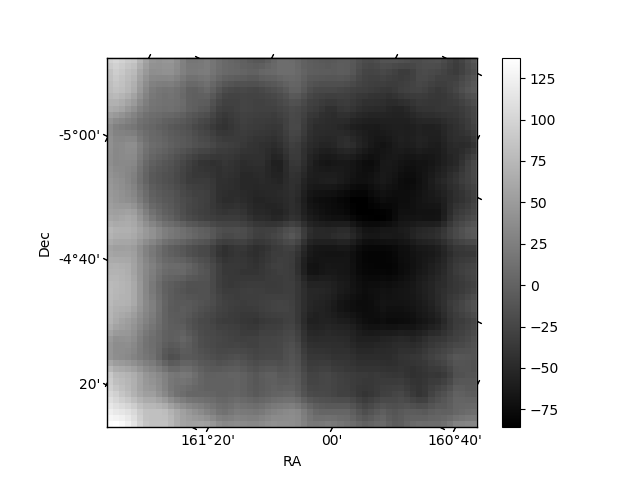
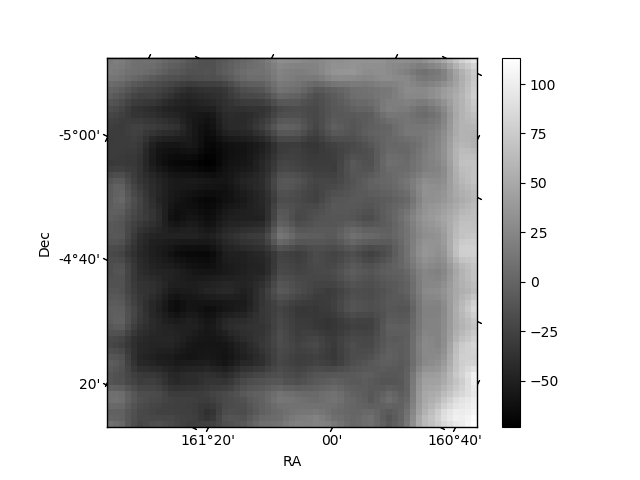
Histogram calculated using DETX and DETY for each event in the final _common_clean file
| Quadrant A |  |
 |
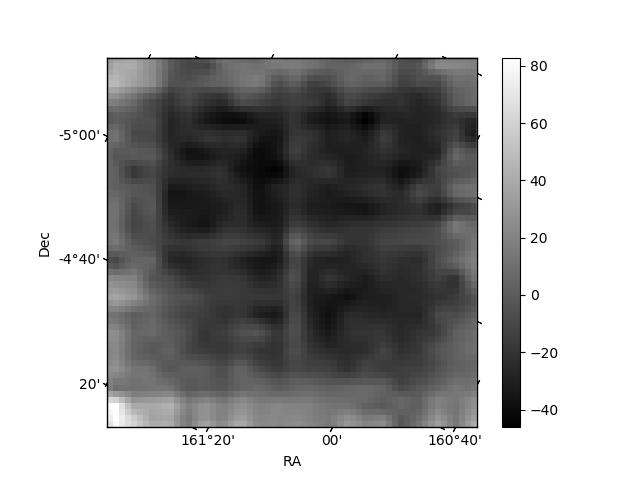
Quadrant B |
|---|---|---|---|
| Quadrant D | 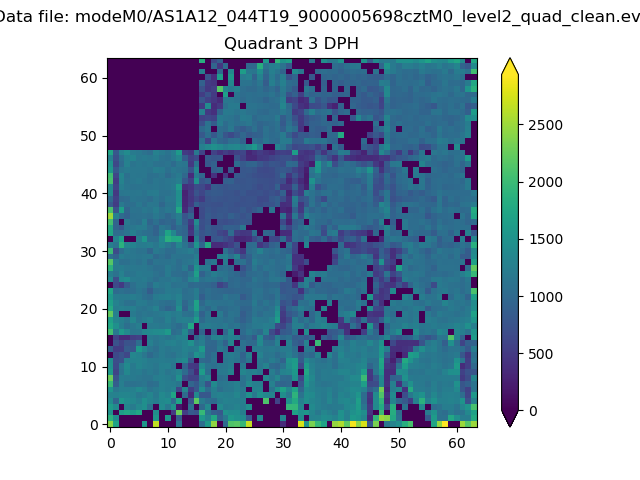 |
 |
Quadrant C |
| Plot type | Count rate plots | Images |
|---|---|---|
| Comparison with Poisson distribution Blue bars denote a histogram of data divided into 1 sec bins. Red curve is a Poisson curve with rate = median count rate of data. |
 |
 |
| Quadrant-wise count rates Data is divided into 100 sec bins |
 |
|
| Module-wise count rates for Quadrant A Data is divided into 100 sec bins |
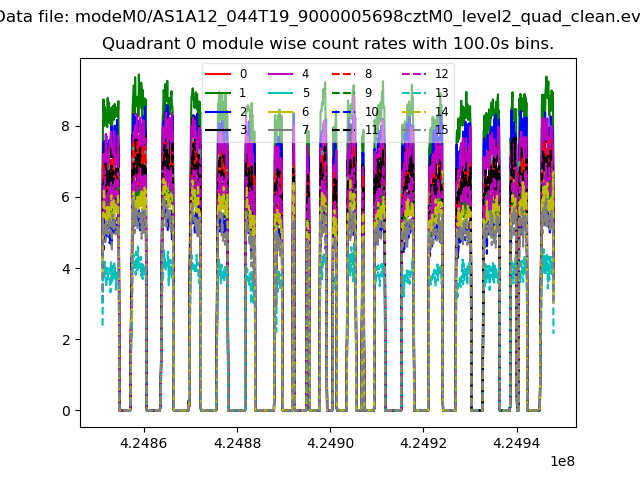 |
 |
| Module-wise count rates for Quadrant B Data is divided into 100 sec bins |
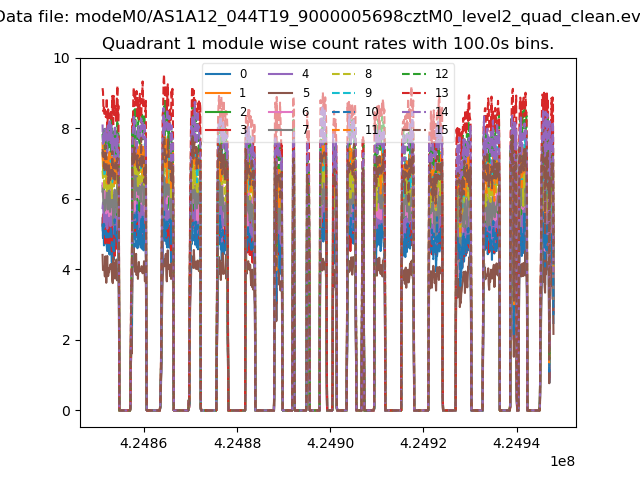 |
 |
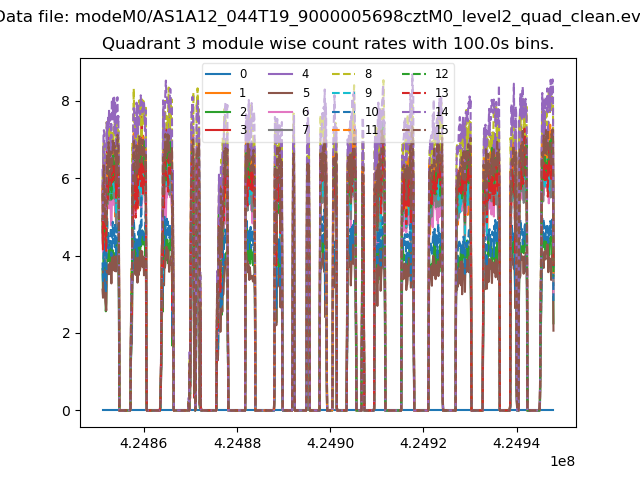
| Module-wise count rates for Quadrant C Data is divided into 100 sec bins |
 |
 |
| Module-wise count rates for Quadrant D Data is divided into 100 sec bins |
 |
 |
| Parameter | Plot |
|---|---|
| CZT HV Monitor | 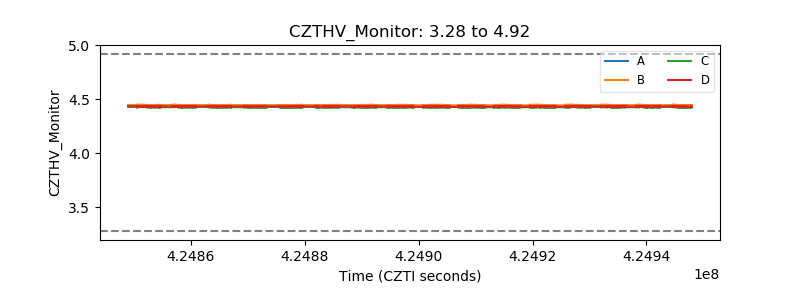 |
| D_VDD | 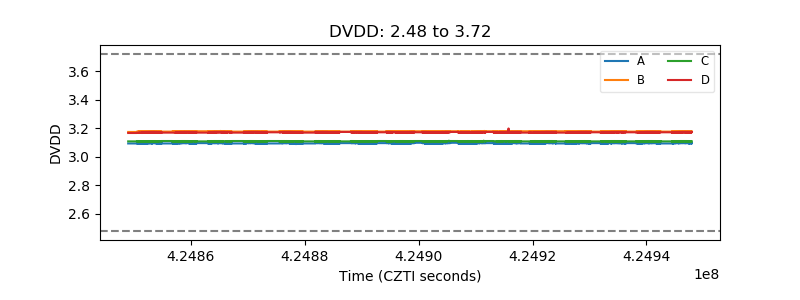 |
| Temperature 1 | 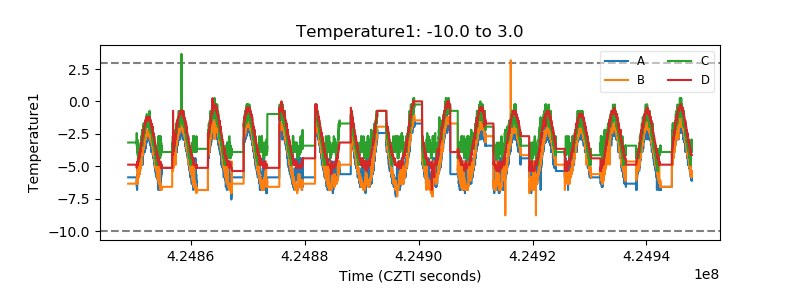 |
| Veto HV Monitor |  |
| Veto LLD |  |
| Alpha Counter |  |
| _CPM_Rate |  |
| CZT Counter | 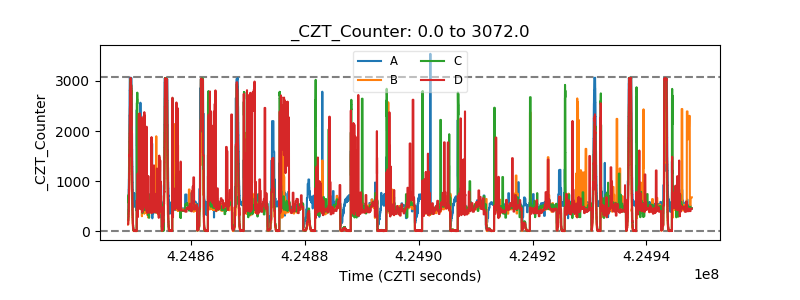 |
| +2.5 Volts monitor |  |
| +5 Volts monitor |  |
| _ROLL_ROT |  |
| _Roll_DEC |  |
| _Roll_RA | 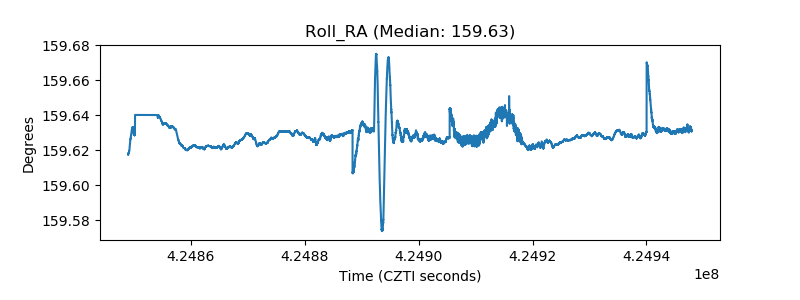 |
| Veto Counter | 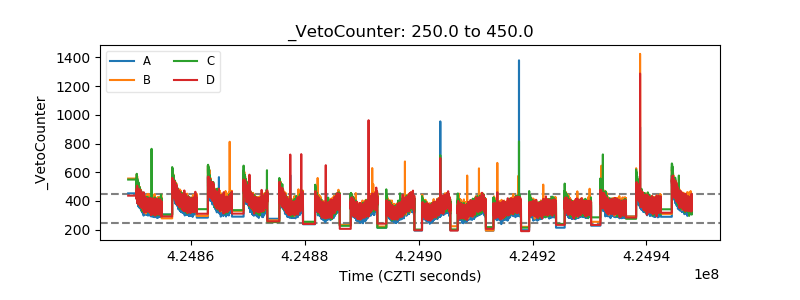 |