| Param | Original file | Final file |
|---|---|---|
| Filename | modeM0/AS1A12_052T04_9000005700cztM0_level2.fits | modeM0/AS1A12_052T04_9000005700cztM0_level2_quad_clean.evt |
| Size (bytes) | 789,600,960 | 856,877,760 |
| Size | 753.0 MB | 817.2 MB |
| Events in quadrant A | 4,796,848 | 5,269,887 |
| Events in quadrant B | 4,562,632 | 5,237,429 |
| Events in quadrant C | 4,573,672 | 4,937,888 |
| Events in quadrant D | 3,908,704 | 4,440,268 |
| Mode M9 | |||
|---|---|---|---|
| Quadrant | BADHDUFLAG | Total packets | Discarded packets |
| A | 0 | 349 | 0 |
| B | 0 | 349 | 0 |
| C | 0 | 349 | 0 |
| D | 0 | 350 | 0 |
| Mode SS | |||
|---|---|---|---|
| Quadrant | BADHDUFLAG | Total packets | Discarded packets |
| A | 0 | 1810 | 0 |
| B | 0 | 1810 | 0 |
| C | 0 | 1809 | 0 |
| D | 0 | 1810 | 0 |
| Mode M0 | |||
|---|---|---|---|
| Quadrant | BADHDUFLAG | Total packets | Discarded packets |
| A | 0 | 198964 | 0 |
| B | 0 | 189182 | 0 |
| C | 0 | 197767 | 0 |
| D | 0 | 277930 | 0 |
| Quadrant | Total seconds | Saturated seconds | Saturation percentage |
|---|---|---|---|
| A | 88468 | 473 | 0.534657% |
| B | 88506 | 572 | 0.646284% |
| C | 88506 | 2584 | 2.919576% |
| D | 88484 | 8980 | 10.148727% |
Noise dominated data is calculated using 1-second bins in cleaned event files. If a bin has >2000 counts, and if more than 50% of those come from <1% of pixels, then it is considered to be noise-dominated and hence unusable.
| Quadrant | # 1 sec bins | Bins with >0 counts | Bins with >2000 counts | High rate bins dominated by noise | Noise dominated (total time) | Noise dominated (detector-on time) | Marked lightcurve |
|---|---|---|---|---|---|---|---|
| A | 126833 | 88474 | 0 | 0 | 0.00% | 0.00% | 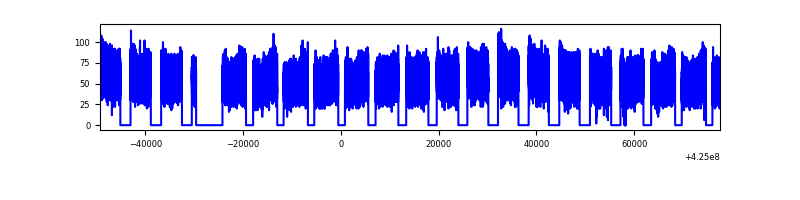 |
| B | 126834 | 88511 | 0 | 0 | 0.00% | 0.00% |  |
| C | 126833 | 87986 | 0 | 0 | 0.00% | 0.00% | 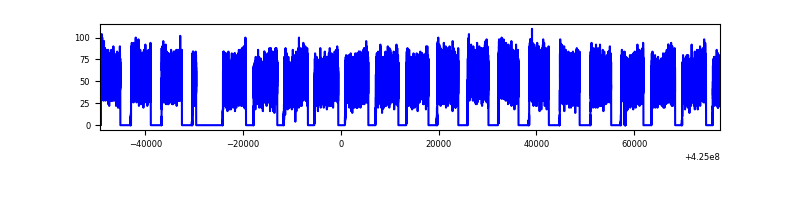 |
| D | 126833 | 88458 | 0 | 0 | 0.00% | 0.00% | 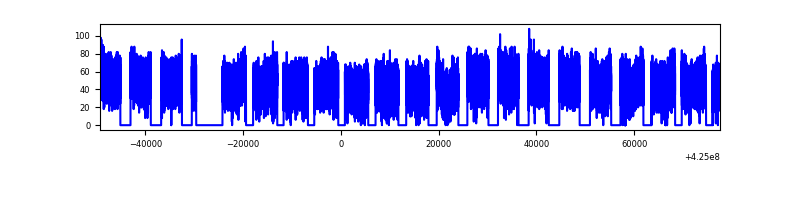 |
Top three noisy pixels from each quadrant. If the there are fewer than three noisy pixels in the level2.evt file, extra rows are filled as -1
| Pixel properties | Quadrant properties | ||||||
|---|---|---|---|---|---|---|---|
| Quadrant | DetID | PixID | Counts | Sigma | Mean | Median | Sigma |
| A | 9 | 19 | 3927 | 8.79 | 1252 | 1175 | 312.9 |
| A | 7 | 110 | 3845 | 8.53 | 1252 | 1175 | 312.9 |
| A | 0 | 29 | 3799 | 8.39 | 1252 | 1175 | 312.9 |
| B | 2 | 9 | 4071 | 12.65 | 1208 | 1153 | 230.6 |
| B | 3 | 80 | 3358 | 9.56 | 1208 | 1153 | 230.6 |
| B | 2 | 8 | 3240 | 9.05 | 1208 | 1153 | 230.6 |
| C | 1 | 81 | 3774 | 8.59 | 1208 | 1133 | 307.4 |
| C | 1 | 80 | 3630 | 8.12 | 1208 | 1133 | 307.4 |
| C | 3 | 202 | 3611 | 8.06 | 1208 | 1133 | 307.4 |
| D | 7 | 3 | 2885 | 6.23 | 1120 | 1020 | 299.3 |
| D | 4 | 160 | 2857 | 6.14 | 1120 | 1020 | 299.3 |
| D | 15 | 46 | 2838 | 6.07 | 1120 | 1020 | 299.3 |
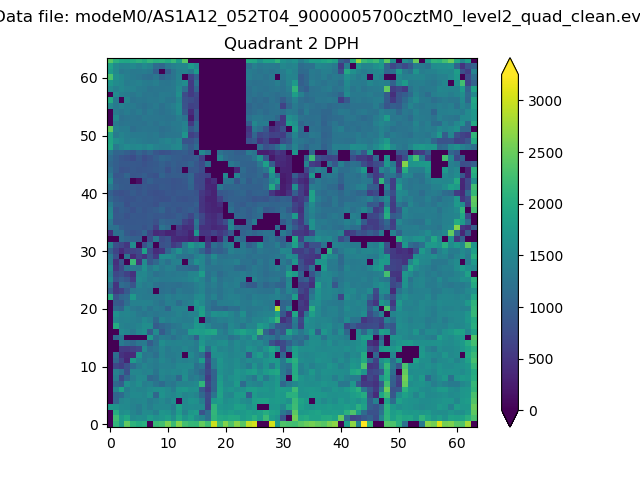
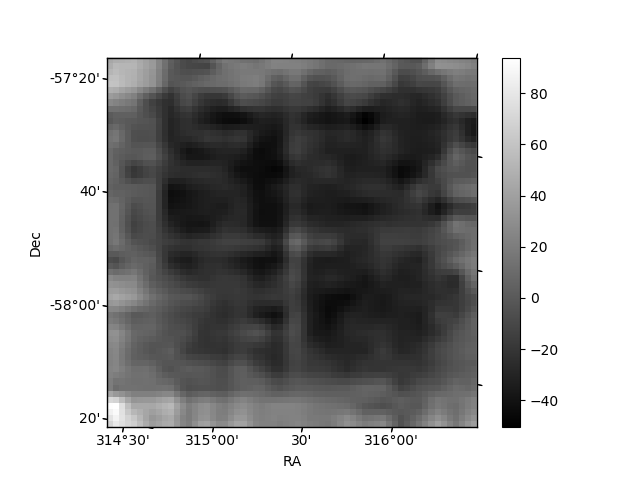
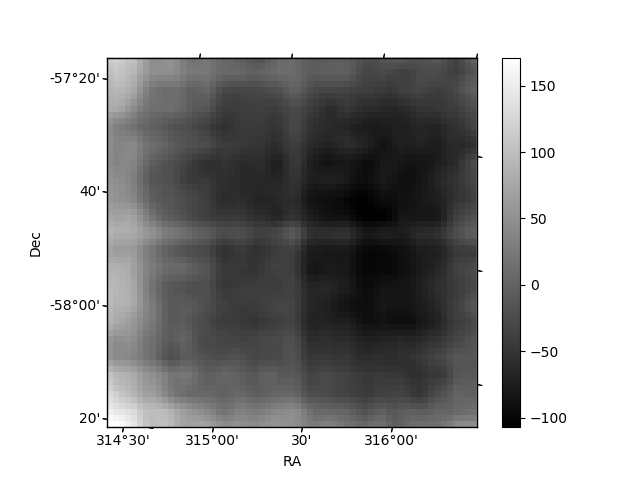
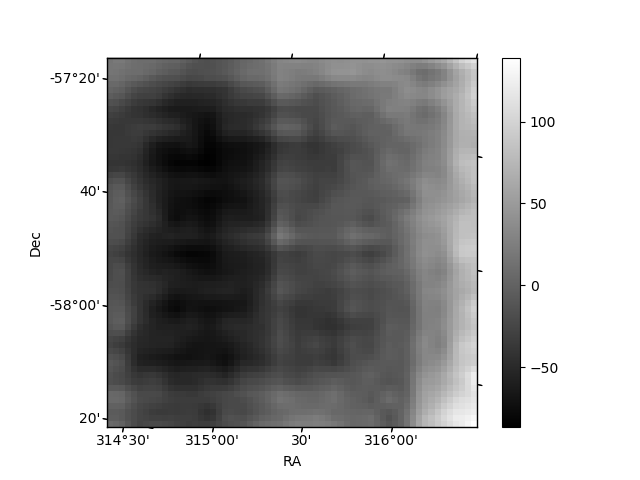
Histogram calculated using DETX and DETY for each event in the final _common_clean file
| Quadrant A |  |
 |
Quadrant B |
|---|---|---|---|
| Quadrant D |  |
 |
Quadrant C |
| Plot type | Count rate plots | Images |
|---|---|---|
| Comparison with Poisson distribution Blue bars denote a histogram of data divided into 1 sec bins. Red curve is a Poisson curve with rate = median count rate of data. |
 |
 |
| Quadrant-wise count rates Data is divided into 100 sec bins |
 |
|
| Module-wise count rates for Quadrant A Data is divided into 100 sec bins |
 |
 |
| Module-wise count rates for Quadrant B Data is divided into 100 sec bins |
 |
 |
| Module-wise count rates for Quadrant C Data is divided into 100 sec bins |
 |
 |
| Module-wise count rates for Quadrant D Data is divided into 100 sec bins |
 |
 |
| Parameter | Plot |
|---|---|
| CZT HV Monitor |  |
| D_VDD | 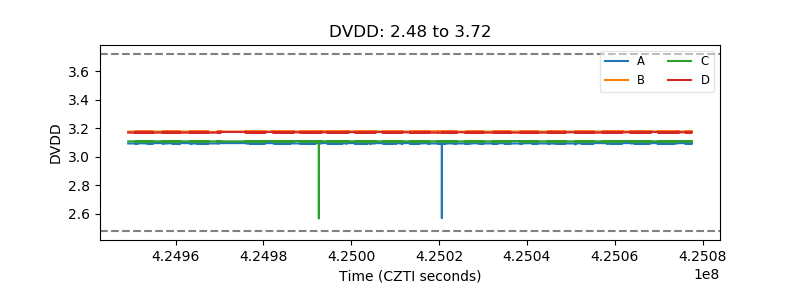 |
| Temperature 1 | 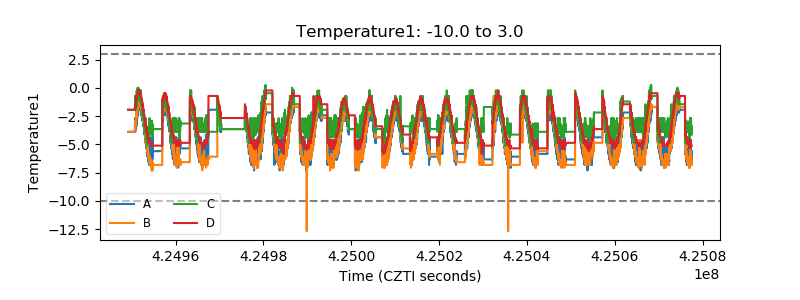 |
| Veto HV Monitor |  |
| Veto LLD |  |
| Alpha Counter | 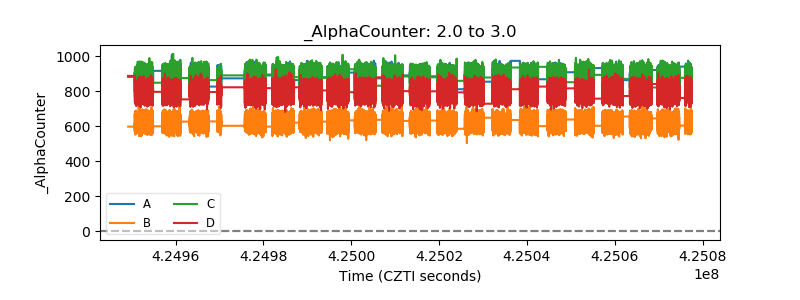 |
| _CPM_Rate |  |
| CZT Counter | 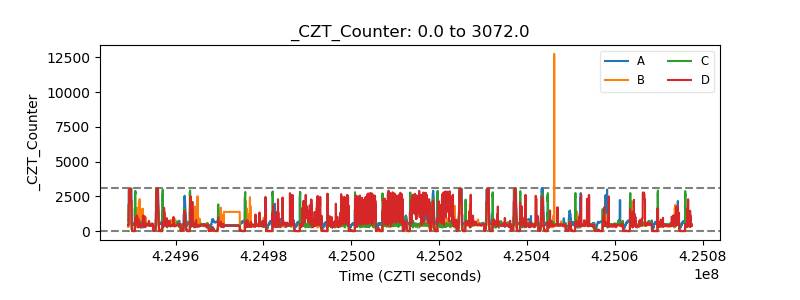 |
| +2.5 Volts monitor |  |
| +5 Volts monitor |  |
| _ROLL_ROT |  |
| _Roll_DEC |  |
| _Roll_RA | 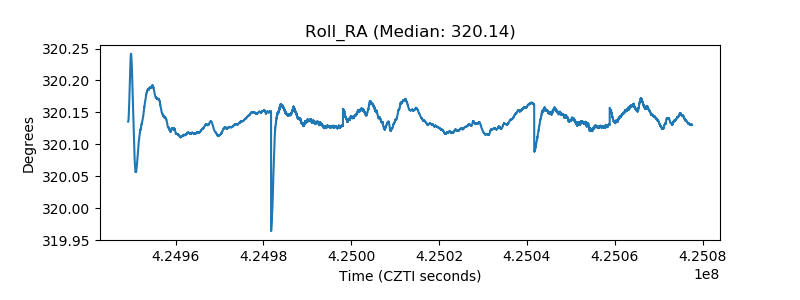 |
| Veto Counter |  |