| Param | Original file | Final file |
|---|---|---|
| Filename | modeM0/AS1A12_093T02_9000005704cztM0_level2.fits | modeM0/AS1A12_093T02_9000005704cztM0_level2_quad_clean.evt |
| Size (bytes) | 359,271,360 | 382,734,720 |
| Size | 342.6 MB | 365.0 MB |
| Events in quadrant A | 2,180,068 | 2,336,442 |
| Events in quadrant B | 2,082,716 | 2,359,450 |
| Events in quadrant C | 2,056,150 | 2,158,762 |
| Events in quadrant D | 1,838,846 | 2,014,283 |
| Mode M9 | |||
|---|---|---|---|
| Quadrant | BADHDUFLAG | Total packets | Discarded packets |
| A | 0 | 166 | 0 |
| B | 0 | 168 | 0 |
| C | 0 | 168 | 0 |
| D | 0 | 168 | 0 |
| Mode M0 | |||
|---|---|---|---|
| Quadrant | BADHDUFLAG | Total packets | Discarded packets |
| A | 0 | 94646 | 0 |
| B | 0 | 81392 | 0 |
| C | 0 | 93573 | 0 |
| D | 0 | 94539 | 0 |
| Mode SS | |||
|---|---|---|---|
| Quadrant | BADHDUFLAG | Total packets | Discarded packets |
| A | 0 | 812 | 0 |
| B | 0 | 812 | 0 |
| C | 0 | 812 | 0 |
| D | 0 | 812 | 0 |
| Quadrant | Total seconds | Saturated seconds | Saturation percentage |
|---|---|---|---|
| A | 39639 | 366 | 0.923333% |
| B | 39639 | 83 | 0.209390% |
| C | 39639 | 1424 | 3.592422% |
| D | 39639 | 999 | 2.520245% |
Noise dominated data is calculated using 1-second bins in cleaned event files. If a bin has >2000 counts, and if more than 50% of those come from <1% of pixels, then it is considered to be noise-dominated and hence unusable.
| Quadrant | # 1 sec bins | Bins with >0 counts | Bins with >2000 counts | High rate bins dominated by noise | Noise dominated (total time) | Noise dominated (detector-on time) | Marked lightcurve |
|---|---|---|---|---|---|---|---|
| A | 68251 | 39633 | 0 | 0 | 0.00% | 0.00% |  |
| B | 68251 | 39634 | 0 | 0 | 0.00% | 0.00% |  |
| C | 68251 | 39373 | 0 | 0 | 0.00% | 0.00% | 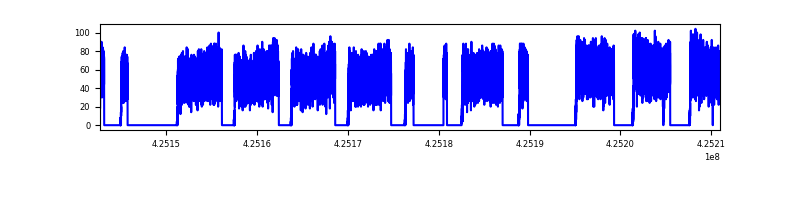 |
| D | 68251 | 39583 | 0 | 0 | 0.00% | 0.00% |  |
Top three noisy pixels from each quadrant. If the there are fewer than three noisy pixels in the level2.evt file, extra rows are filled as -1
| Pixel properties | Quadrant properties | ||||||
|---|---|---|---|---|---|---|---|
| Quadrant | DetID | PixID | Counts | Sigma | Mean | Median | Sigma |
| A | 0 | 29 | 1783 | 8.79 | 568 | 533 | 142.2 |
| A | 7 | 110 | 1783 | 8.79 | 568 | 533 | 142.2 |
| A | 9 | 19 | 1687 | 8.11 | 568 | 533 | 142.2 |
| B | 2 | 9 | 1784 | 11.62 | 552 | 526 | 108.3 |
| B | 3 | 80 | 1496 | 8.96 | 552 | 526 | 108.3 |
| B | 3 | 17 | 1480 | 8.81 | 552 | 526 | 108.3 |
| C | 1 | 81 | 1662 | 8.25 | 542 | 507 | 140.0 |
| C | 1 | 80 | 1596 | 7.78 | 542 | 507 | 140.0 |
| C | 3 | 203 | 1562 | 7.53 | 542 | 507 | 140.0 |
| D | 7 | 3 | 1407 | 6.56 | 526 | 478 | 141.5 |
| D | 10 | 189 | 1316 | 5.92 | 526 | 478 | 141.5 |
| D | 4 | 160 | 1309 | 5.87 | 526 | 478 | 141.5 |
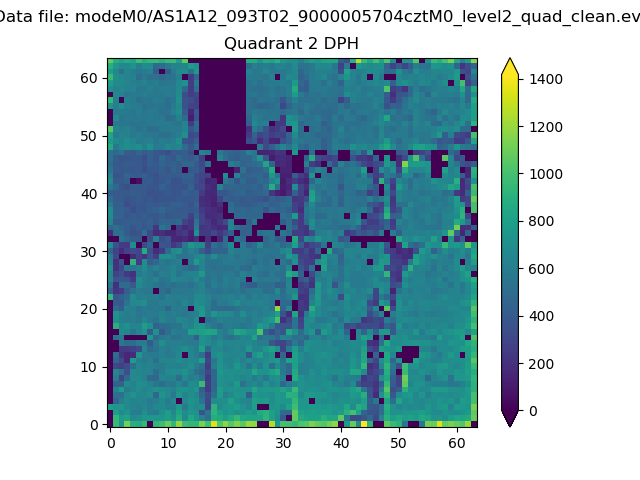
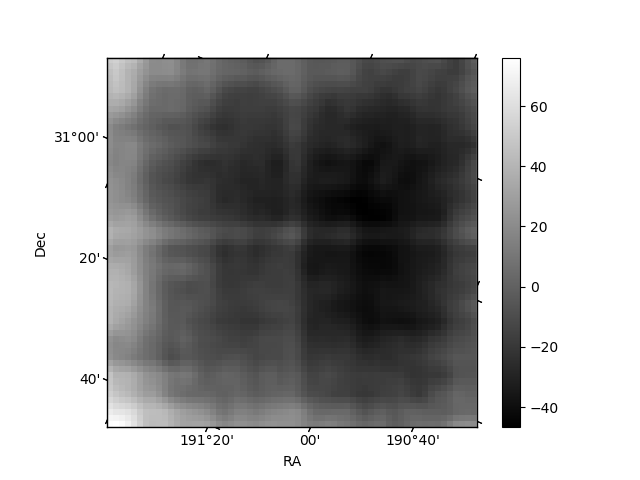
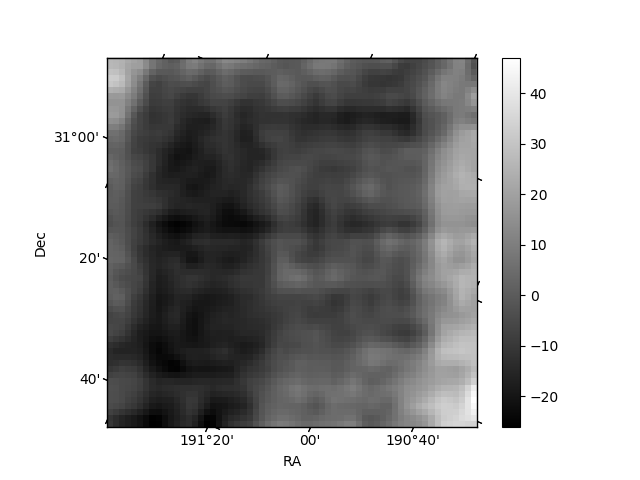
Histogram calculated using DETX and DETY for each event in the final _common_clean file
| Quadrant A |  |
 |
Quadrant B |
|---|---|---|---|
| Quadrant D | 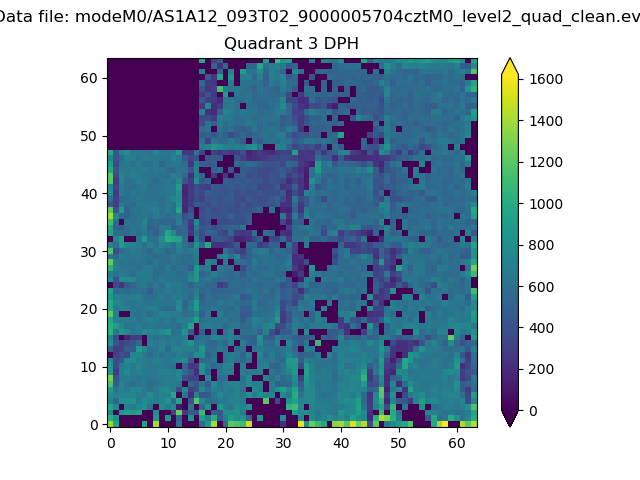 |
 |
Quadrant C |
| Plot type | Count rate plots | Images |
|---|---|---|
| Comparison with Poisson distribution Blue bars denote a histogram of data divided into 1 sec bins. Red curve is a Poisson curve with rate = median count rate of data. |
 |
 |
| Quadrant-wise count rates Data is divided into 100 sec bins |
 |
|
| Module-wise count rates for Quadrant A Data is divided into 100 sec bins |
 |
 |
| Module-wise count rates for Quadrant B Data is divided into 100 sec bins |
 |
 |
| Module-wise count rates for Quadrant C Data is divided into 100 sec bins |
 |
 |
| Module-wise count rates for Quadrant D Data is divided into 100 sec bins |
 |
 |
| Parameter | Plot |
|---|---|
| CZT HV Monitor |  |
| D_VDD |  |
| Temperature 1 |  |
| Veto HV Monitor |  |
| Veto LLD |  |
| Alpha Counter |  |
| _CPM_Rate | 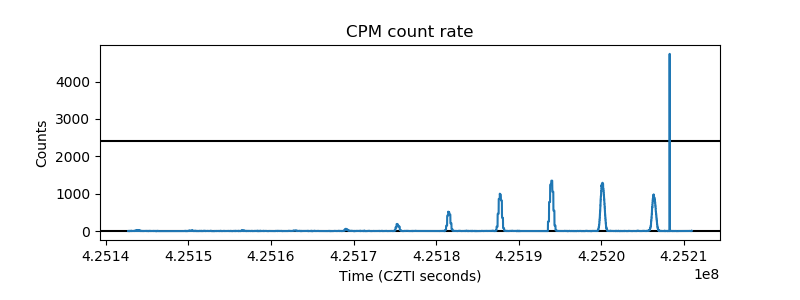 |
| CZT Counter |  |
| +2.5 Volts monitor |  |
| +5 Volts monitor | 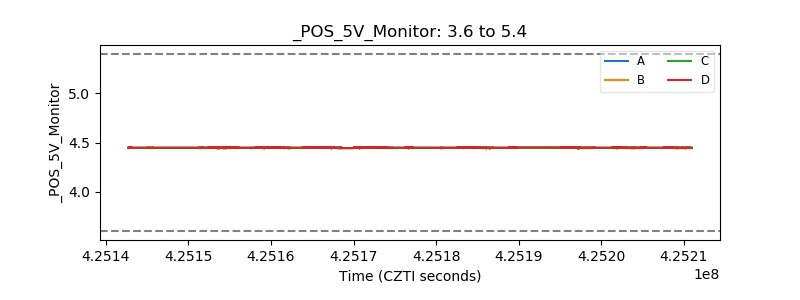 |
| _ROLL_ROT |  |
| _Roll_DEC |  |
| _Roll_RA | 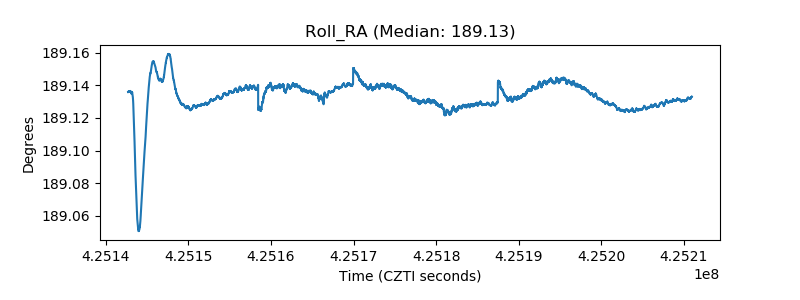 |
| Veto Counter |  |