| Param | Original file | Final file |
|---|---|---|
| Filename | modeM0/AS1A12_099T04_9000005708cztM0_level2.fits | modeM0/AS1A12_099T04_9000005708cztM0_level2_quad_clean.evt |
| Size (bytes) | 795,245,760 | 985,775,040 |
| Size | 758.4 MB | 940.1 MB |
| Events in quadrant A | 4,591,934 | 5,944,477 |
| Events in quadrant B | 4,673,254 | 6,403,268 |
| Events in quadrant C | 4,652,612 | 6,001,241 |
| Events in quadrant D | 4,004,444 | 5,353,110 |
| Mode M0 | |||
|---|---|---|---|
| Quadrant | BADHDUFLAG | Total packets | Discarded packets |
| A | 0 | 278847 | 0 |
| B | 0 | 185435 | 0 |
| C | 0 | 204576 | 0 |
| D | 0 | 256198 | 0 |
| Mode SS | |||
|---|---|---|---|
| Quadrant | BADHDUFLAG | Total packets | Discarded packets |
| A | 0 | 1838 | 0 |
| B | 0 | 1838 | 0 |
| C | 0 | 1838 | 0 |
| D | 0 | 1838 | 0 |
| Mode M9 | |||
|---|---|---|---|
| Quadrant | BADHDUFLAG | Total packets | Discarded packets |
| A | 0 | 339 | 0 |
| B | 0 | 339 | 0 |
| C | 0 | 339 | 0 |
| D | 0 | 339 | 0 |
| Quadrant | Total seconds | Saturated seconds | Saturation percentage |
|---|---|---|---|
| A | 89774 | 8420 | 9.379108% |
| B | 89774 | 379 | 0.422171% |
| C | 89774 | 2634 | 2.934034% |
| D | 89774 | 6202 | 6.908459% |
Noise dominated data is calculated using 1-second bins in cleaned event files. If a bin has >2000 counts, and if more than 50% of those come from <1% of pixels, then it is considered to be noise-dominated and hence unusable.
| Quadrant | # 1 sec bins | Bins with >0 counts | Bins with >2000 counts | High rate bins dominated by noise | Noise dominated (total time) | Noise dominated (detector-on time) | Marked lightcurve |
|---|---|---|---|---|---|---|---|
| A | 123762 | 89193 | 0 | 0 | 0.00% | 0.00% | 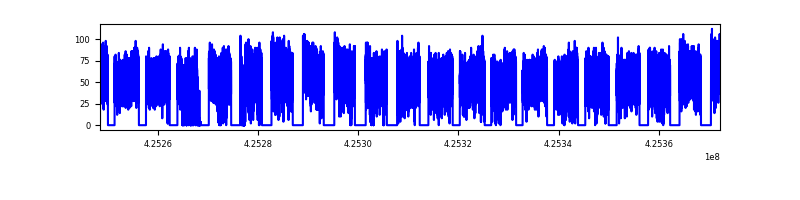 |
| B | 123762 | 89772 | 0 | 0 | 0.00% | 0.00% |  |
| C | 123762 | 89538 | 0 | 0 | 0.00% | 0.00% |  |
| D | 123762 | 89704 | 0 | 0 | 0.00% | 0.00% |  |
Top three noisy pixels from each quadrant. If the there are fewer than three noisy pixels in the level2.evt file, extra rows are filled as -1
| Pixel properties | Quadrant properties | ||||||
|---|---|---|---|---|---|---|---|
| Quadrant | DetID | PixID | Counts | Sigma | Mean | Median | Sigma |
| A | 7 | 110 | 3803 | 8.9 | 1198 | 1126 | 300.8 |
| A | 0 | 29 | 3797 | 8.88 | 1198 | 1126 | 300.8 |
| A | 9 | 19 | 3768 | 8.78 | 1198 | 1126 | 300.8 |
| B | 2 | 9 | 4083 | 12.19 | 1236 | 1183 | 237.9 |
| B | 3 | 80 | 3329 | 9.02 | 1236 | 1183 | 237.9 |
| B | 2 | 8 | 3302 | 8.91 | 1236 | 1183 | 237.9 |
| C | 1 | 81 | 3720 | 8.2 | 1229 | 1153 | 313.0 |
| C | 3 | 202 | 3664 | 8.02 | 1229 | 1153 | 313.0 |
| C | 3 | 203 | 3647 | 7.97 | 1229 | 1153 | 313.0 |
| D | 7 | 3 | 2994 | 6.36 | 1146 | 1042 | 306.7 |
| D | 4 | 160 | 2929 | 6.15 | 1146 | 1042 | 306.7 |
| D | 3 | 14 | 2906 | 6.08 | 1146 | 1042 | 306.7 |
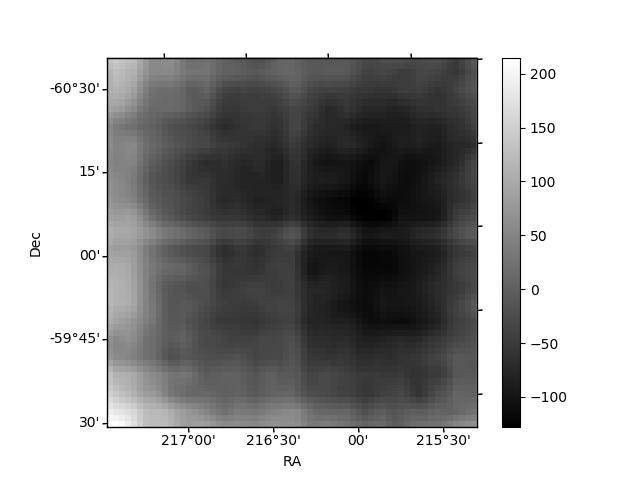
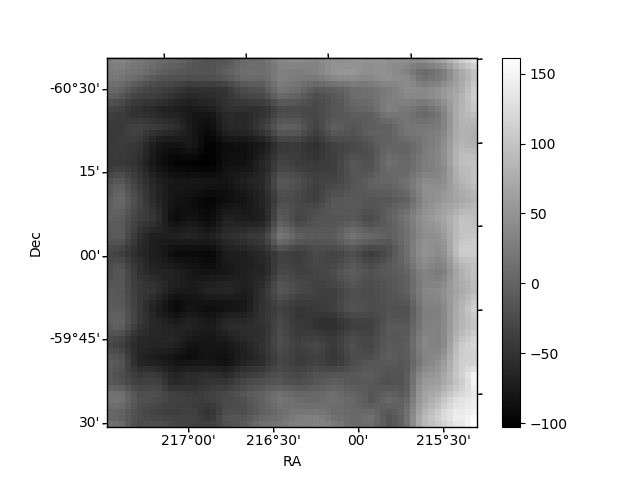
Histogram calculated using DETX and DETY for each event in the final _common_clean file
| Quadrant A | 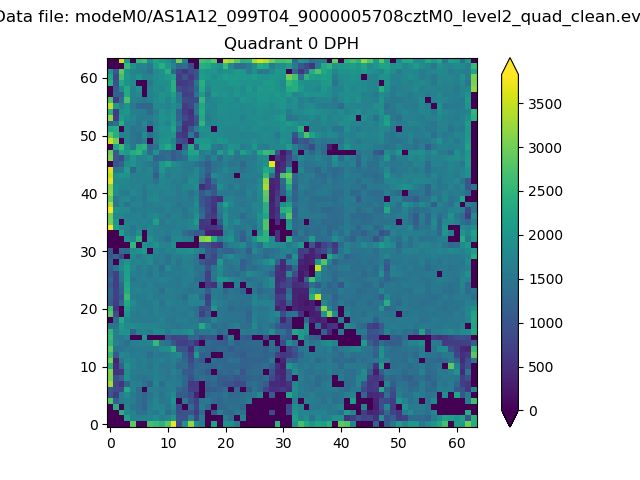 |
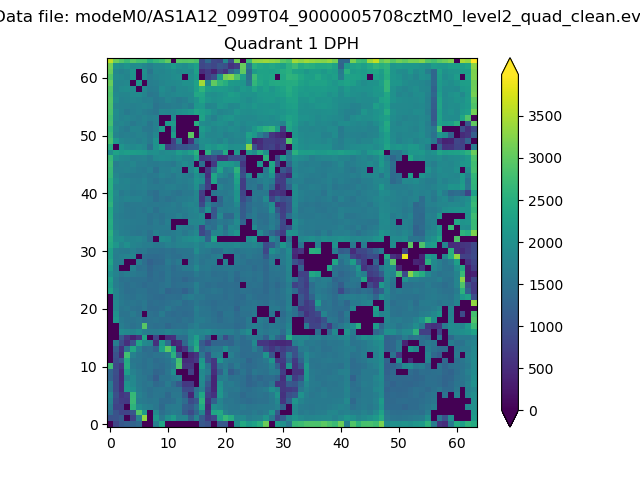 |
Quadrant B |
|---|---|---|---|
| Quadrant D |  |
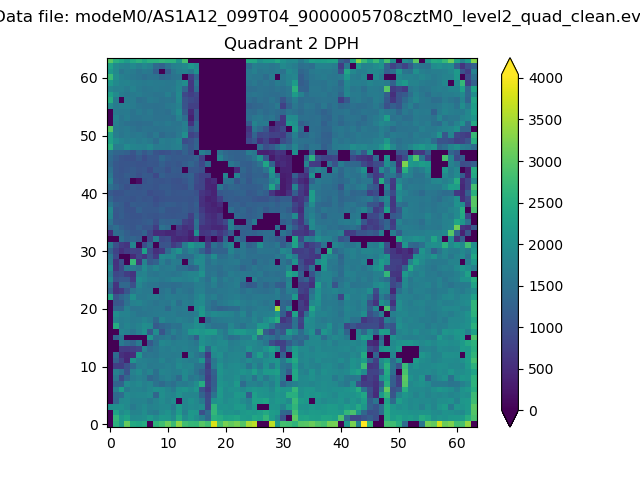 |
Quadrant C |
| Plot type | Count rate plots | Images |
|---|---|---|
| Comparison with Poisson distribution Blue bars denote a histogram of data divided into 1 sec bins. Red curve is a Poisson curve with rate = median count rate of data. |
 |
 |
| Quadrant-wise count rates Data is divided into 100 sec bins |
 |
|
| Module-wise count rates for Quadrant A Data is divided into 100 sec bins |
 |
 |
| Module-wise count rates for Quadrant B Data is divided into 100 sec bins |
 |
 |
| Module-wise count rates for Quadrant C Data is divided into 100 sec bins |
 |
 |
| Module-wise count rates for Quadrant D Data is divided into 100 sec bins |
 |
 |
| Parameter | Plot |
|---|---|
| CZT HV Monitor |  |
| D_VDD |  |
| Temperature 1 |  |
| Veto HV Monitor |  |
| Veto LLD |  |
| Alpha Counter |  |
| _CPM_Rate |  |
| CZT Counter |  |
| +2.5 Volts monitor |  |
| +5 Volts monitor |  |
| _ROLL_ROT |  |
| _Roll_DEC |  |
| _Roll_RA |  |
| Veto Counter |  |