| Param | Original file | Final file |
|---|---|---|
| Filename | modeM0/AS1A12_101T04_9000005714cztM0_level2.fits | modeM0/AS1A12_101T04_9000005714cztM0_level2_quad_clean.evt |
| Size (bytes) | 176,912,640 | 203,328,000 |
| Size | 168.7 MB | 193.9 MB |
| Events in quadrant A | 1,056,496 | 1,285,408 |
| Events in quadrant B | 1,033,060 | 1,301,396 |
| Events in quadrant C | 1,021,266 | 1,189,150 |
| Events in quadrant D | 811,598 | 948,403 |
| Mode M9 | |||
|---|---|---|---|
| Quadrant | BADHDUFLAG | Total packets | Discarded packets |
| A | 0 | 71 | 0 |
| B | 0 | 71 | 0 |
| C | 0 | 71 | 0 |
| D | 0 | 71 | 0 |
| Mode M0 | |||
|---|---|---|---|
| Quadrant | BADHDUFLAG | Total packets | Discarded packets |
| A | 0 | 55082 | 0 |
| B | 0 | 43915 | 0 |
| C | 0 | 47569 | 0 |
| D | 0 | 85958 | 0 |
| Mode SS | |||
|---|---|---|---|
| Quadrant | BADHDUFLAG | Total packets | Discarded packets |
| A | 0 | 424 | 0 |
| B | 0 | 424 | 0 |
| C | 0 | 424 | 0 |
| D | 0 | 424 | 0 |
| Quadrant | Total seconds | Saturated seconds | Saturation percentage |
|---|---|---|---|
| A | 20815 | 737 | 3.540716% |
| B | 20815 | 165 | 0.792698% |
| C | 20815 | 704 | 3.382176% |
| D | 20815 | 4113 | 19.759789% |
Noise dominated data is calculated using 1-second bins in cleaned event files. If a bin has >2000 counts, and if more than 50% of those come from <1% of pixels, then it is considered to be noise-dominated and hence unusable.
| Quadrant | # 1 sec bins | Bins with >0 counts | Bins with >2000 counts | High rate bins dominated by noise | Noise dominated (total time) | Noise dominated (detector-on time) | Marked lightcurve |
|---|---|---|---|---|---|---|---|
| A | 27798 | 20788 | 0 | 0 | 0.00% | 0.00% |  |
| B | 27798 | 20815 | 0 | 0 | 0.00% | 0.00% |  |
| C | 27798 | 20773 | 0 | 0 | 0.00% | 0.00% |  |
| D | 27798 | 20771 | 0 | 0 | 0.00% | 0.00% | 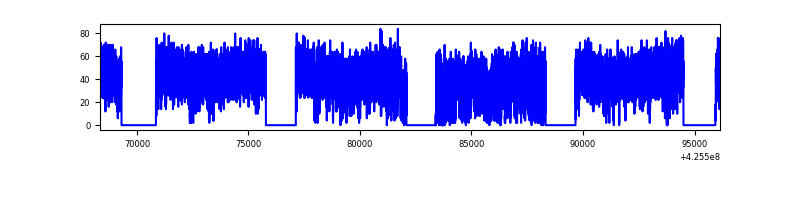 |
Top three noisy pixels from each quadrant. If the there are fewer than three noisy pixels in the level2.evt file, extra rows are filled as -1
| Pixel properties | Quadrant properties | ||||||
|---|---|---|---|---|---|---|---|
| Quadrant | DetID | PixID | Counts | Sigma | Mean | Median | Sigma |
| A | 7 | 110 | 866 | 8.56 | 275 | 256 | 71.3 |
| A | 0 | 29 | 861 | 8.49 | 275 | 256 | 71.3 |
| A | 9 | 19 | 852 | 8.36 | 275 | 256 | 71.3 |
| B | 2 | 9 | 921 | 11.75 | 272 | 258 | 56.4 |
| B | 3 | 80 | 760 | 8.89 | 272 | 258 | 56.4 |
| B | 2 | 8 | 736 | 8.47 | 272 | 258 | 56.4 |
| C | 1 | 81 | 831 | 8.1 | 269 | 251 | 71.6 |
| C | 3 | 202 | 823 | 7.99 | 269 | 251 | 71.6 |
| C | 1 | 80 | 788 | 7.5 | 269 | 251 | 71.6 |
| D | 7 | 3 | 627 | 6.53 | 231 | 210 | 63.8 |
| D | 6 | 38 | 613 | 6.31 | 231 | 210 | 63.8 |
| D | 4 | 160 | 613 | 6.31 | 231 | 210 | 63.8 |
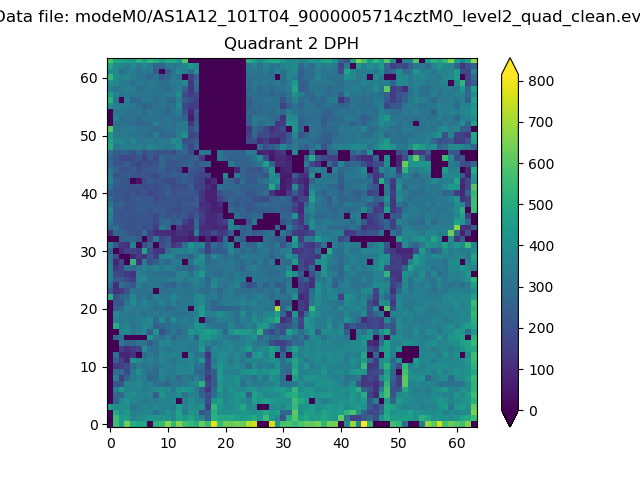
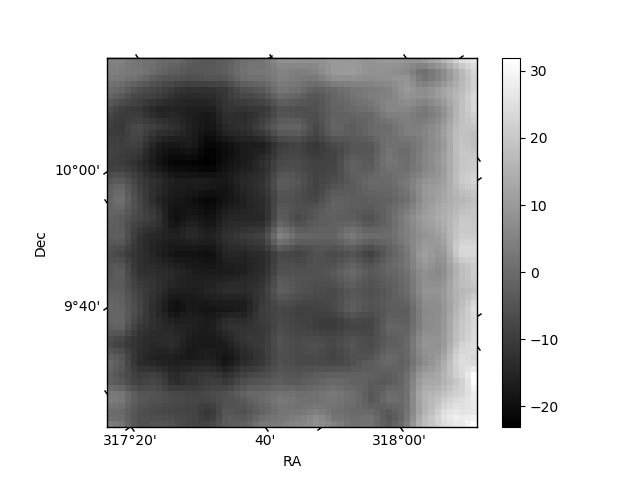
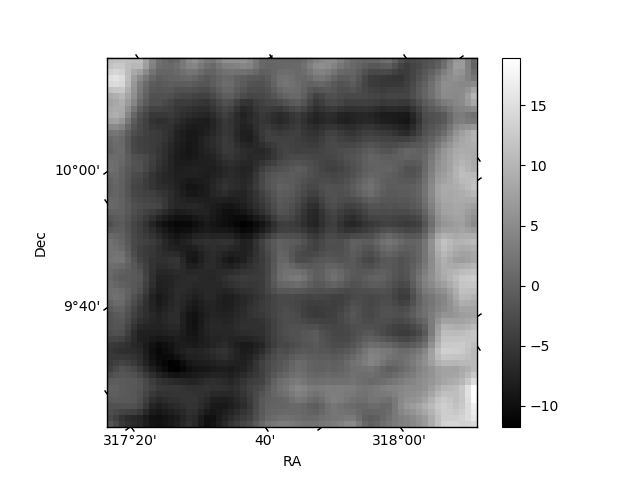
Histogram calculated using DETX and DETY for each event in the final _common_clean file
| Quadrant A | 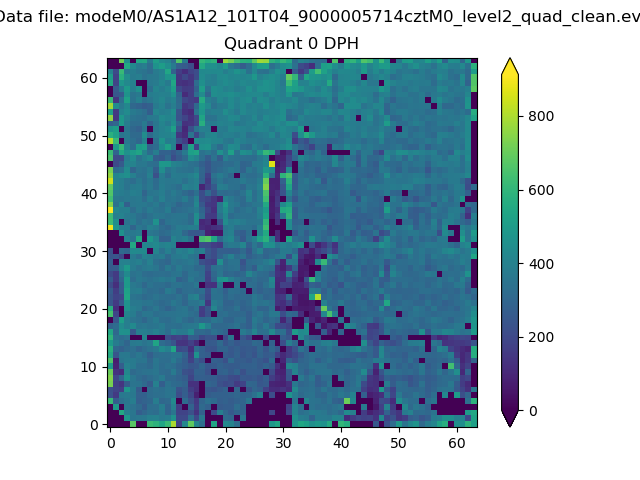 |
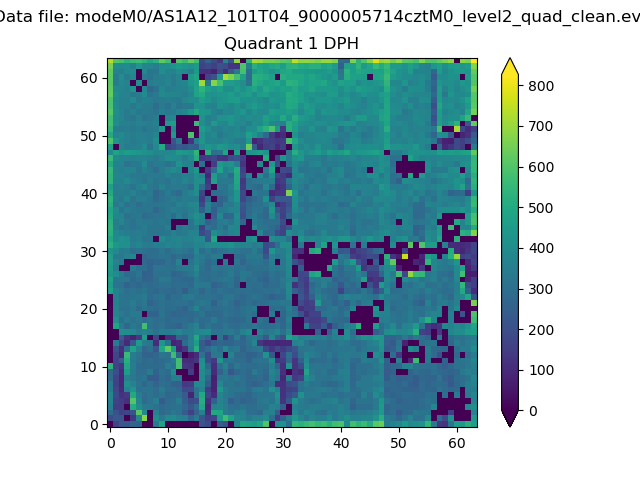 |
Quadrant B |
|---|---|---|---|
| Quadrant D | 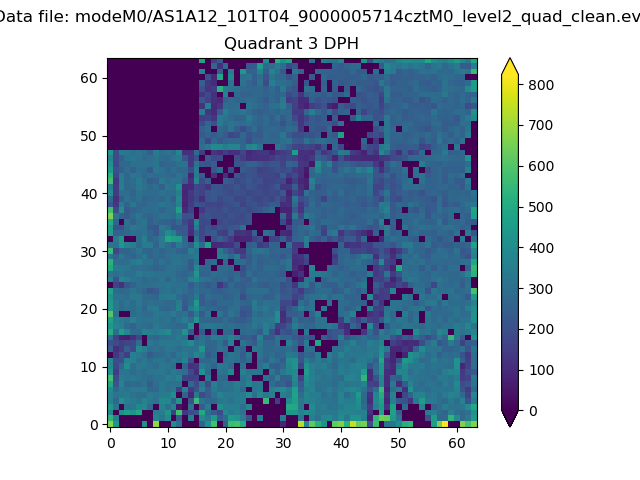 |
 |
Quadrant C |
| Plot type | Count rate plots | Images |
|---|---|---|
| Comparison with Poisson distribution Blue bars denote a histogram of data divided into 1 sec bins. Red curve is a Poisson curve with rate = median count rate of data. |
 |
 |
| Quadrant-wise count rates Data is divided into 100 sec bins |
 |
|
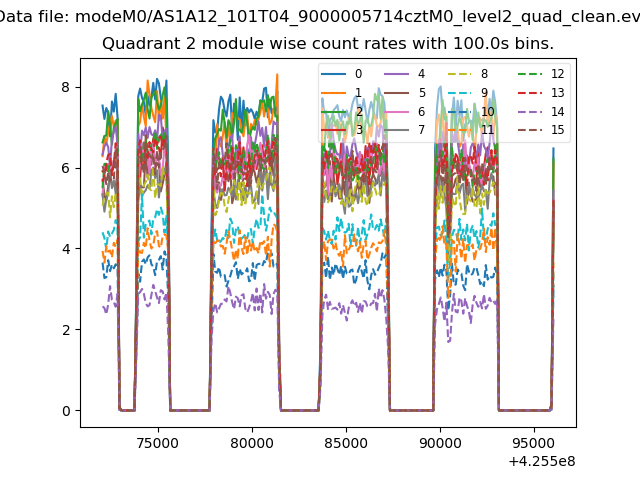
| Module-wise count rates for Quadrant A Data is divided into 100 sec bins |
 |
 |
| Module-wise count rates for Quadrant B Data is divided into 100 sec bins |
 |
 |
| Module-wise count rates for Quadrant C Data is divided into 100 sec bins |
 |
 |
| Module-wise count rates for Quadrant D Data is divided into 100 sec bins |
 |
 |
| Parameter | Plot |
|---|---|
| CZT HV Monitor |  |
| D_VDD |  |
| Temperature 1 |  |
| Veto HV Monitor | 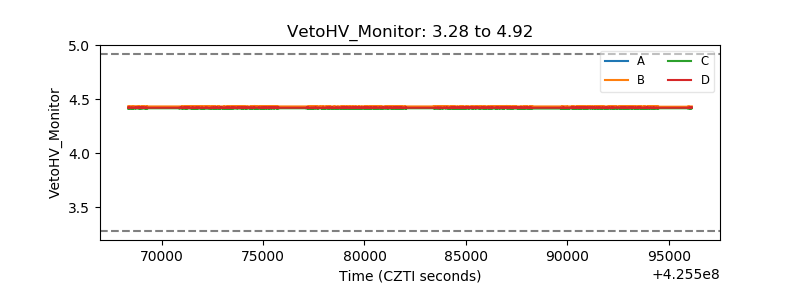 |
| Veto LLD |  |
| Alpha Counter |  |
| _CPM_Rate |  |
| CZT Counter | 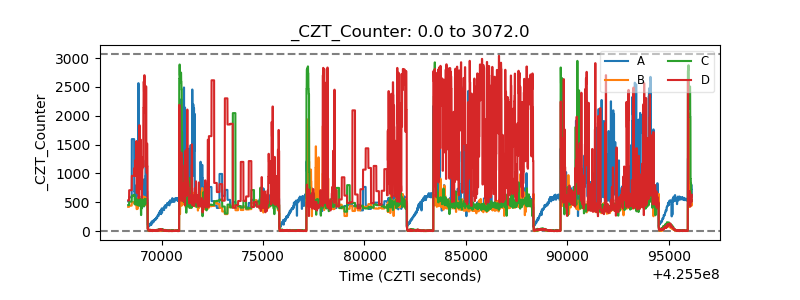 |
| +2.5 Volts monitor |  |
| +5 Volts monitor |  |
| _ROLL_ROT |  |
| _Roll_DEC |  |
| _Roll_RA |  |
| Veto Counter | 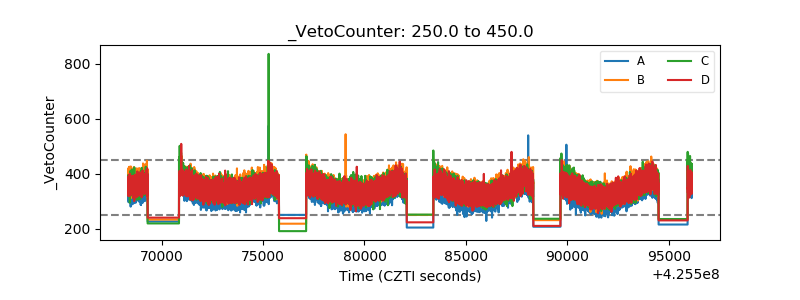 |