| Param | Original file | Final file |
|---|---|---|
| Filename | modeM0/AS1A12_025T15_9000005726cztM0_level2.fits | modeM0/AS1A12_025T15_9000005726cztM0_level2_quad_clean.evt |
| Size (bytes) | 346,633,920 | 358,470,720 |
| Size | 330.6 MB | 341.9 MB |
| Events in quadrant A | 2,105,452 | 2,173,467 |
| Events in quadrant B | 2,025,374 | 2,196,344 |
| Events in quadrant C | 2,050,990 | 2,062,612 |
| Events in quadrant D | 1,755,034 | 1,862,604 |
| Mode SS | |||
|---|---|---|---|
| Quadrant | BADHDUFLAG | Total packets | Discarded packets |
| A | 0 | 760 | 0 |
| B | 0 | 760 | 0 |
| C | 0 | 760 | 0 |
| D | 0 | 760 | 0 |
| Mode M9 | |||
|---|---|---|---|
| Quadrant | BADHDUFLAG | Total packets | Discarded packets |
| A | 0 | 151 | 0 |
| B | 0 | 151 | 0 |
| C | 0 | 151 | 0 |
| D | 0 | 151 | 0 |
| Mode M0 | |||
|---|---|---|---|
| Quadrant | BADHDUFLAG | Total packets | Discarded packets |
| A | 0 | 89229 | 0 |
| B | 0 | 79067 | 0 |
| C | 0 | 75735 | 0 |
| D | 0 | 91015 | 0 |
| Quadrant | Total seconds | Saturated seconds | Saturation percentage |
|---|---|---|---|
| A | 37301 | 105 | 0.281494% |
| B | 37301 | 118 | 0.316345% |
| C | 37301 | 38 | 0.101874% |
| D | 37301 | 1135 | 3.042814% |
Noise dominated data is calculated using 1-second bins in cleaned event files. If a bin has >2000 counts, and if more than 50% of those come from <1% of pixels, then it is considered to be noise-dominated and hence unusable.
| Quadrant | # 1 sec bins | Bins with >0 counts | Bins with >2000 counts | High rate bins dominated by noise | Noise dominated (total time) | Noise dominated (detector-on time) | Marked lightcurve |
|---|---|---|---|---|---|---|---|
| A | 52365 | 37301 | 0 | 0 | 0.00% | 0.00% |  |
| B | 52365 | 37301 | 0 | 0 | 0.00% | 0.00% |  |
| C | 52365 | 37297 | 0 | 0 | 0.00% | 0.00% |  |
| D | 52365 | 37284 | 0 | 0 | 0.00% | 0.00% |  |
Top three noisy pixels from each quadrant. If the there are fewer than three noisy pixels in the level2.evt file, extra rows are filled as -1
| Pixel properties | Quadrant properties | ||||||
|---|---|---|---|---|---|---|---|
| Quadrant | DetID | PixID | Counts | Sigma | Mean | Median | Sigma |
| A | 7 | 110 | 1707 | 8.68 | 549 | 516 | 137.2 |
| A | 9 | 19 | 1671 | 8.42 | 549 | 516 | 137.2 |
| A | 0 | 29 | 1649 | 8.26 | 549 | 516 | 137.2 |
| B | 2 | 9 | 1687 | 11.04 | 536 | 511 | 106.6 |
| B | 3 | 80 | 1455 | 8.86 | 536 | 511 | 106.6 |
| B | 5 | 128 | 1389 | 8.24 | 536 | 511 | 106.6 |
| C | 1 | 81 | 1652 | 8.16 | 541 | 506 | 140.5 |
| C | 3 | 202 | 1573 | 7.59 | 541 | 506 | 140.5 |
| C | 1 | 80 | 1553 | 7.45 | 541 | 506 | 140.5 |
| D | 10 | 189 | 1351 | 6.6 | 502 | 456 | 135.7 |
| D | 7 | 3 | 1311 | 6.3 | 502 | 456 | 135.7 |
| D | 3 | 14 | 1269 | 5.99 | 502 | 456 | 135.7 |
Histogram calculated using DETX and DETY for each event in the final _common_clean file
| Quadrant A | 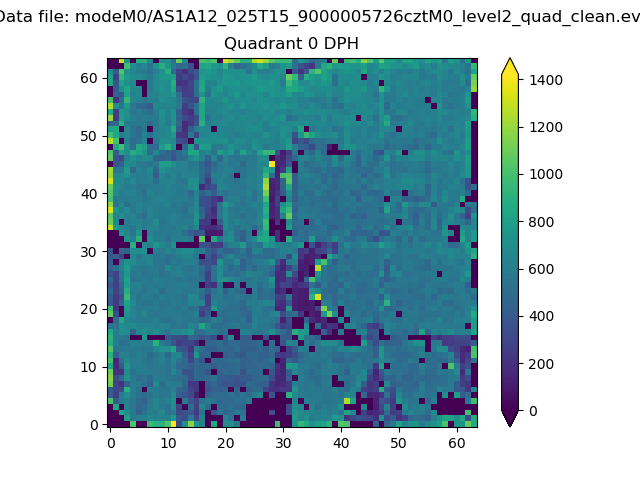 |
 |
Quadrant B |
|---|---|---|---|
| Quadrant D | 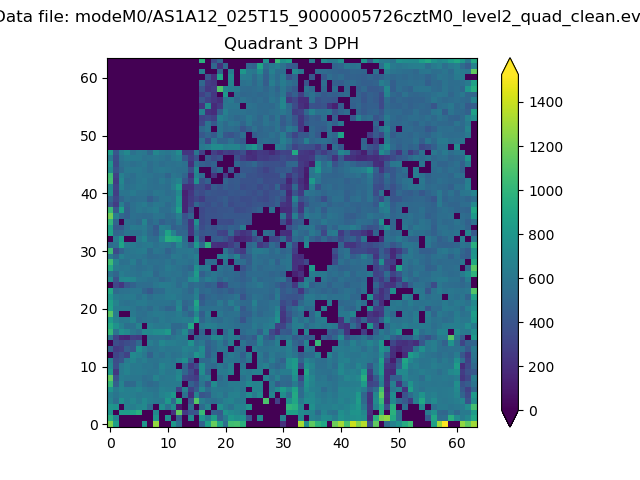 |
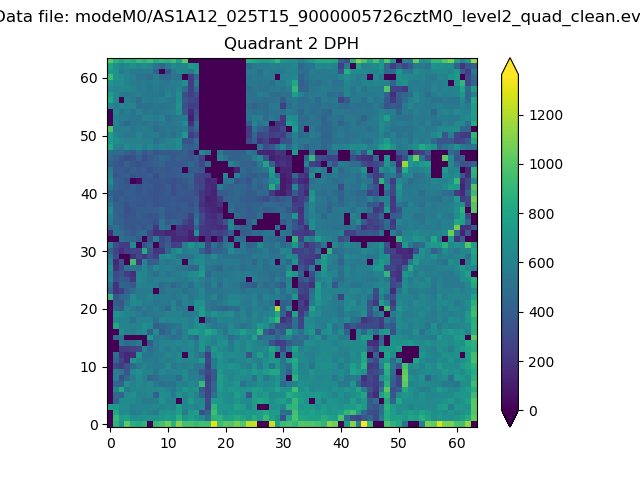 |
Quadrant C |
| Plot type | Count rate plots | Images |
|---|---|---|
| Comparison with Poisson distribution Blue bars denote a histogram of data divided into 1 sec bins. Red curve is a Poisson curve with rate = median count rate of data. |
 |
 |
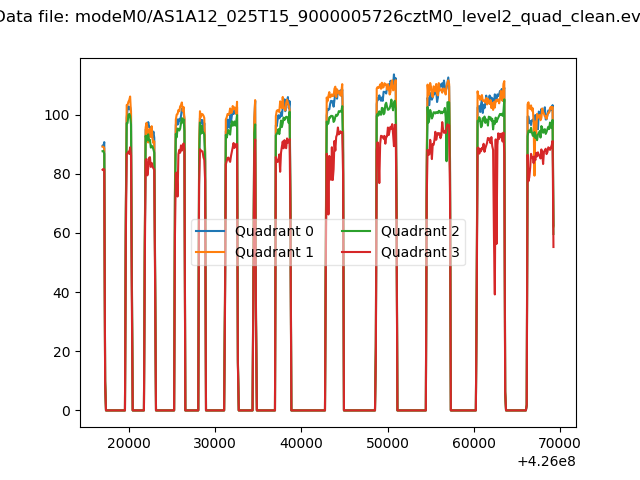
| Quadrant-wise count rates Data is divided into 100 sec bins |
 |
|
| Module-wise count rates for Quadrant A Data is divided into 100 sec bins |
 |
 |
| Module-wise count rates for Quadrant B Data is divided into 100 sec bins |
 |
 |
| Module-wise count rates for Quadrant C Data is divided into 100 sec bins |
 |
 |
| Module-wise count rates for Quadrant D Data is divided into 100 sec bins |
 |
 |
| Parameter | Plot |
|---|---|
| CZT HV Monitor |  |
| D_VDD |  |
| Temperature 1 |  |
| Veto HV Monitor |  |
| Veto LLD |  |
| Alpha Counter |  |
| _CPM_Rate |  |
| CZT Counter |  |
| +2.5 Volts monitor |  |
| +5 Volts monitor |  |
| _ROLL_ROT |  |
| _Roll_DEC |  |
| _Roll_RA |  |
| Veto Counter |  |