| Param | Original file | Final file |
|---|---|---|
| Filename | modeM0/AS1T05_132T01_9000005730cztM0_level2.fits | modeM0/AS1T05_132T01_9000005730cztM0_level2_quad_clean.evt |
| Size (bytes) | 336,620,160 | 374,400,000 |
| Size | 321.0 MB | 357.1 MB |
| Events in quadrant A | 2,036,988 | 2,346,593 |
| Events in quadrant B | 1,963,056 | 2,366,773 |
| Events in quadrant C | 2,000,156 | 2,253,680 |
| Events in quadrant D | 1,580,436 | 1,759,452 |
| Mode SS | |||
|---|---|---|---|
| Quadrant | BADHDUFLAG | Total packets | Discarded packets |
| A | 0 | 778 | 0 |
| B | 0 | 778 | 0 |
| C | 0 | 778 | 0 |
| D | 0 | 778 | 0 |
| Mode M0 | |||
|---|---|---|---|
| Quadrant | BADHDUFLAG | Total packets | Discarded packets |
| A | 0 | 81138 | 0 |
| B | 0 | 79412 | 0 |
| C | 0 | 76308 | 0 |
| D | 0 | 167515 | 0 |
| Mode M9 | |||
|---|---|---|---|
| Quadrant | BADHDUFLAG | Total packets | Discarded packets |
| A | 0 | 153 | 0 |
| B | 0 | 153 | 0 |
| C | 0 | 153 | 0 |
| D | 0 | 153 | 0 |
| Quadrant | Total seconds | Saturated seconds | Saturation percentage |
|---|---|---|---|
| A | 38031 | 77 | 0.202466% |
| B | 38031 | 150 | 0.394415% |
| C | 38031 | 16 | 0.042071% |
| D | 38031 | 4868 | 12.800084% |
Noise dominated data is calculated using 1-second bins in cleaned event files. If a bin has >2000 counts, and if more than 50% of those come from <1% of pixels, then it is considered to be noise-dominated and hence unusable.
| Quadrant | # 1 sec bins | Bins with >0 counts | Bins with >2000 counts | High rate bins dominated by noise | Noise dominated (total time) | Noise dominated (detector-on time) | Marked lightcurve |
|---|---|---|---|---|---|---|---|
| A | 53422 | 38031 | 0 | 0 | 0.00% | 0.00% | 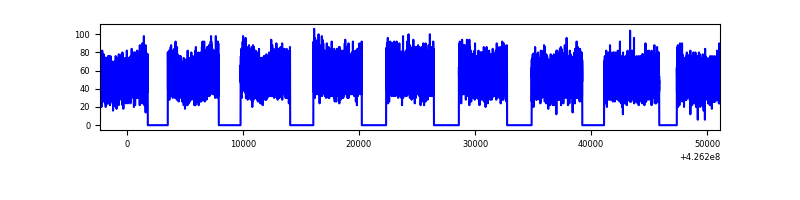 |
| B | 53422 | 38031 | 0 | 0 | 0.00% | 0.00% | 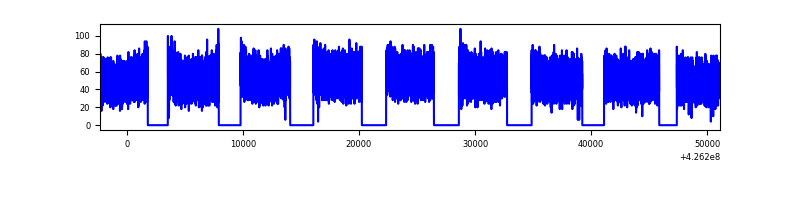 |
| C | 53422 | 38031 | 0 | 0 | 0.00% | 0.00% | 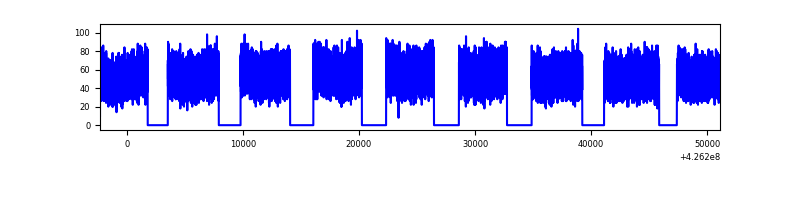 |
| D | 53422 | 37947 | 0 | 0 | 0.00% | 0.00% |  |
Top three noisy pixels from each quadrant. If the there are fewer than three noisy pixels in the level2.evt file, extra rows are filled as -1
| Pixel properties | Quadrant properties | ||||||
|---|---|---|---|---|---|---|---|
| Quadrant | DetID | PixID | Counts | Sigma | Mean | Median | Sigma |
| A | 7 | 110 | 1710 | 8.99 | 533 | 502 | 134.4 |
| A | 0 | 29 | 1708 | 8.97 | 533 | 502 | 134.4 |
| A | 9 | 19 | 1703 | 8.94 | 533 | 502 | 134.4 |
| B | 2 | 9 | 1662 | 11.57 | 519 | 498 | 100.6 |
| B | 3 | 80 | 1468 | 9.64 | 519 | 498 | 100.6 |
| B | 3 | 17 | 1365 | 8.62 | 519 | 498 | 100.6 |
| C | 1 | 81 | 1678 | 8.65 | 528 | 495 | 136.8 |
| C | 3 | 203 | 1579 | 7.92 | 528 | 495 | 136.8 |
| C | 1 | 80 | 1567 | 7.83 | 528 | 495 | 136.8 |
| D | 10 | 189 | 1237 | 6.79 | 451 | 412 | 121.4 |
| D | 7 | 3 | 1200 | 6.49 | 451 | 412 | 121.4 |
| D | 4 | 160 | 1192 | 6.42 | 451 | 412 | 121.4 |
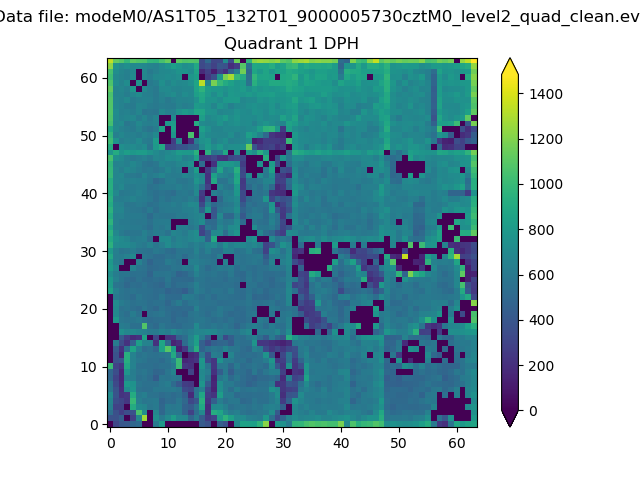
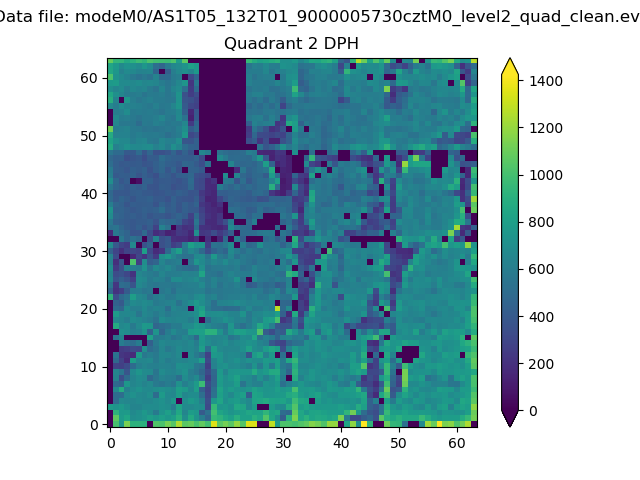
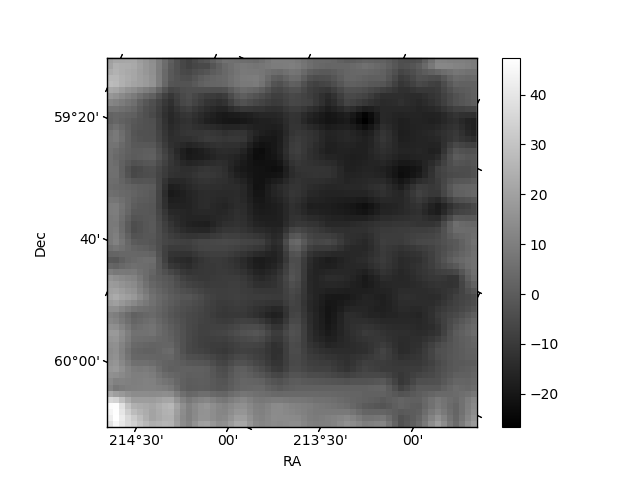
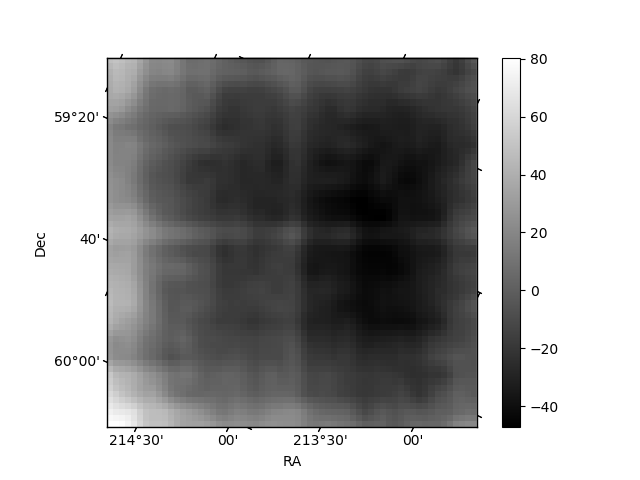
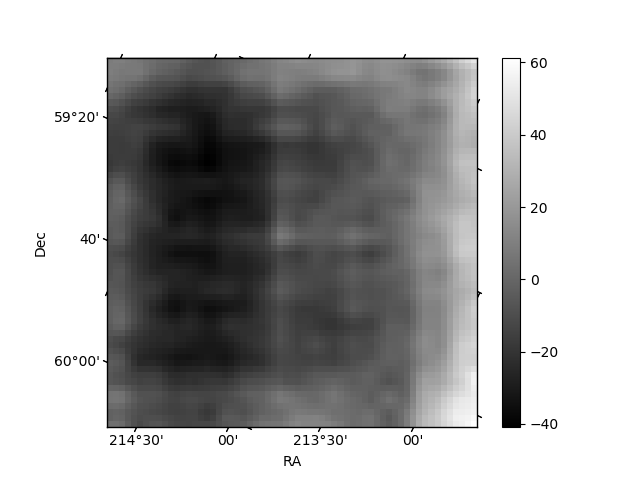
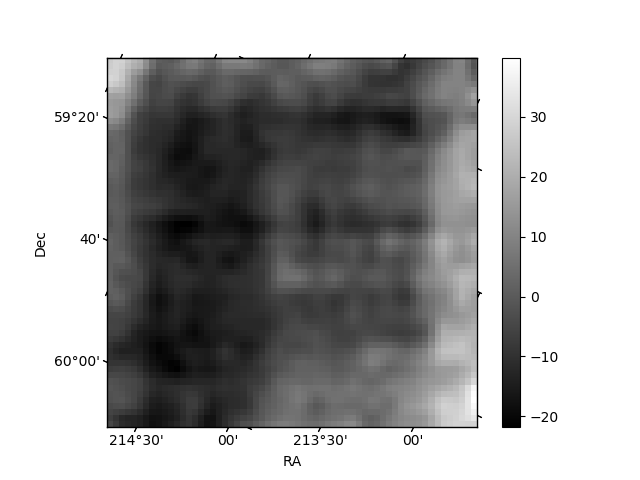
Histogram calculated using DETX and DETY for each event in the final _common_clean file
| Quadrant A | 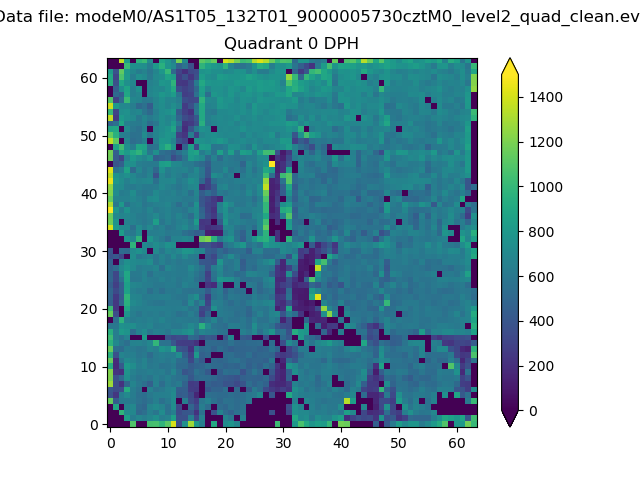 |
 |
Quadrant B |
|---|---|---|---|
| Quadrant D | 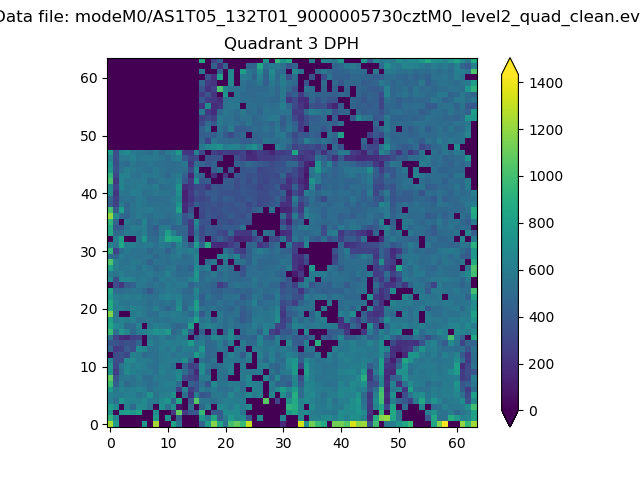 |
 |
Quadrant C |
| Plot type | Count rate plots | Images |
|---|---|---|
| Comparison with Poisson distribution Blue bars denote a histogram of data divided into 1 sec bins. Red curve is a Poisson curve with rate = median count rate of data. |
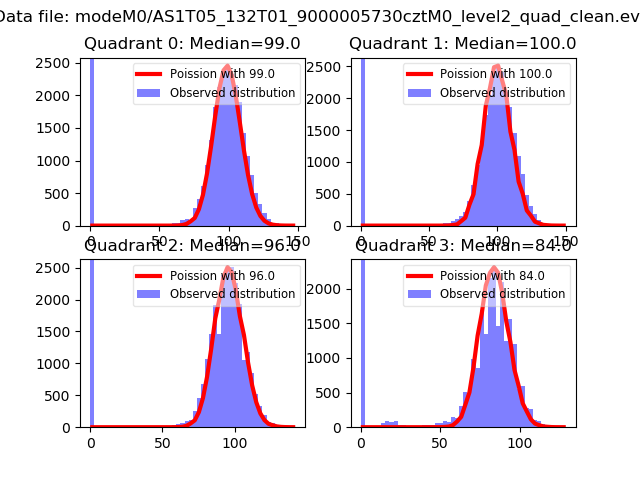 |
 |
| Quadrant-wise count rates Data is divided into 100 sec bins |
 |
|
| Module-wise count rates for Quadrant A Data is divided into 100 sec bins |
 |
 |
| Module-wise count rates for Quadrant B Data is divided into 100 sec bins |
 |
 |
| Module-wise count rates for Quadrant C Data is divided into 100 sec bins |
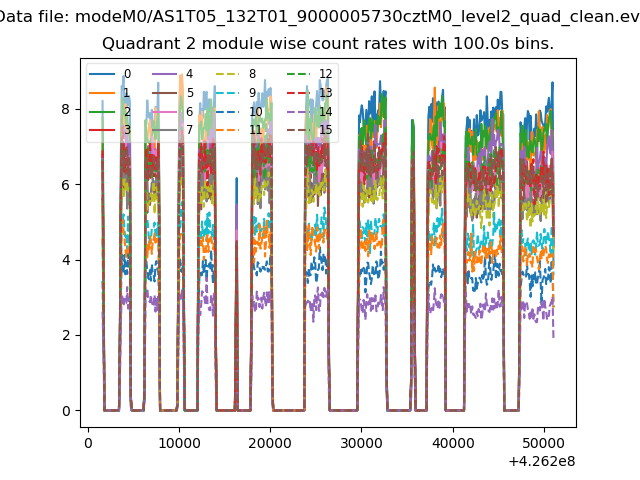 |
 |
| Module-wise count rates for Quadrant D Data is divided into 100 sec bins |
 |
 |
| Parameter | Plot |
|---|---|
| CZT HV Monitor | 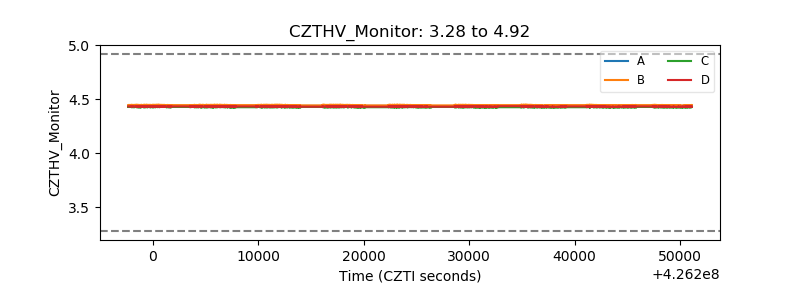 |
| D_VDD | 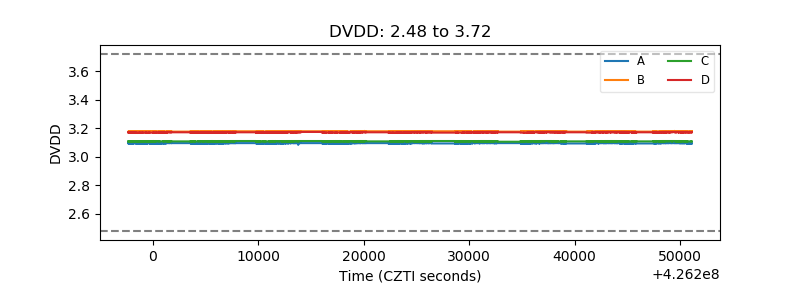 |
| Temperature 1 | 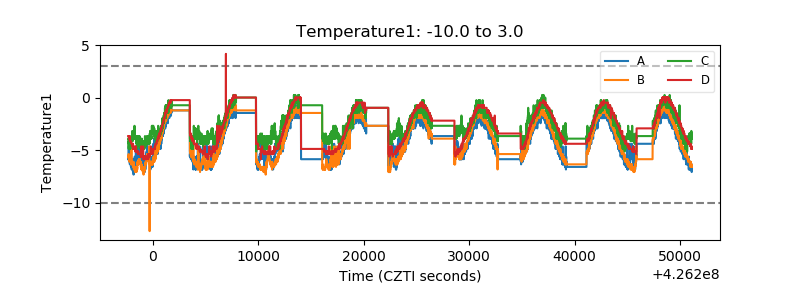 |
| Veto HV Monitor | 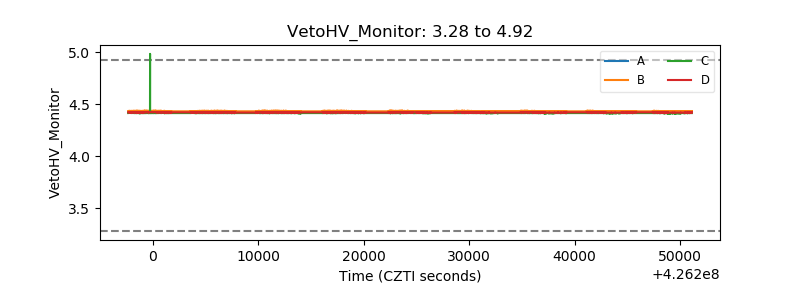 |
| Veto LLD | 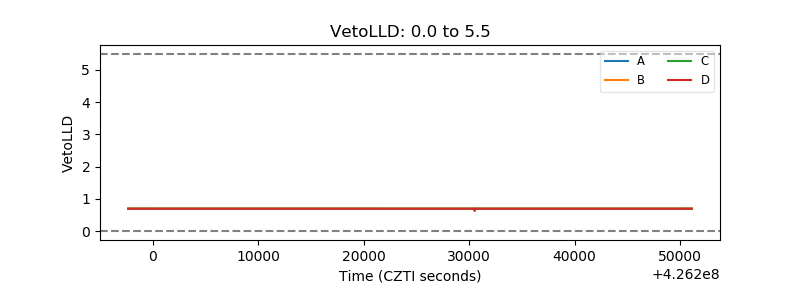 |
| Alpha Counter |  |
| _CPM_Rate | 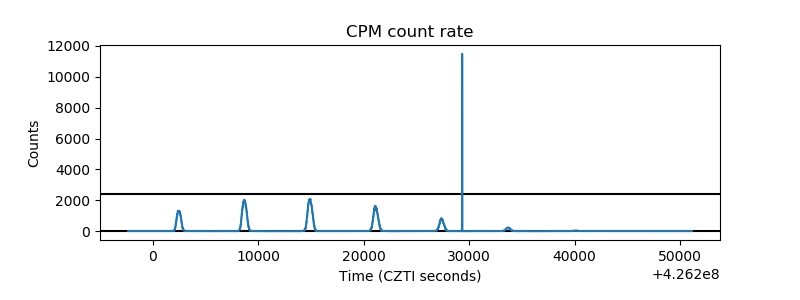 |
| CZT Counter |  |
| +2.5 Volts monitor |  |
| +5 Volts monitor |  |
| _ROLL_ROT |  |
| _Roll_DEC |  |
| _Roll_RA | 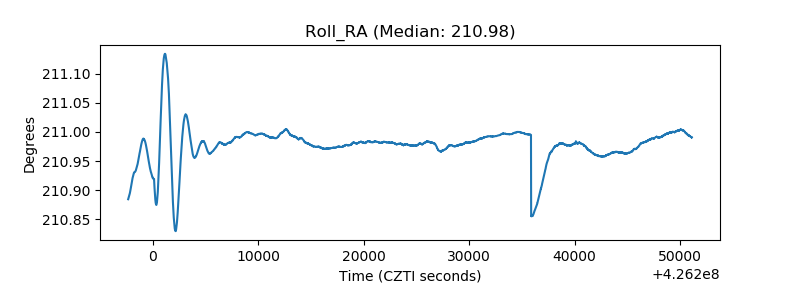 |
| Veto Counter |  |