| Param | Original file | Final file |
|---|---|---|
| Filename | modeM0/AS1A12_006T12_9000005734cztM0_level2.fits | modeM0/AS1A12_006T12_9000005734cztM0_level2_quad_clean.evt |
| Size (bytes) | 374,163,840 | 329,400,000 |
| Size | 356.8 MB | 314.1 MB |
| Events in quadrant A | 2,216,632 | 1,832,541 |
| Events in quadrant B | 2,175,222 | 1,867,312 |
| Events in quadrant C | 2,221,854 | 1,804,044 |
| Events in quadrant D | 1,883,038 | 1,637,164 |
| Mode M0 | |||
|---|---|---|---|
| Quadrant | BADHDUFLAG | Total packets | Discarded packets |
| A | 0 | 106710 | 0 |
| B | 0 | 92003 | 0 |
| C | 0 | 83676 | 0 |
| D | 0 | 104830 | 0 |
| Mode M9 | |||
|---|---|---|---|
| Quadrant | BADHDUFLAG | Total packets | Discarded packets |
| A | 0 | 166 | 0 |
| B | 0 | 166 | 0 |
| C | 0 | 166 | 0 |
| D | 0 | 166 | 0 |
| Mode SS | |||
|---|---|---|---|
| Quadrant | BADHDUFLAG | Total packets | Discarded packets |
| A | 0 | 842 | 0 |
| B | 0 | 842 | 0 |
| C | 0 | 842 | 0 |
| D | 0 | 842 | 0 |
| Quadrant | Total seconds | Saturated seconds | Saturation percentage |
|---|---|---|---|
| A | 41278 | 1717 | 4.159601% |
| B | 41279 | 764 | 1.850820% |
| C | 41279 | 29 | 0.070254% |
| D | 41279 | 1565 | 3.791274% |
Noise dominated data is calculated using 1-second bins in cleaned event files. If a bin has >2000 counts, and if more than 50% of those come from <1% of pixels, then it is considered to be noise-dominated and hence unusable.
| Quadrant | # 1 sec bins | Bins with >0 counts | Bins with >2000 counts | High rate bins dominated by noise | Noise dominated (total time) | Noise dominated (detector-on time) | Marked lightcurve |
|---|---|---|---|---|---|---|---|
| A | 57772 | 41260 | 0 | 0 | 0.00% | 0.00% |  |
| B | 57772 | 41276 | 0 | 0 | 0.00% | 0.00% |  |
| C | 57772 | 41279 | 0 | 0 | 0.00% | 0.00% |  |
| D | 57772 | 41212 | 0 | 0 | 0.00% | 0.00% |  |
Top three noisy pixels from each quadrant. If the there are fewer than three noisy pixels in the level2.evt file, extra rows are filled as -1
| Pixel properties | Quadrant properties | ||||||
|---|---|---|---|---|---|---|---|
| Quadrant | DetID | PixID | Counts | Sigma | Mean | Median | Sigma |
| A | 0 | 29 | 1835 | 8.9 | 578 | 542 | 145.3 |
| A | 7 | 110 | 1772 | 8.47 | 578 | 542 | 145.3 |
| A | 9 | 19 | 1740 | 8.25 | 578 | 542 | 145.3 |
| B | 2 | 9 | 1886 | 12.1 | 574 | 548 | 110.6 |
| B | 3 | 80 | 1555 | 9.11 | 574 | 548 | 110.6 |
| B | 2 | 8 | 1506 | 8.66 | 574 | 548 | 110.6 |
| C | 1 | 81 | 1758 | 7.96 | 587 | 548 | 152.0 |
| C | 3 | 202 | 1740 | 7.84 | 587 | 548 | 152.0 |
| C | 3 | 203 | 1713 | 7.67 | 587 | 548 | 152.0 |
| D | 7 | 3 | 1438 | 6.54 | 538 | 489 | 145.1 |
| D | 10 | 189 | 1375 | 6.1 | 538 | 489 | 145.1 |
| D | 3 | 14 | 1358 | 5.99 | 538 | 489 | 145.1 |
Histogram calculated using DETX and DETY for each event in the final _common_clean file
| Quadrant A | 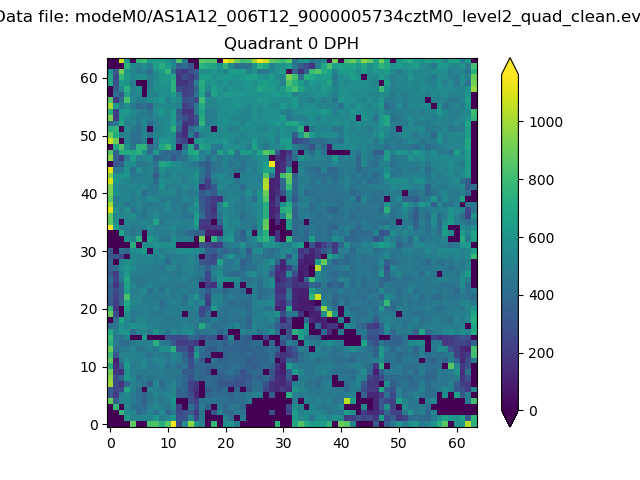 |
 |
Quadrant B |
|---|---|---|---|
| Quadrant D |  |
 |
Quadrant C |
| Plot type | Count rate plots | Images |
|---|---|---|
| Comparison with Poisson distribution Blue bars denote a histogram of data divided into 1 sec bins. Red curve is a Poisson curve with rate = median count rate of data. |
 |
 |
| Quadrant-wise count rates Data is divided into 100 sec bins |
 |
|
| Module-wise count rates for Quadrant A Data is divided into 100 sec bins |
 |
 |
| Module-wise count rates for Quadrant B Data is divided into 100 sec bins |
 |
 |
| Module-wise count rates for Quadrant C Data is divided into 100 sec bins |
 |
 |
| Module-wise count rates for Quadrant D Data is divided into 100 sec bins |
 |
 |
| Parameter | Plot |
|---|---|
| CZT HV Monitor |  |
| D_VDD | 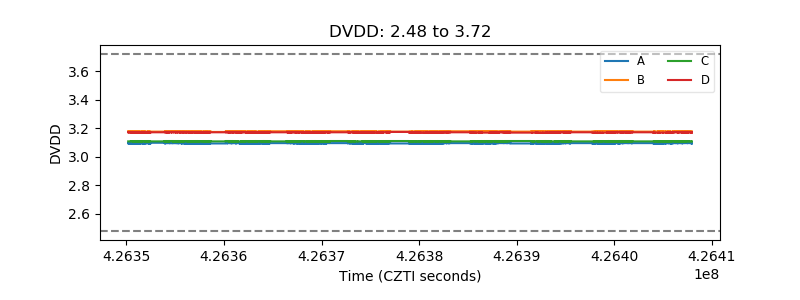 |
| Temperature 1 |  |
| Veto HV Monitor |  |
| Veto LLD |  |
| Alpha Counter |  |
| _CPM_Rate |  |
| CZT Counter |  |
| +2.5 Volts monitor |  |
| +5 Volts monitor |  |
| _ROLL_ROT |  |
| _Roll_DEC |  |
| _Roll_RA |  |
| Veto Counter |  |