| Param | Original file | Final file |
|---|---|---|
| Filename | modeM0/AS1A12_037T01_9000005736cztM0_level2.fits | modeM0/AS1A12_037T01_9000005736cztM0_level2_quad_clean.evt |
| Size (bytes) | 671,783,040 | 705,185,280 |
| Size | 640.7 MB | 672.5 MB |
| Events in quadrant A | 3,909,738 | 3,995,150 |
| Events in quadrant B | 3,883,788 | 4,330,228 |
| Events in quadrant C | 3,945,286 | 4,109,813 |
| Events in quadrant D | 3,394,326 | 3,712,638 |
| Mode SS | |||
|---|---|---|---|
| Quadrant | BADHDUFLAG | Total packets | Discarded packets |
| A | 0 | 1554 | 0 |
| B | 0 | 1554 | 0 |
| C | 0 | 1554 | 0 |
| D | 0 | 1554 | 0 |
| Mode M0 | |||
|---|---|---|---|
| Quadrant | BADHDUFLAG | Total packets | Discarded packets |
| A | 0 | 216774 | 0 |
| B | 0 | 162196 | 0 |
| C | 0 | 154453 | 0 |
| D | 0 | 183991 | 0 |
| Mode M9 | |||
|---|---|---|---|
| Quadrant | BADHDUFLAG | Total packets | Discarded packets |
| A | 0 | 283 | 0 |
| B | 0 | 283 | 0 |
| C | 0 | 283 | 0 |
| D | 0 | 283 | 0 |
| Quadrant | Total seconds | Saturated seconds | Saturation percentage |
|---|---|---|---|
| A | 75967 | 4558 | 5.999974% |
| B | 75975 | 603 | 0.793682% |
| C | 75959 | 55 | 0.072407% |
| D | 75964 | 1938 | 2.551208% |
Noise dominated data is calculated using 1-second bins in cleaned event files. If a bin has >2000 counts, and if more than 50% of those come from <1% of pixels, then it is considered to be noise-dominated and hence unusable.
| Quadrant | # 1 sec bins | Bins with >0 counts | Bins with >2000 counts | High rate bins dominated by noise | Noise dominated (total time) | Noise dominated (detector-on time) | Marked lightcurve |
|---|---|---|---|---|---|---|---|
| A | 102778 | 75966 | 0 | 0 | 0.00% | 0.00% | 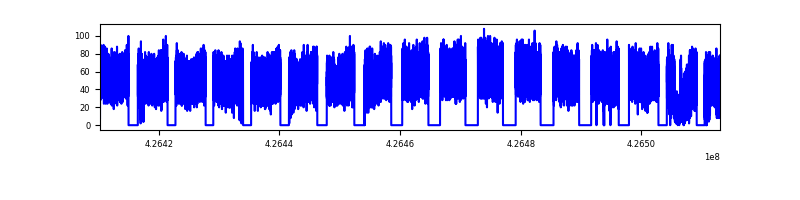 |
| B | 102778 | 75987 | 0 | 0 | 0.00% | 0.00% | 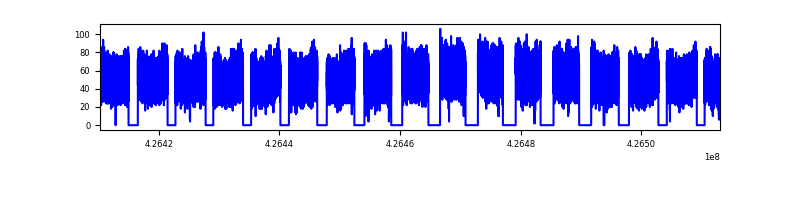 |
| C | 102778 | 75974 | 0 | 0 | 0.00% | 0.00% | 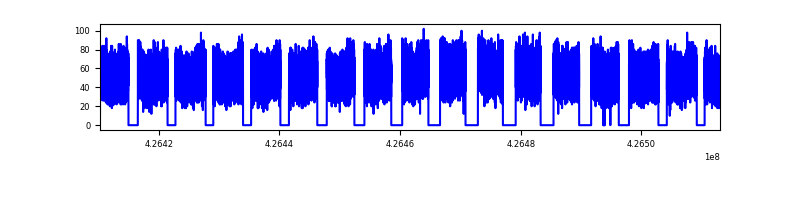 |
| D | 102778 | 75950 | 0 | 0 | 0.00% | 0.00% | 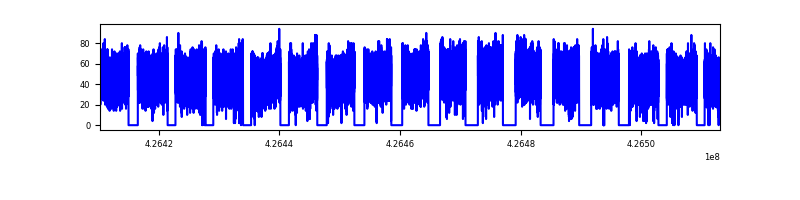 |
Top three noisy pixels from each quadrant. If the there are fewer than three noisy pixels in the level2.evt file, extra rows are filled as -1
| Pixel properties | Quadrant properties | ||||||
|---|---|---|---|---|---|---|---|
| Quadrant | DetID | PixID | Counts | Sigma | Mean | Median | Sigma |
| A | 9 | 19 | 3320 | 9.26 | 1019 | 954 | 255.5 |
| A | 7 | 110 | 3173 | 8.68 | 1019 | 954 | 255.5 |
| A | 0 | 29 | 3103 | 8.41 | 1019 | 954 | 255.5 |
| B | 2 | 9 | 3378 | 11.96 | 1027 | 980 | 200.4 |
| B | 3 | 80 | 2871 | 9.43 | 1027 | 980 | 200.4 |
| B | 3 | 17 | 2676 | 8.46 | 1027 | 980 | 200.4 |
| C | 1 | 81 | 3254 | 8.48 | 1045 | 975 | 268.7 |
| C | 1 | 80 | 3133 | 8.03 | 1045 | 975 | 268.7 |
| C | 1 | 65 | 2748 | 6.6 | 1045 | 975 | 268.7 |
| D | 7 | 3 | 2590 | 6.57 | 971 | 884 | 259.8 |
| D | 10 | 189 | 2452 | 6.04 | 971 | 884 | 259.8 |
| D | 6 | 38 | 2440 | 5.99 | 971 | 884 | 259.8 |
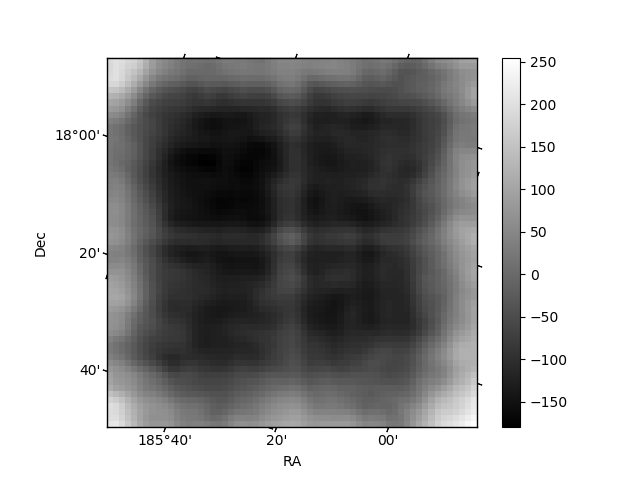
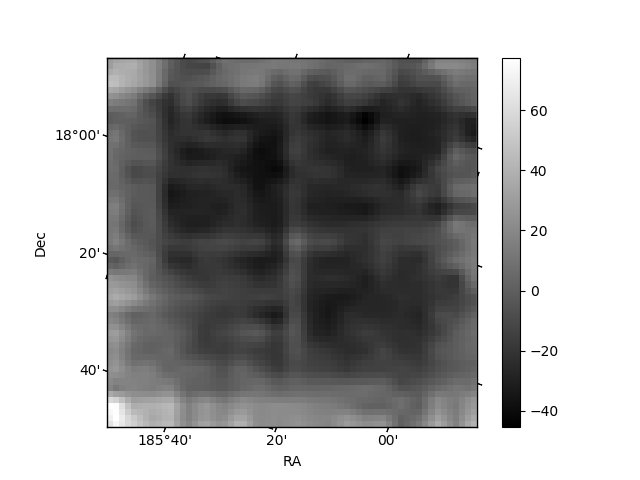
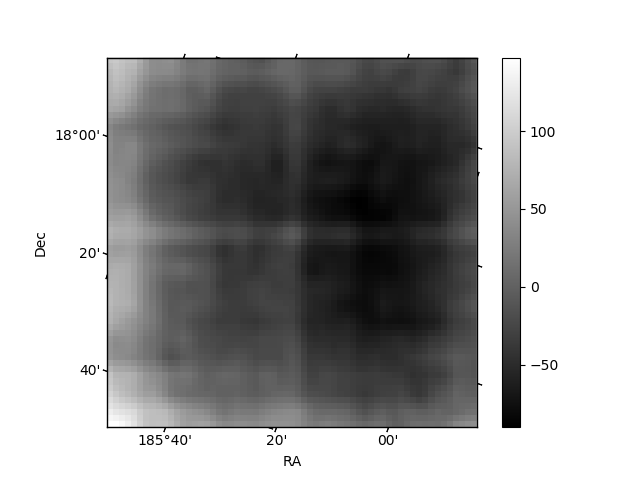
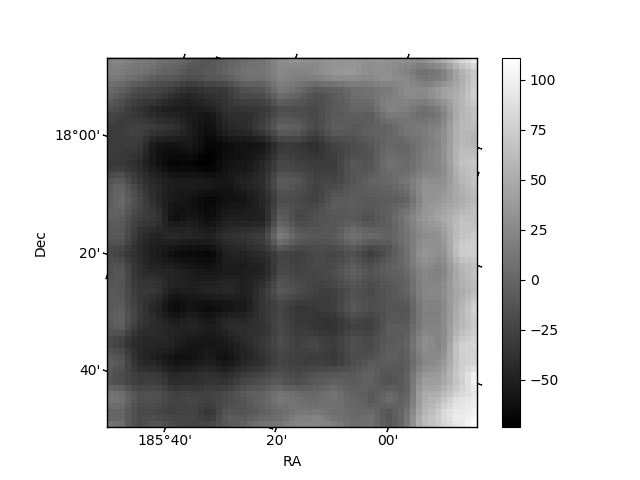
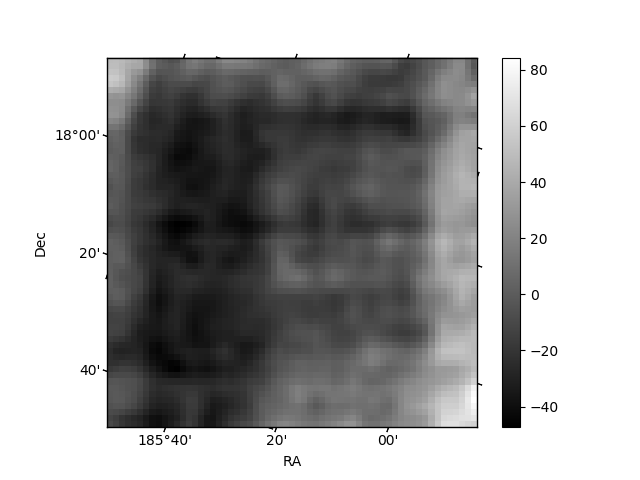
Histogram calculated using DETX and DETY for each event in the final _common_clean file
| Quadrant A | 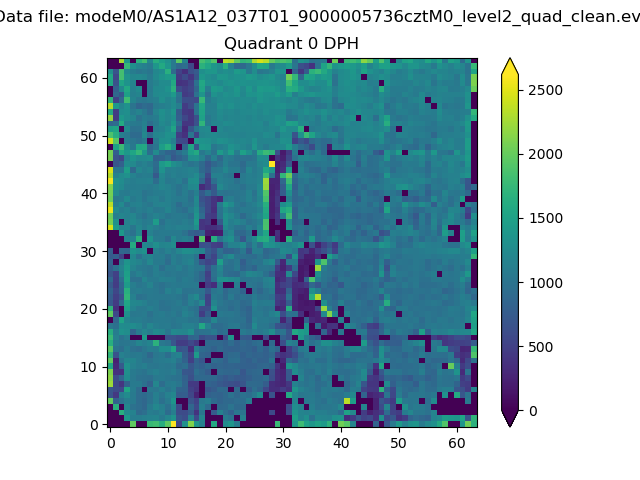 |
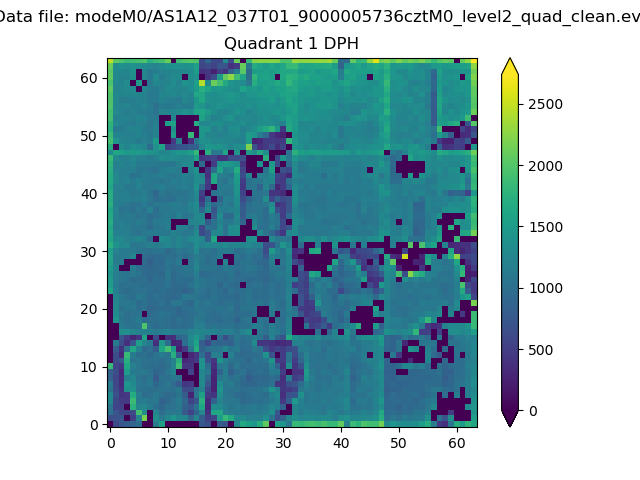 |
Quadrant B |
|---|---|---|---|
| Quadrant D | 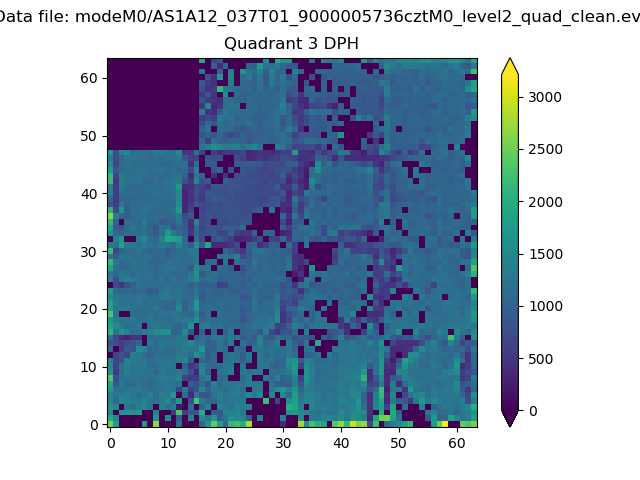 |
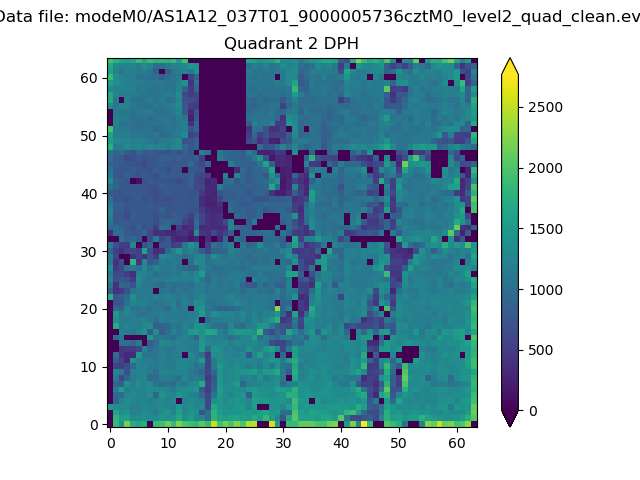 |
Quadrant C |
| Plot type | Count rate plots | Images |
|---|---|---|
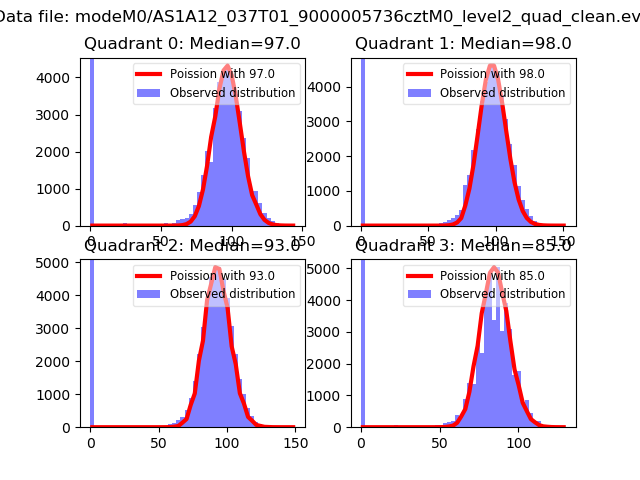
| Comparison with Poisson distribution Blue bars denote a histogram of data divided into 1 sec bins. Red curve is a Poisson curve with rate = median count rate of data. |
 |
 |
| Quadrant-wise count rates Data is divided into 100 sec bins |
 |
|
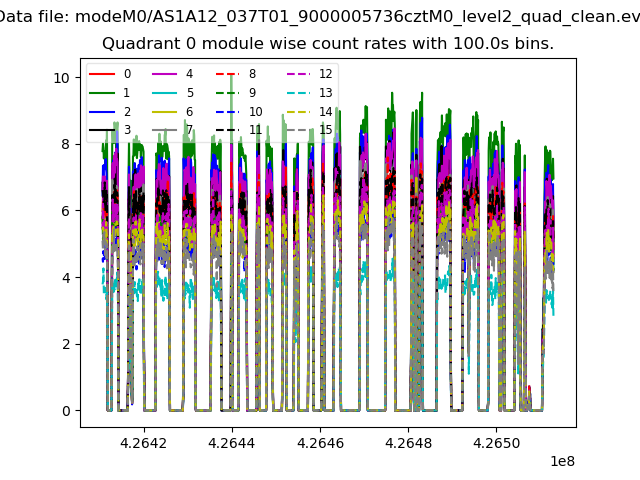
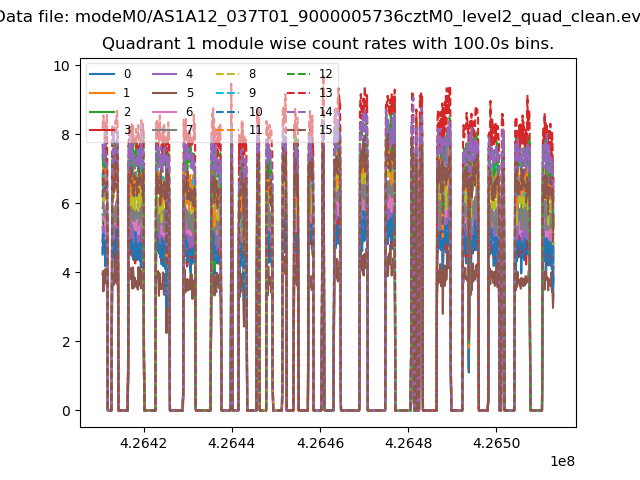
| Module-wise count rates for Quadrant A Data is divided into 100 sec bins |
 |
 |
| Module-wise count rates for Quadrant B Data is divided into 100 sec bins |
 |
 |
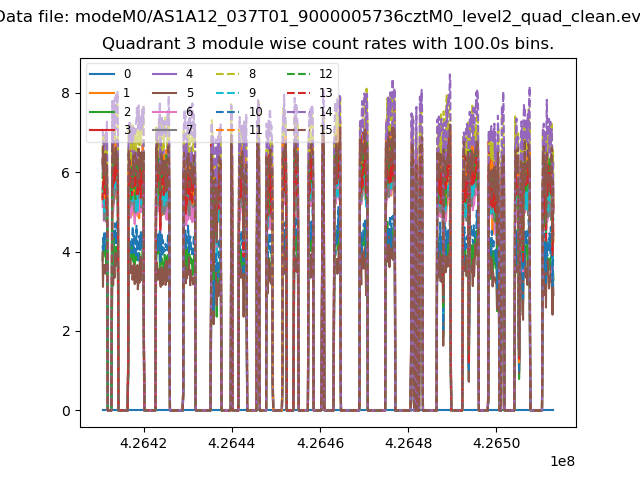
| Module-wise count rates for Quadrant C Data is divided into 100 sec bins |
 |
 |
| Module-wise count rates for Quadrant D Data is divided into 100 sec bins |
 |
 |
| Parameter | Plot |
|---|---|
| CZT HV Monitor | 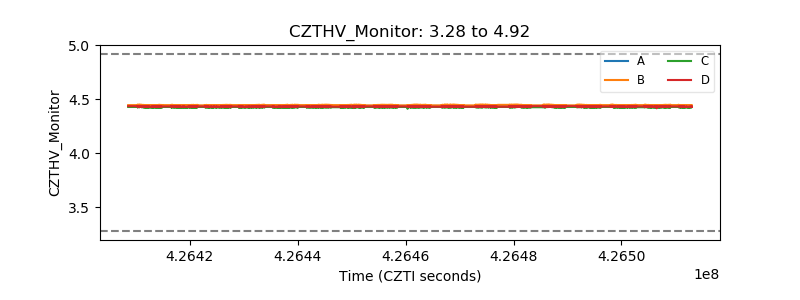 |
| D_VDD | 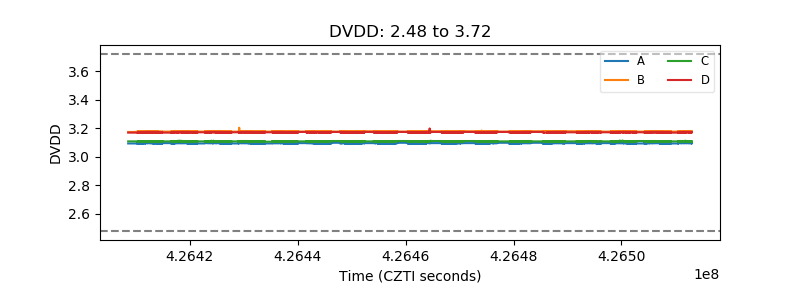 |
| Temperature 1 | 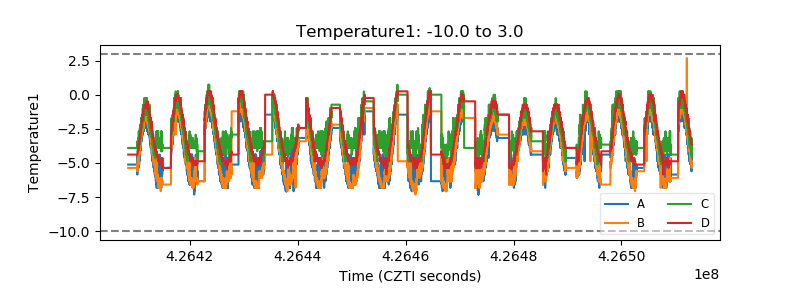 |
| Veto HV Monitor | 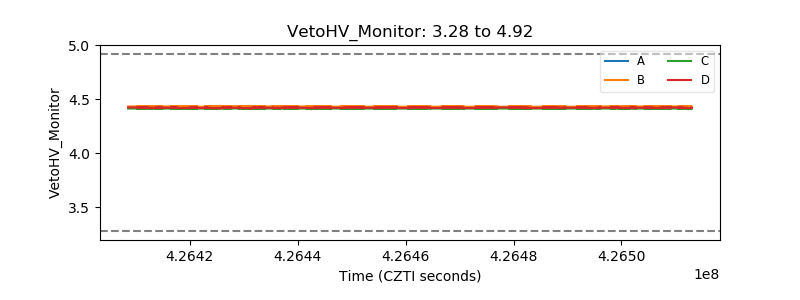 |
| Veto LLD | 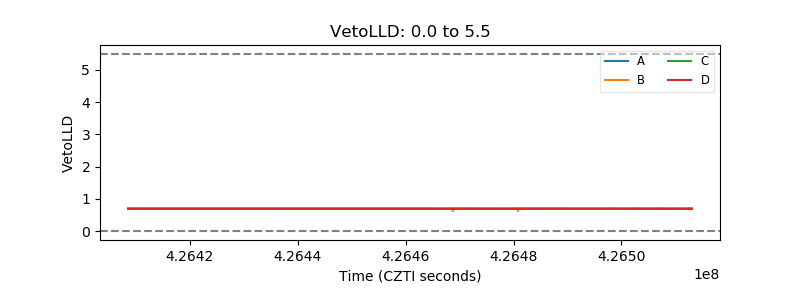 |
| Alpha Counter |  |
| _CPM_Rate | 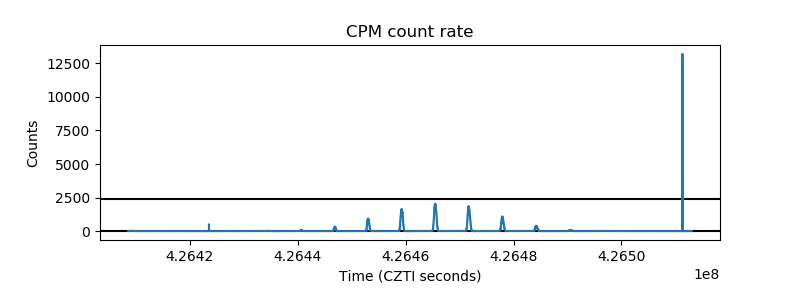 |
| CZT Counter | 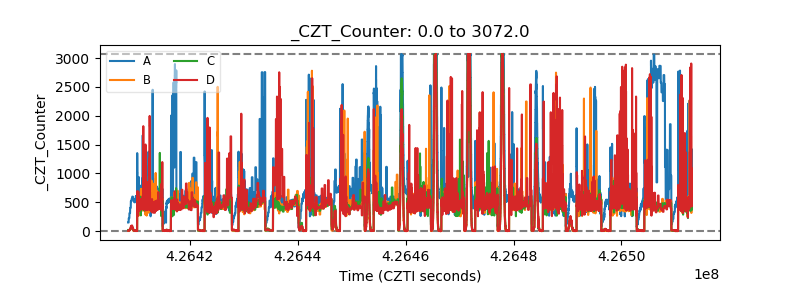 |
| +2.5 Volts monitor | 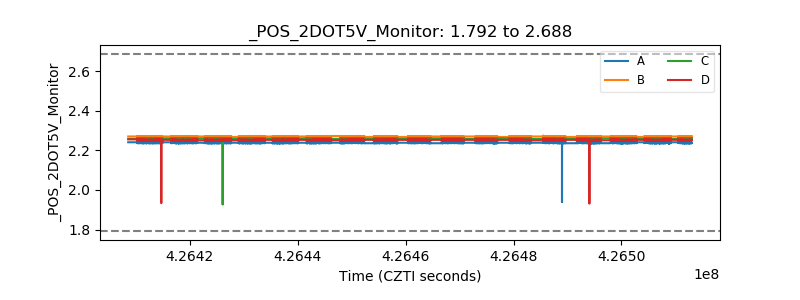 |
| +5 Volts monitor | 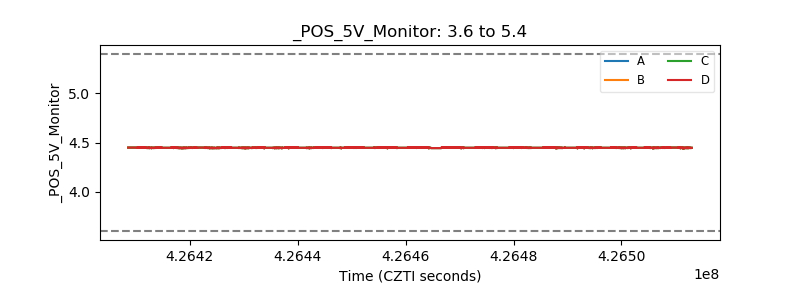 |
| _ROLL_ROT | 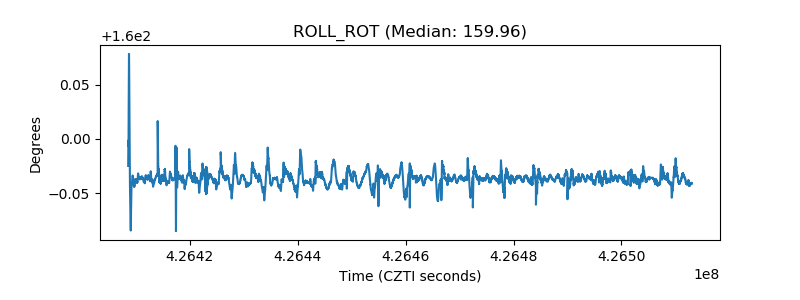 |
| _Roll_DEC | 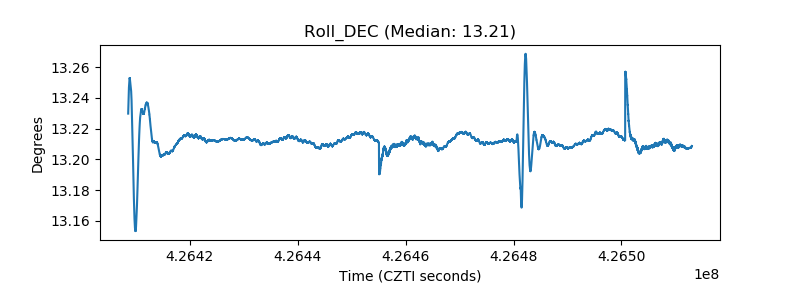 |
| _Roll_RA | 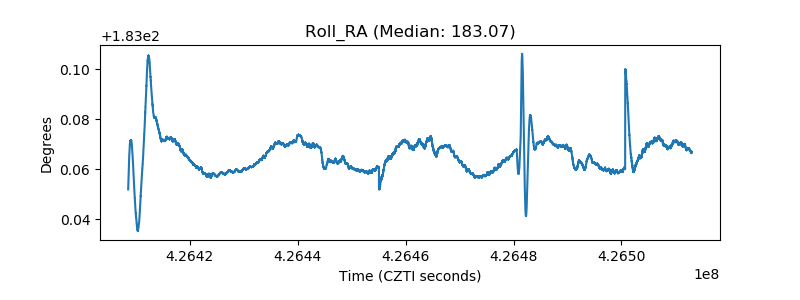 |
| Veto Counter | 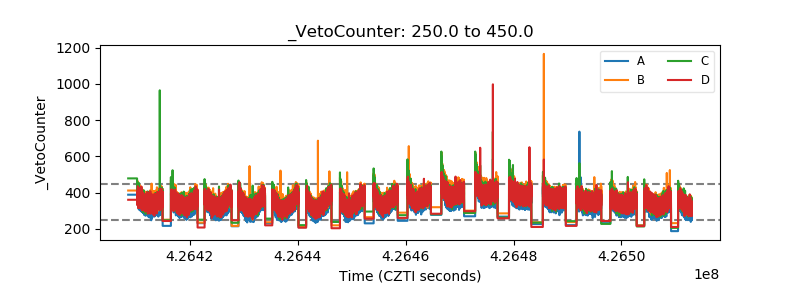 |