| Param | Original file | Final file |
|---|---|---|
| Filename | modeM0/AS1A12_037T03_9000005738cztM0_level2.fits | modeM0/AS1A12_037T03_9000005738cztM0_level2_quad_clean.evt |
| Size (bytes) | 173,568,960 | 166,037,760 |
| Size | 165.5 MB | 158.3 MB |
| Events in quadrant A | 1,027,076 | 943,077 |
| Events in quadrant B | 1,014,852 | 993,188 |
| Events in quadrant C | 1,025,080 | 935,751 |
| Events in quadrant D | 861,140 | 827,458 |
| Mode SS | |||
|---|---|---|---|
| Quadrant | BADHDUFLAG | Total packets | Discarded packets |
| A | 0 | 394 | 0 |
| B | 0 | 394 | 0 |
| C | 0 | 394 | 0 |
| D | 0 | 394 | 0 |
| Mode M9 | |||
|---|---|---|---|
| Quadrant | BADHDUFLAG | Total packets | Discarded packets |
| A | 0 | 97 | 0 |
| B | 0 | 97 | 0 |
| C | 0 | 97 | 0 |
| D | 0 | 99 | 0 |
| Mode M0 | |||
|---|---|---|---|
| Quadrant | BADHDUFLAG | Total packets | Discarded packets |
| A | 0 | 58132 | 0 |
| B | 0 | 40095 | 0 |
| C | 0 | 38790 | 0 |
| D | 0 | 51536 | 0 |
| Quadrant | Total seconds | Saturated seconds | Saturation percentage |
|---|---|---|---|
| A | 19277 | 465 | 2.412201% |
| B | 19277 | 97 | 0.503190% |
| C | 19277 | 12 | 0.062250% |
| D | 19277 | 967 | 5.016341% |
Noise dominated data is calculated using 1-second bins in cleaned event files. If a bin has >2000 counts, and if more than 50% of those come from <1% of pixels, then it is considered to be noise-dominated and hence unusable.
| Quadrant | # 1 sec bins | Bins with >0 counts | Bins with >2000 counts | High rate bins dominated by noise | Noise dominated (total time) | Noise dominated (detector-on time) | Marked lightcurve |
|---|---|---|---|---|---|---|---|
| A | 132323 | 19276 | 0 | 0 | 0.00% | 0.00% |  |
| B | 132323 | 19276 | 0 | 0 | 0.00% | 0.00% | 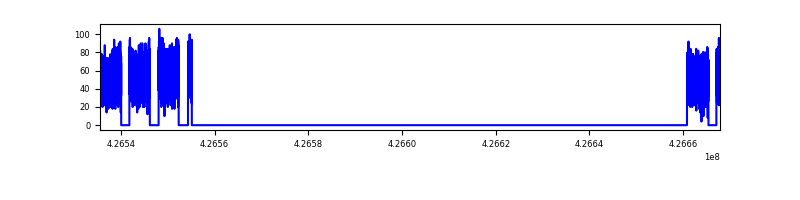 |
| C | 132323 | 19276 | 0 | 0 | 0.00% | 0.00% | 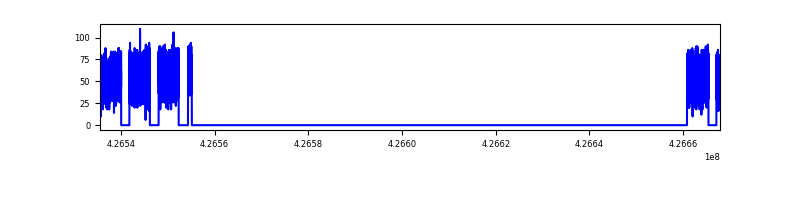 |
| D | 132323 | 19249 | 0 | 0 | 0.00% | 0.00% |  |
Top three noisy pixels from each quadrant. If the there are fewer than three noisy pixels in the level2.evt file, extra rows are filled as -1
| Pixel properties | Quadrant properties | ||||||
|---|---|---|---|---|---|---|---|
| Quadrant | DetID | PixID | Counts | Sigma | Mean | Median | Sigma |
| A | 9 | 19 | 845 | 8.61 | 268 | 251 | 69.0 |
| A | 0 | 29 | 838 | 8.51 | 268 | 251 | 69.0 |
| A | 7 | 110 | 833 | 8.44 | 268 | 251 | 69.0 |
| B | 2 | 9 | 927 | 12.25 | 268 | 255 | 54.9 |
| B | 2 | 8 | 771 | 9.4 | 268 | 255 | 54.9 |
| B | 5 | 128 | 717 | 8.42 | 268 | 255 | 54.9 |
| C | 1 | 81 | 918 | 9.31 | 270 | 252 | 71.6 |
| C | 1 | 80 | 850 | 8.36 | 270 | 252 | 71.6 |
| C | 3 | 202 | 825 | 8.01 | 270 | 252 | 71.6 |
| D | 7 | 3 | 678 | 6.81 | 246 | 223 | 66.9 |
| D | 15 | 46 | 617 | 5.89 | 246 | 223 | 66.9 |
| D | 4 | 160 | 613 | 5.83 | 246 | 223 | 66.9 |
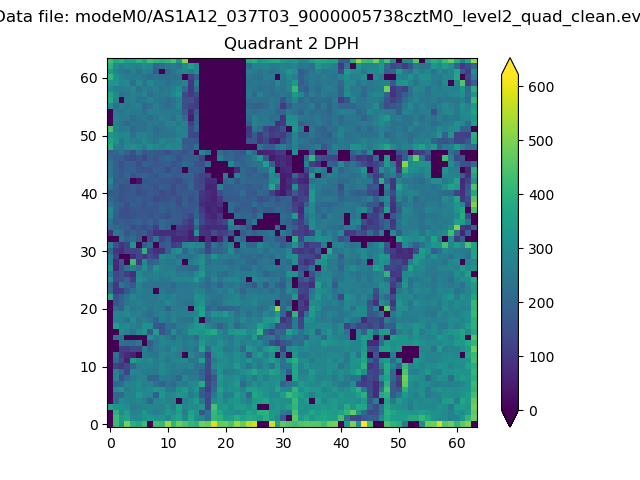
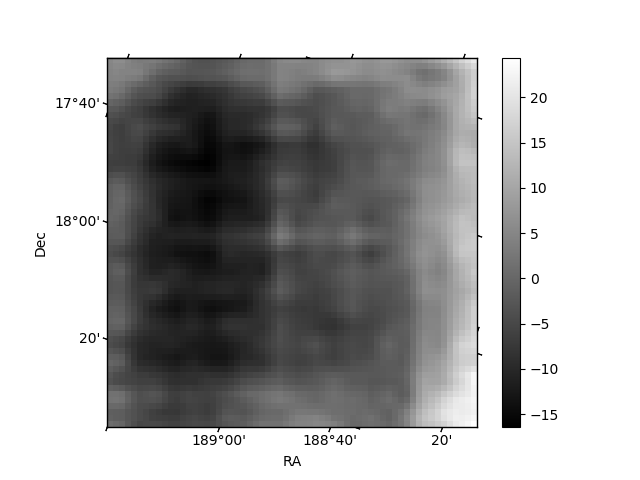
Histogram calculated using DETX and DETY for each event in the final _common_clean file
| Quadrant A |  |
 |
Quadrant B |
|---|---|---|---|
| Quadrant D | 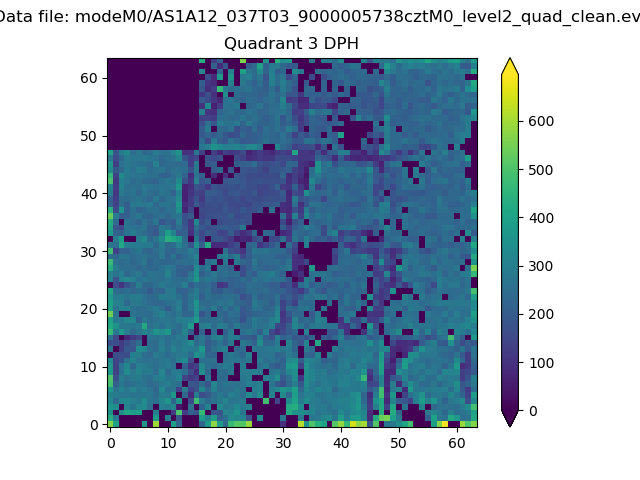 |
 |
Quadrant C |
| Plot type | Count rate plots | Images |
|---|---|---|
| Comparison with Poisson distribution Blue bars denote a histogram of data divided into 1 sec bins. Red curve is a Poisson curve with rate = median count rate of data. |
 |
 |
| Quadrant-wise count rates Data is divided into 100 sec bins |
 |
|
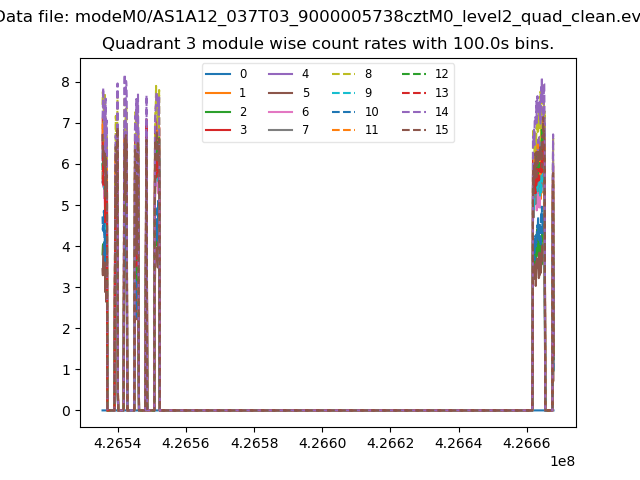
| Module-wise count rates for Quadrant A Data is divided into 100 sec bins |
 |
 |
| Module-wise count rates for Quadrant B Data is divided into 100 sec bins |
 |
 |
| Module-wise count rates for Quadrant C Data is divided into 100 sec bins |
 |
 |
| Module-wise count rates for Quadrant D Data is divided into 100 sec bins |
 |
 |
| Parameter | Plot |
|---|---|
| CZT HV Monitor |  |
| D_VDD | 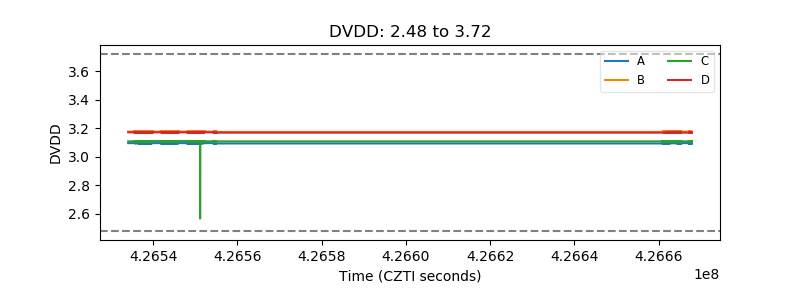 |
| Temperature 1 | 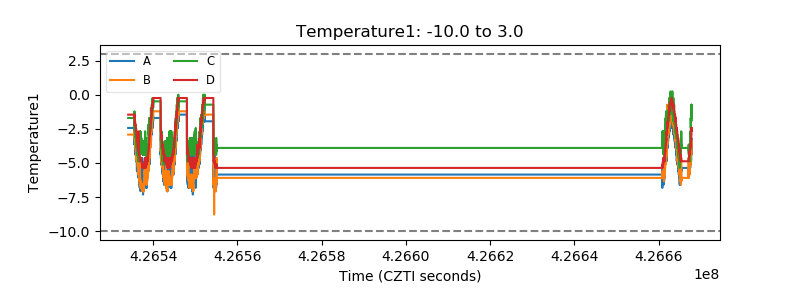 |
| Veto HV Monitor |  |
| Veto LLD |  |
| Alpha Counter |  |
| _CPM_Rate |  |
| CZT Counter |  |
| +2.5 Volts monitor |  |
| +5 Volts monitor |  |
| _ROLL_ROT | 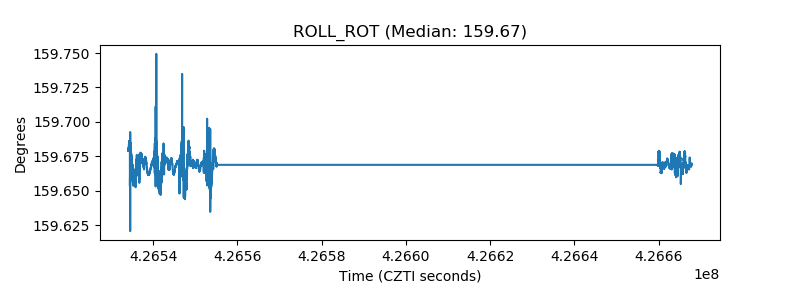 |
| _Roll_DEC | 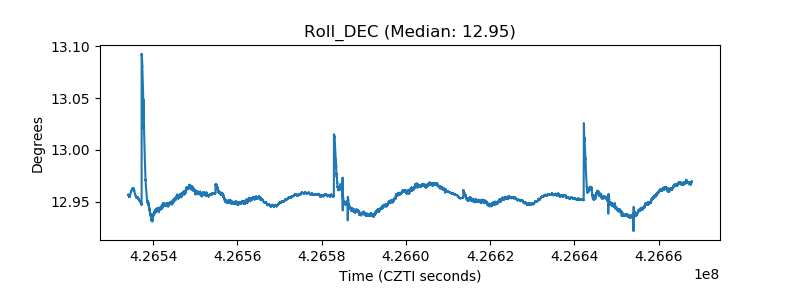 |
| _Roll_RA |  |
| Veto Counter | 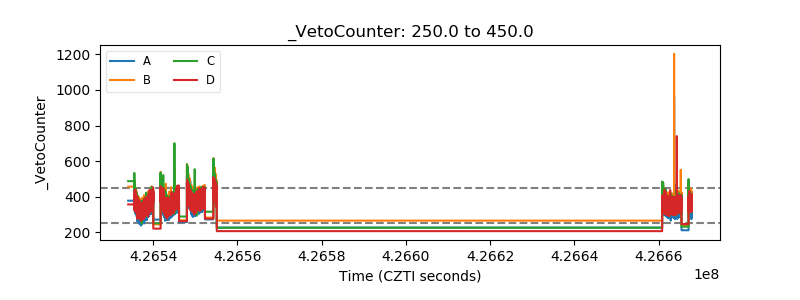 |