| Param | Original file | Final file |
|---|---|---|
| Filename | modeM0/AS1A12_037T03_9000005738cztM0_level2.fits | modeM0/AS1A12_037T03_9000005738cztM0_level2_quad_clean.evt |
| Size (bytes) | 847,967,040 | 930,551,040 |
| Size | 808.7 MB | 887.4 MB |
| Events in quadrant A | 4,971,582 | 5,570,028 |
| Events in quadrant B | 4,936,436 | 5,762,504 |
| Events in quadrant C | 5,000,056 | 5,438,597 |
| Events in quadrant D | 4,220,640 | 4,862,888 |
| Mode SS | |||
|---|---|---|---|
| Quadrant | BADHDUFLAG | Total packets | Discarded packets |
| A | 0 | 1956 | 0 |
| B | 0 | 1956 | 0 |
| C | 0 | 1956 | 0 |
| D | 0 | 1956 | 0 |
| Mode M9 | |||
|---|---|---|---|
| Quadrant | BADHDUFLAG | Total packets | Discarded packets |
| A | 0 | 366 | 0 |
| B | 0 | 367 | 0 |
| C | 0 | 367 | 0 |
| D | 0 | 367 | 0 |
| Mode M0 | |||
|---|---|---|---|
| Quadrant | BADHDUFLAG | Total packets | Discarded packets |
| A | 0 | 272115 | 0 |
| B | 0 | 196144 | 0 |
| C | 0 | 192374 | 0 |
| D | 0 | 246658 | 0 |
| Quadrant | Total seconds | Saturated seconds | Saturation percentage |
|---|---|---|---|
| A | 95537 | 3833 | 4.012058% |
| B | 95543 | 356 | 0.372607% |
| C | 95541 | 53 | 0.055474% |
| D | 95541 | 3912 | 4.094577% |
Noise dominated data is calculated using 1-second bins in cleaned event files. If a bin has >2000 counts, and if more than 50% of those come from <1% of pixels, then it is considered to be noise-dominated and hence unusable.
| Quadrant | # 1 sec bins | Bins with >0 counts | Bins with >2000 counts | High rate bins dominated by noise | Noise dominated (total time) | Noise dominated (detector-on time) | Marked lightcurve |
|---|---|---|---|---|---|---|---|
| A | 137406 | 95532 | 0 | 0 | 0.00% | 0.00% |  |
| B | 137406 | 95546 | 0 | 0 | 0.00% | 0.00% |  |
| C | 137406 | 95545 | 0 | 0 | 0.00% | 0.00% |  |
| D | 137406 | 95465 | 0 | 0 | 0.00% | 0.00% |  |
Top three noisy pixels from each quadrant. If the there are fewer than three noisy pixels in the level2.evt file, extra rows are filled as -1
| Pixel properties | Quadrant properties | ||||||
|---|---|---|---|---|---|---|---|
| Quadrant | DetID | PixID | Counts | Sigma | Mean | Median | Sigma |
| A | 7 | 110 | 4134 | 9.03 | 1299 | 1216 | 323.3 |
| A | 0 | 29 | 4108 | 8.94 | 1299 | 1216 | 323.3 |
| A | 9 | 19 | 4019 | 8.67 | 1299 | 1216 | 323.3 |
| B | 2 | 9 | 4212 | 11.61 | 1304 | 1239 | 256.0 |
| B | 3 | 17 | 3518 | 8.9 | 1304 | 1239 | 256.0 |
| B | 3 | 80 | 3483 | 8.76 | 1304 | 1239 | 256.0 |
| C | 1 | 81 | 4172 | 8.74 | 1319 | 1229 | 336.9 |
| C | 1 | 80 | 4004 | 8.24 | 1319 | 1229 | 336.9 |
| C | 3 | 203 | 3948 | 8.07 | 1319 | 1229 | 336.9 |
| D | 7 | 3 | 3175 | 6.43 | 1210 | 1100 | 322.6 |
| D | 4 | 160 | 3092 | 6.17 | 1210 | 1100 | 322.6 |
| D | 6 | 62 | 3069 | 6.1 | 1210 | 1100 | 322.6 |
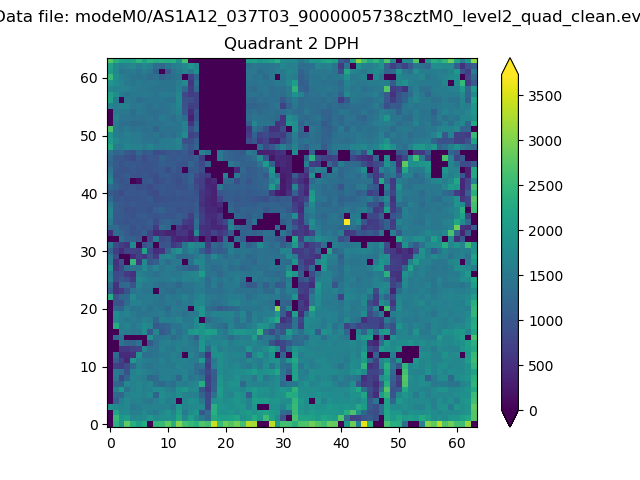
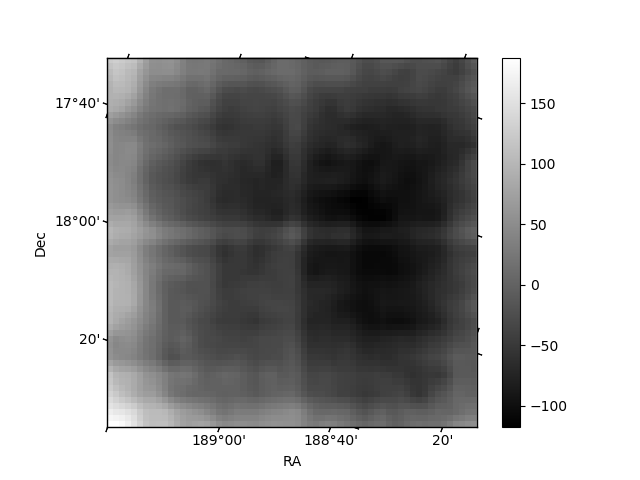
Histogram calculated using DETX and DETY for each event in the final _common_clean file
| Quadrant A |  |
 |
Quadrant B |
|---|---|---|---|
| Quadrant D |  |
 |
Quadrant C |
| Plot type | Count rate plots | Images |
|---|---|---|
| Comparison with Poisson distribution Blue bars denote a histogram of data divided into 1 sec bins. Red curve is a Poisson curve with rate = median count rate of data. |
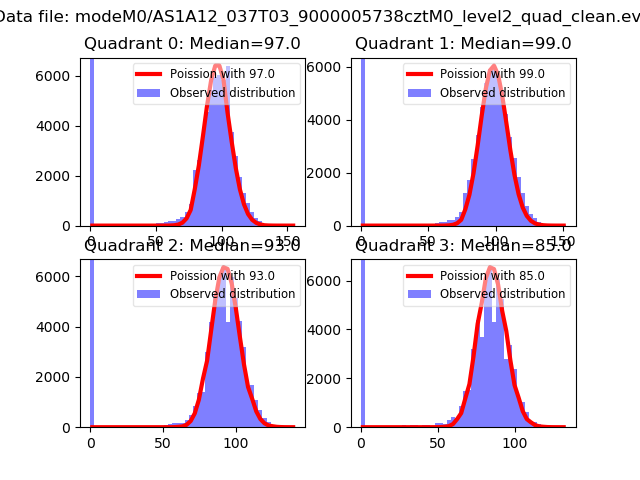 |
 |
| Quadrant-wise count rates Data is divided into 100 sec bins |
 |
|
| Module-wise count rates for Quadrant A Data is divided into 100 sec bins |
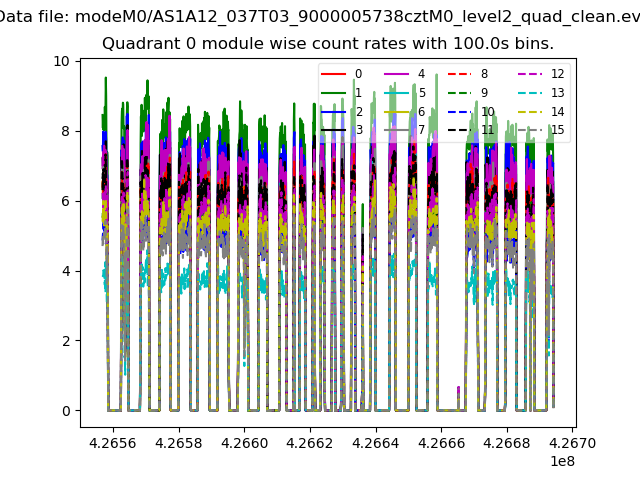 |
 |
| Module-wise count rates for Quadrant B Data is divided into 100 sec bins |
 |
 |
| Module-wise count rates for Quadrant C Data is divided into 100 sec bins |
 |
 |
| Module-wise count rates for Quadrant D Data is divided into 100 sec bins |
 |
 |
| Parameter | Plot |
|---|---|
| CZT HV Monitor |  |
| D_VDD |  |
| Temperature 1 |  |
| Veto HV Monitor |  |
| Veto LLD |  |
| Alpha Counter |  |
| _CPM_Rate |  |
| CZT Counter |  |
| +2.5 Volts monitor |  |
| +5 Volts monitor |  |
| _ROLL_ROT |  |
| _Roll_DEC | 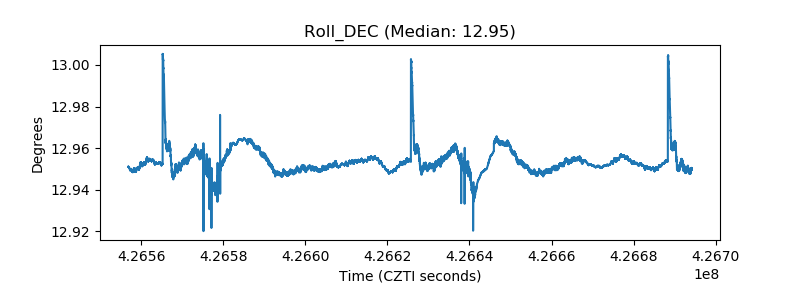 |
| _Roll_RA |  |
| Veto Counter | 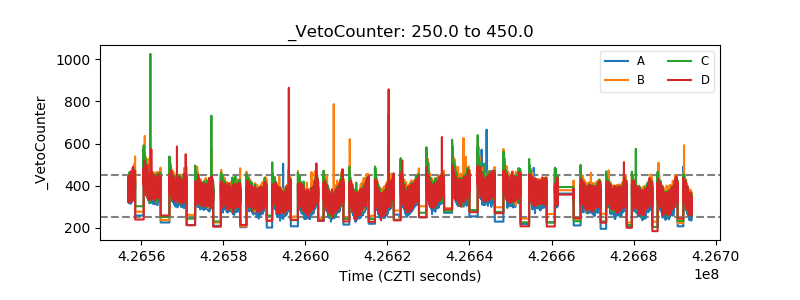 |