| Param | Original file | Final file |
|---|---|---|
| Filename | modeM0/AS1A12_044T22_9000005740cztM0_level2.fits | modeM0/AS1A12_044T22_9000005740cztM0_level2_quad_clean.evt |
| Size (bytes) | 261,336,960 | 247,348,800 |
| Size | 249.2 MB | 235.9 MB |
| Events in quadrant A | 1,515,268 | 1,374,854 |
| Events in quadrant B | 1,511,106 | 1,464,572 |
| Events in quadrant C | 1,547,260 | 1,384,431 |
| Events in quadrant D | 1,307,128 | 1,233,200 |
| Mode M0 | |||
|---|---|---|---|
| Quadrant | BADHDUFLAG | Total packets | Discarded packets |
| A | 0 | 95667 | 0 |
| B | 0 | 60193 | 0 |
| C | 0 | 59635 | 0 |
| D | 0 | 76517 | 0 |
| Mode SS | |||
|---|---|---|---|
| Quadrant | BADHDUFLAG | Total packets | Discarded packets |
| A | 0 | 604 | 0 |
| B | 0 | 604 | 0 |
| C | 0 | 604 | 0 |
| D | 0 | 604 | 0 |
| Mode M9 | |||
|---|---|---|---|
| Quadrant | BADHDUFLAG | Total packets | Discarded packets |
| A | 0 | 105 | 0 |
| B | 0 | 106 | 0 |
| C | 0 | 106 | 0 |
| D | 0 | 106 | 0 |
| Quadrant | Total seconds | Saturated seconds | Saturation percentage |
|---|---|---|---|
| A | 29570 | 1296 | 4.382820% |
| B | 29574 | 109 | 0.368567% |
| C | 29573 | 18 | 0.060866% |
| D | 29576 | 1398 | 4.726806% |
Noise dominated data is calculated using 1-second bins in cleaned event files. If a bin has >2000 counts, and if more than 50% of those come from <1% of pixels, then it is considered to be noise-dominated and hence unusable.
| Quadrant | # 1 sec bins | Bins with >0 counts | Bins with >2000 counts | High rate bins dominated by noise | Noise dominated (total time) | Noise dominated (detector-on time) | Marked lightcurve |
|---|---|---|---|---|---|---|---|
| A | 46628 | 29571 | 0 | 0 | 0.00% | 0.00% | 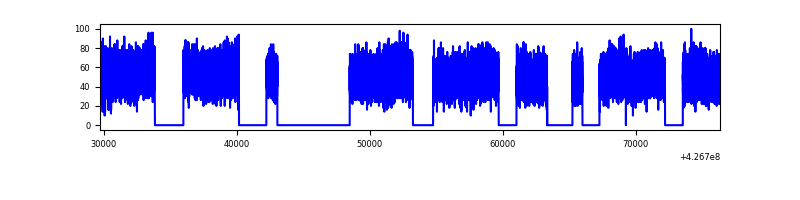 |
| B | 46628 | 29571 | 0 | 0 | 0.00% | 0.00% | 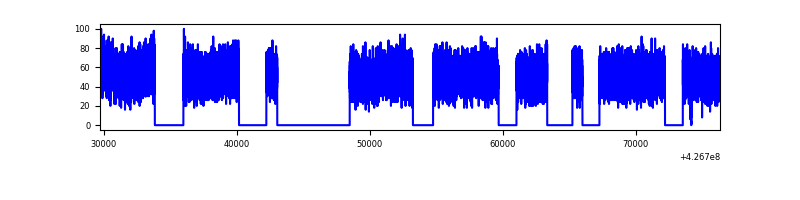 |
| C | 46628 | 29573 | 0 | 0 | 0.00% | 0.00% | 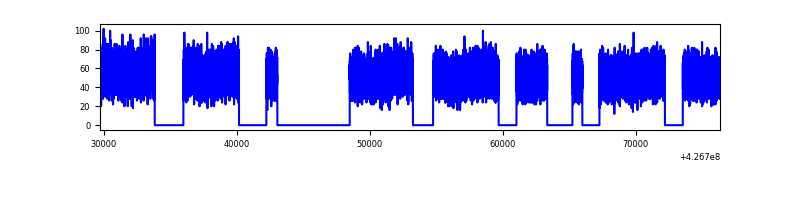 |
| D | 46628 | 29552 | 0 | 0 | 0.00% | 0.00% |  |
Top three noisy pixels from each quadrant. If the there are fewer than three noisy pixels in the level2.evt file, extra rows are filled as -1
| Pixel properties | Quadrant properties | ||||||
|---|---|---|---|---|---|---|---|
| Quadrant | DetID | PixID | Counts | Sigma | Mean | Median | Sigma |
| A | 9 | 19 | 1242 | 8.52 | 395 | 368 | 102.6 |
| A | 7 | 110 | 1229 | 8.39 | 395 | 368 | 102.6 |
| A | 0 | 29 | 1202 | 8.13 | 395 | 368 | 102.6 |
| B | 2 | 9 | 1303 | 11.43 | 399 | 379 | 80.8 |
| B | 3 | 80 | 1120 | 9.17 | 399 | 379 | 80.8 |
| B | 3 | 17 | 1089 | 8.78 | 399 | 379 | 80.8 |
| C | 1 | 81 | 1249 | 8.15 | 409 | 383 | 106.3 |
| C | 3 | 202 | 1227 | 7.94 | 409 | 383 | 106.3 |
| C | 3 | 203 | 1220 | 7.88 | 409 | 383 | 106.3 |
| D | 7 | 3 | 992 | 6.37 | 374 | 340 | 102.4 |
| D | 10 | 189 | 947 | 5.93 | 374 | 340 | 102.4 |
| D | 6 | 67 | 930 | 5.76 | 374 | 340 | 102.4 |
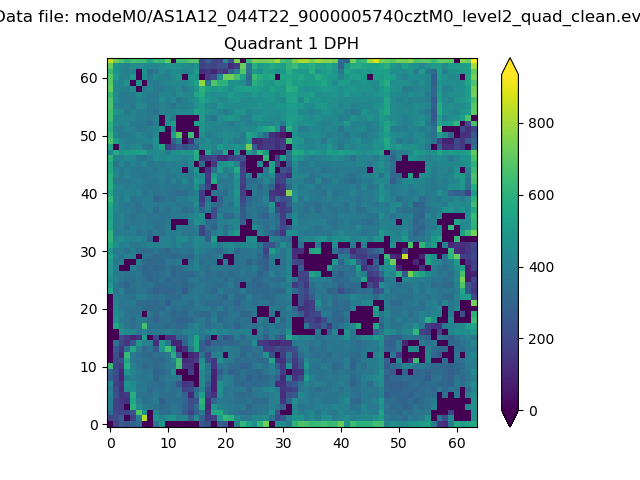
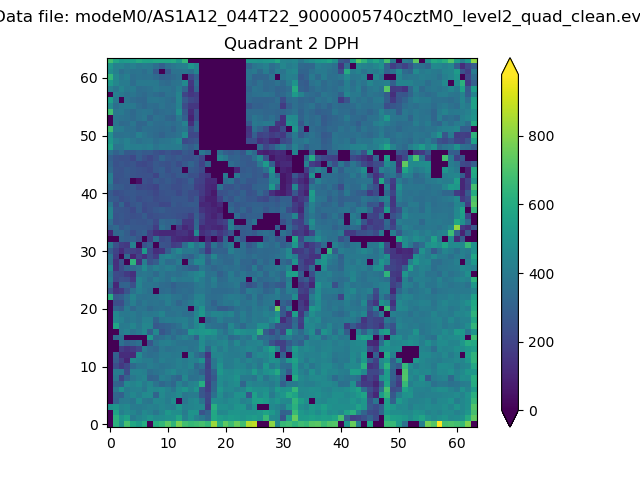
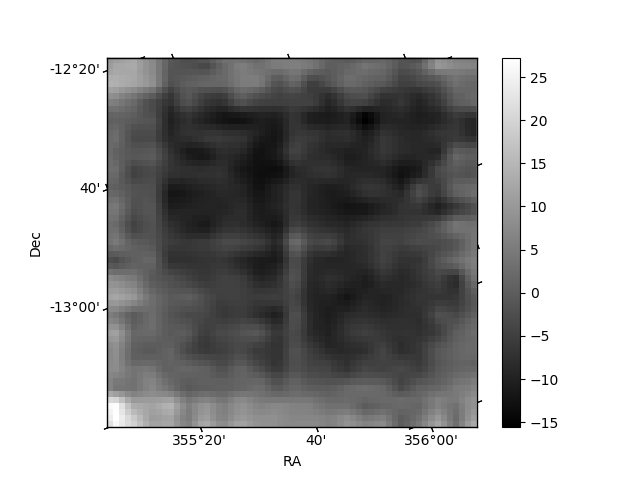
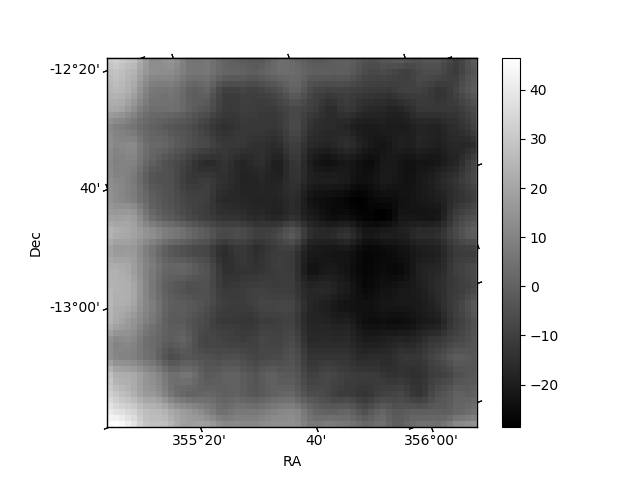
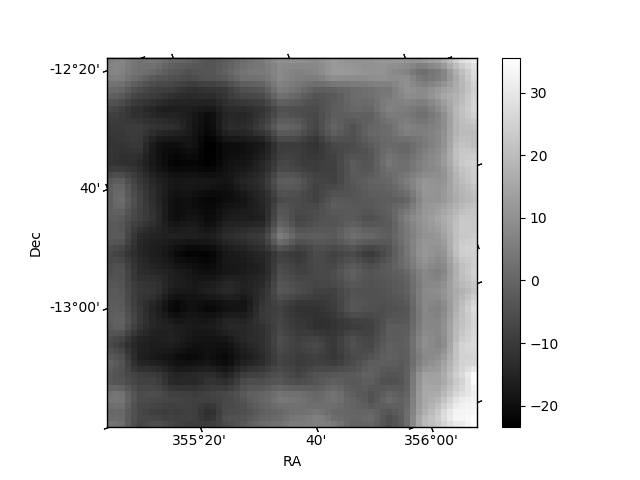
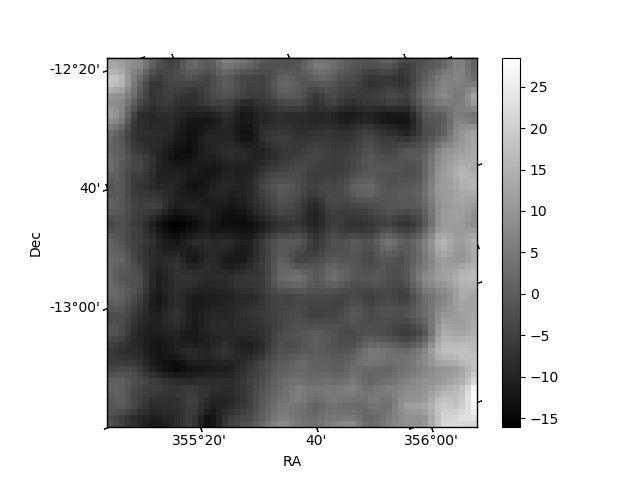
Histogram calculated using DETX and DETY for each event in the final _common_clean file
| Quadrant A | 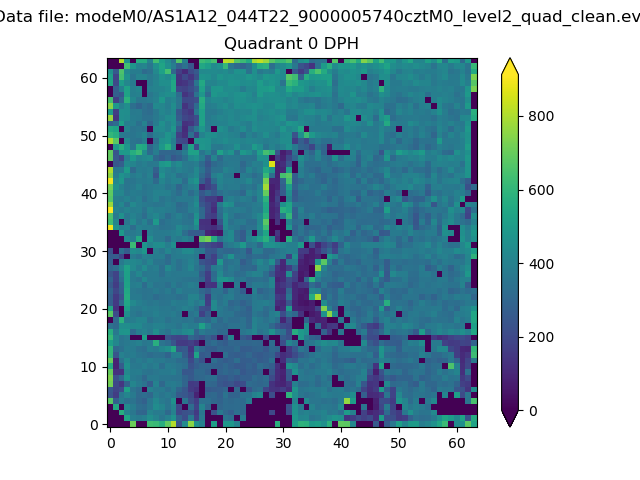 |
 |
Quadrant B |
|---|---|---|---|
| Quadrant D | 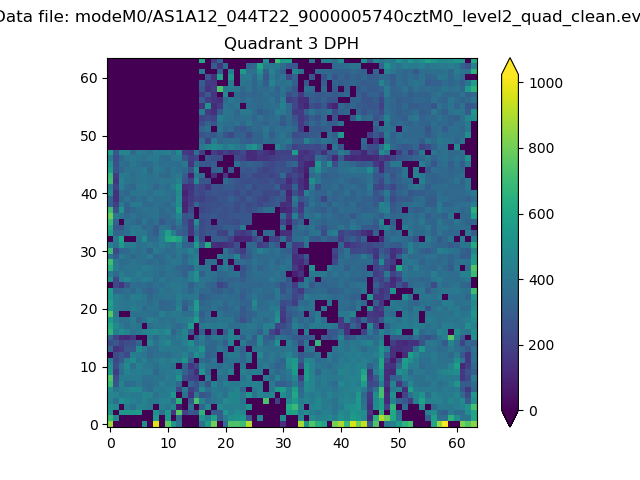 |
 |
Quadrant C |
| Plot type | Count rate plots | Images |
|---|---|---|
| Comparison with Poisson distribution Blue bars denote a histogram of data divided into 1 sec bins. Red curve is a Poisson curve with rate = median count rate of data. |
 |
 |
| Quadrant-wise count rates Data is divided into 100 sec bins |
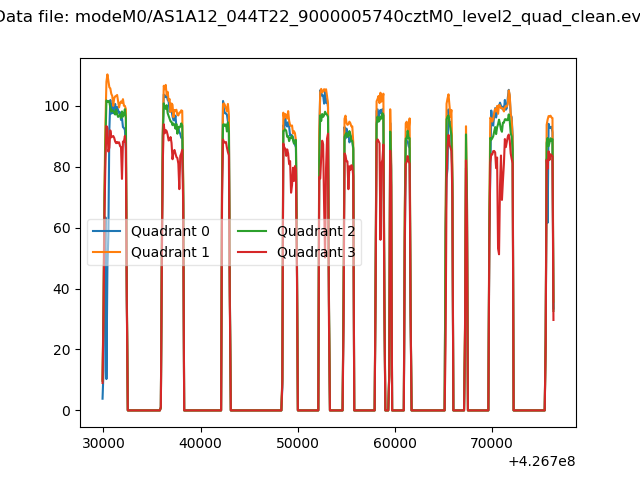 |
|
| Module-wise count rates for Quadrant A Data is divided into 100 sec bins |
 |
 |
| Module-wise count rates for Quadrant B Data is divided into 100 sec bins |
 |
 |
| Module-wise count rates for Quadrant C Data is divided into 100 sec bins |
 |
 |
| Module-wise count rates for Quadrant D Data is divided into 100 sec bins |
 |
 |
| Parameter | Plot |
|---|---|
| CZT HV Monitor | 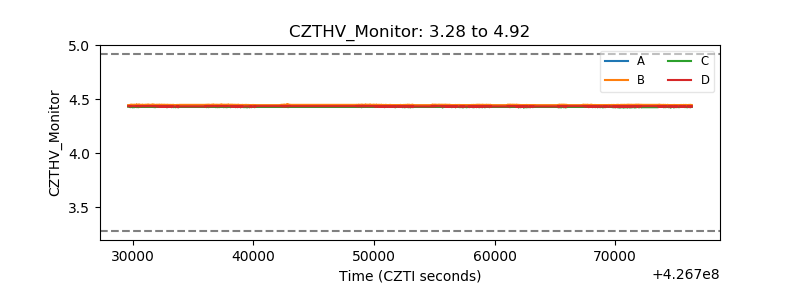 |
| D_VDD | 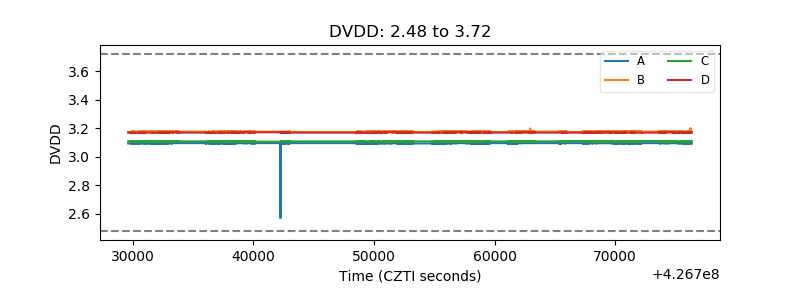 |
| Temperature 1 | 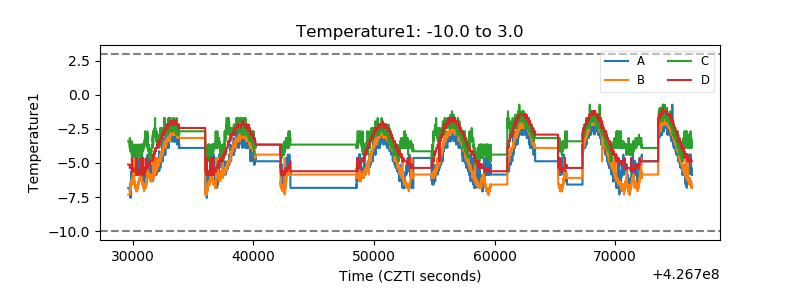 |
| Veto HV Monitor | 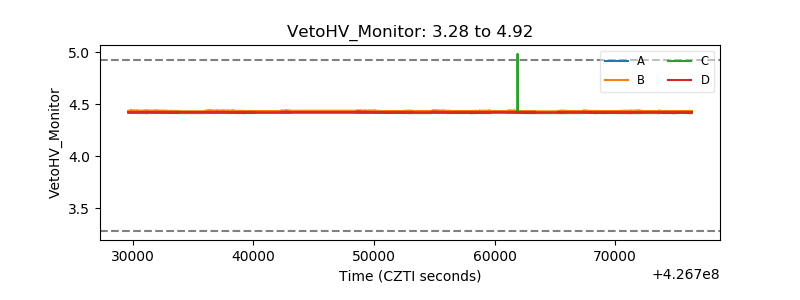 |
| Veto LLD | 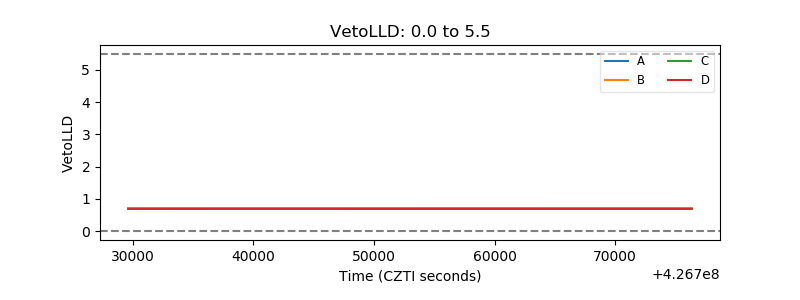 |
| Alpha Counter |  |
| _CPM_Rate | 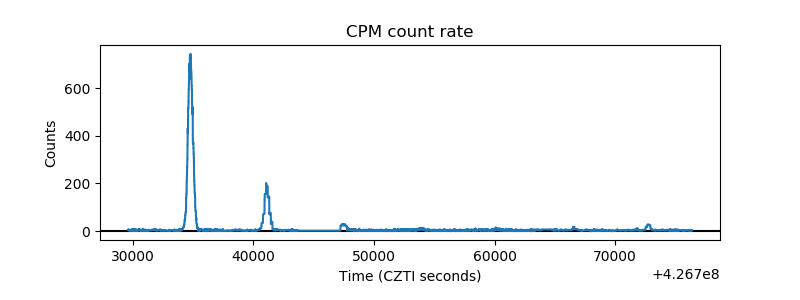 |
| CZT Counter |  |
| +2.5 Volts monitor |  |
| +5 Volts monitor | 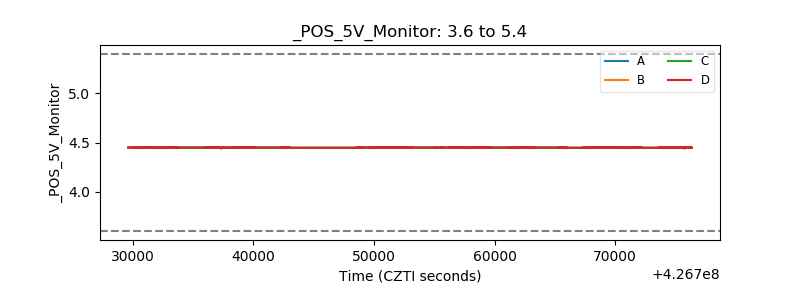 |
| _ROLL_ROT |  |
| _Roll_DEC | 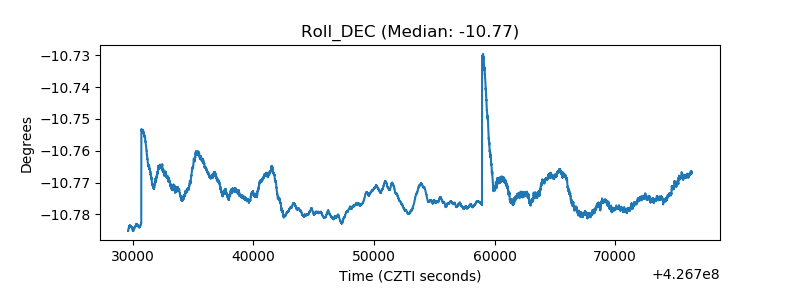 |
| _Roll_RA | 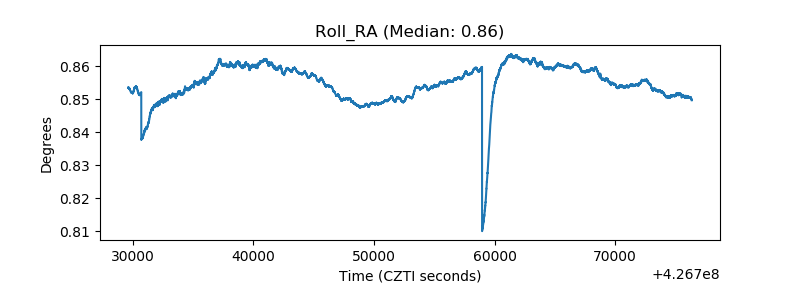 |
| Veto Counter | 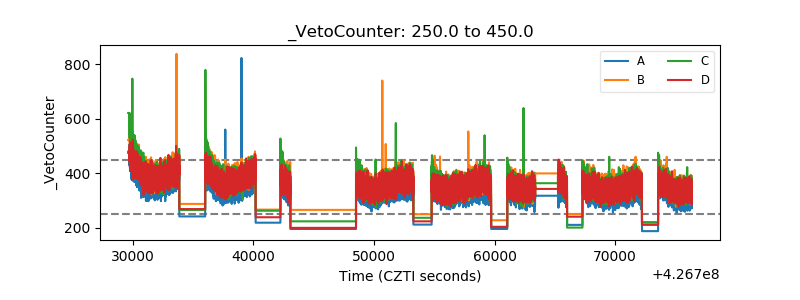 |